HAL Id: halshs-00653441
https://halshs.archives-ouvertes.fr/halshs-00653441
Preprint submitted on 19 Dec 2011
HAL is a multi-disciplinary open access
archive for the deposit and dissemination of sci-entific research documents, whether they are pub-lished or not. The documents may come from teaching and research institutions in France or
L’archive ouverte pluridisciplinaire HAL, est destinée au dépôt et à la diffusion de documents scientifiques de niveau recherche, publiés ou non, émanant des établissements d’enseignement et de recherche français ou étrangers, des laboratoires
Innovative procedures: the key factor for hospital
performance
Laurent Gobillon, Carine Milcent
To cite this version:
Laurent Gobillon, Carine Milcent. Innovative procedures: the key factor for hospital performance. 2011. �halshs-00653441�
WORKING PAPER N° 2011 – 42
Innovative procedures: the key factor for hospital performance
Laurent Gobillon Carine Milcent
JEL Codes: I12, I18
Keywords: Hospital performance, Innovative procedures, Stratified duration model
P
ARIS-
JOURDANS
CIENCESE
CONOMIQUES48, BD JOURDAN – E.N.S. – 75014 PARIS TÉL. : 33(0) 1 43 13 63 00 – FAX : 33 (0) 1 43 13 63 10
Innovative procedures:
a key factor for hospital performance?
September 27, 2011
Laurent Gobillon1 Carine Milcent2
The role of innovative procedures in the mortality differences between university, non-teaching public and for-profit hospitals is investigated using a French exhaustive administrative dataset on patients admitted for heart attack. Mortality is roughly similar in the three types of hospitals after controlling for case-mix. For-profit hospitals treat the at-risk oldest patients more often with innovative procedures. Therefore, additionnally controlling for innovative procedures makes them having the highest mortality rate. Non-teaching public hospitals end up having the lowest mortality rate.
Keywords: hospital performance, innovative procedures, stratified duration model JEL code: I12, I18
1Corresponding author. INED, PSE, CREST and CEPR. INED, 133 boulevard Davout, 75980 Paris Cedex. Tel:
0033(1)56062016. Email: [email protected]. Webpage: http://laurent.gobillon.free.fr.
2PSE (CNRS-EHESS-ENPC-ENS), 48 boulevard Jourdan, 75014 Paris. Email: [email protected]. Webpage:
Introduction
In many countries, there is debate among politicians and scholars about the extent to which hospital ownership status influences hospital performance. An extensive literature has developed in the US to compare the performances of for-profit and not-for-profit hospitals (Sloan, 2000). European countries usually have a mix of for-profit hospitals which select their patients and public hospitals which have to treat all patients.
For-profit hospitals are most often considered to be profit-maximizing entities and each unit of disposable medical supply used for a procedure is fully reimbursed.3 By contrast, public hospitals have a restrictive global budget provided by the government and the total cost of disposable medical supplies is charged to this budget. The budget is more important for university hospitals than for non-teaching public hospitals, and university hospitals are able to perform more innovative procedures.
In this paper, we study the mortality differences between university, other public and for-profit hospitals in France for patients admitted for a heart attack.4 Our approach contrasts with other studies which do not distinguish university hospitals from other public hospitals. We assess to what extent mortality differences can be explained by differences in case-mix and use of innovative procedures.5 Our empirical strategy relies on the estimation of a very flexible duration model with hospital-specific baseline hazards on a French exhaustive administrative dataset. The literature is plagued by two types of selection issues. First, as in the US, the type of insurance can vary across patients. A selection effect occurs if patients with better insurance coverage are admitted to a specific type of hospital. To overcome this issue, one can focus on patients with the same insurance (McClellan and Staiger, 2000) or study countries where there is universal coverage such as Taiwan (Lien, Chou and Liu, 2008). This is also the case in France where a single payer reimburses costs at a flat rate to all patients.
A selection bias also appears when patients with the lowest chances of survival due to
3 There is still an ongoing debate on the objective function of hospitals. Duggan (2000) shows for the US that the
profit-maximization hypothesis fits the data better for for-profit hospitals than for public hospitals. No such test has been carried out for France.
4 In France, there are also some not-for-profit hospitals that are funded as public hospitals but run as private ones.
They treat only 4.8% of the AMI patients and are excluded from our analysis. Their inclusion does not change the results.
5 There is an abundant literature on the use of innovative procedures. It focuses on hospital costs (Cutler and
Huckman, 2003), technology diffusion (Skinner and Staiger, 2009), but not on the link between mortality and ownership.
morbidities and secondary diagnoses tend to be admitted to or transferred from a specific type of hospitals. In France, for-profit hospitals may refuse the sickest patients to maximize their profit (as in-death is costly and their reputation depends on their success statistics) whereas public hospitals have to treat them. Non-teaching public hospitals may transfer the sickest patients because they do not have the proper equipment to treat them. We limit this bias in our study by controlling for a wide range of secondary diagnoses.
Data
We use the exhaustive data on stays in French hospitals provided by the “Programme de Médicalisation des Systèmes d'Information” over the 1998-2003 period. We select patients aged over 35 admitted to a university, non-teaching public or a for-profit hospital for an acute myocardial infarction (heart attack).
We know the duration of stay and the type of entry: whether patients come from home, or were transferred from another service or hospital. As we do not have any details on the previous stay for transferred patients, we focus on patients coming from home. We end up with a sample of 325,760 patients in 1,020 hospitals, among whom 21.0% are in for-profit hospitals, 28.5% are in university hospitals and 50.6% are in other public hospitals.
We also know the type of exit: death (8%), home return (59%), transfer to another service (2%), to another acute care hospital (24%) or to another type of hospital (7%). We focus here on exits to death. As we cannot follow patients when they are discharged, all other exits are treated as right-censored.
We have information on the age and sex of patients, as well as secondary diagnoses and treatment procedures. Detailed diagnoses are related to the way of life (smoking, alcoholism, obesity, hypertension), chronic health problems (diabetes, conduction diseases, history of coronary disease), disease complications (renal failure, heart failure), and location of heart attack (anterior, posterior, sub-endocardial, other).
Among treatments, we can distinguish between bypass surgery, which is a traditional procedure, and catheter, angioplasty and stent, which are more recent procedures. All these procedures are intended to deal with the clogged section of a vein or an artery which caused the heart attack. A bypass surgery reroute involves grafting a vein or artery taken from elsewhere in the body to
bypass the blockage. A catheter is a thin tube inserted into a vein to facilitate injections and drips. Angioplasty consists in inflating a balloon catheter to crush a blockage and open up the blood vessel for improved flow. The stent is a spring-shaped prosthesis used as a complement to angioplasty to keep the artery dilated. This was the most innovative procedure in use during our period of study and its use has increased over time.
For each hospital, we compute the Kaplan-Meier estimator for exit to death while other types of exits are treated as censored. The probability of death is constructed for each hospital as one minus the Kaplan-Meier estimator. It is then averaged by ownership status, weighting by the number of patients admitted to the hospital. Graph 1 shows the probability of death as a function of the duration (in days) by ownership status. This probability is similar for for-profit and university hospitals, but is significantly higher for non-teaching public hospitals. For instance, the probability of death after 5 days is 4.2% for for-profit hospitals, 4.3% for university hospitals and 6.6% for other public hospitals, as shown in Appendix Table A.1.
Table 1 presents some descriptive statistics by ownership status on exits, demographic characteristics, secondary diagnoses and procedures. In particular, transfer rates are very similar for for-profit and university hospitals. Other public hospitals have a higher rate of transfers to other acute care hospitals, probably because they are less able to treat patients needing surgery. For-profit and university hospitals both treat a smaller proportion of patients aged above 80 than other public hospitals. They use more than twice as many catheters as other public hospitals (70% vs. 28%). Treatments with stents are more than three times more likely (40% and 36% vs. 11%). We now propose an approach to assess whether the differences in mortality between for-profit, university and other public hospitals are due to differences in patients' attributes, treatment procedures or intrinsic quality of the hospital.
Empirical strategy
Let i index the patient and j(i) the hospital where patient i is admitted. We focus on the latent duration before death, the other exits being treated as censored. We consider that this latent duration follows a Cox model stratified by hospital. The hazard rate is given by:
( )
(
)
λ ( )( )
(
β)
λt Xi, ji = ji t exp Xiwhere Xi includes the patient's characteristics (age, sex, secondary diagnoses) and the procedures. The vector of coefficients β captures their effect on mortality. λj
( )
t is the hazard rate specific to hospital j which is left completely unspecified, allowing for considerable flexibility in the way hospitals may differ, in particular because of their ownership status.The parameters of the patients' variables are estimated by Stratified Partial Likelihood (Ridder and Tunali, 1999). For every hospital j , an estimator Λˆ j
( )
t of the integrated hazard( )
=∫
( )
Λj t t j t dt
0λ and its covariance matrix can be recovered in a second stage using the
estimator proposed by Breslow (1974). The probability of death after a duration t is given by:
( )
(
− ˆΛj t)
exp , its covariance matrix being recovered using the delta method.
For each duration, we average the probability of death across hospitals by ownership (for-profit, university or other public), weighting the hospitals by the number of admitted patients. We compare the probability of death for for-profit, university and other public hospitals when introducing different sets of patients' variables (individual characteristics and/or treatment procedures). This approach allows us to compare the probabilities of death between the three types of hospitals across durations.
Results
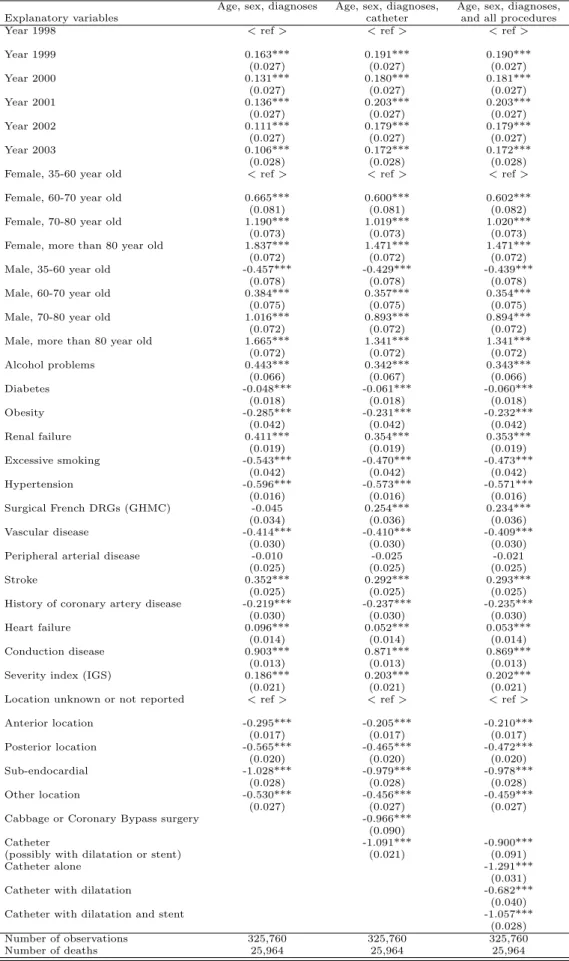
Table 2 reports the estimated coefficients of patients' variables for three specifications. In column (1), only variables related to age, sex and secondary diagnoses are introduced. As usually reported in the literature, older people and females are more likely to die. The propensity to die decreases from 1999 onwards, maybe because care and knowledge about treatments improve.6 Secondary diagnoses have a negative or positive effect on mortality. The negative effect is a little surprising, but patients with some detected pathologies may be better monitored and thus better treated than other patients. Finally, the location of infarctus given by secondary diagnoses is an important determinant of the propensity to die.
In column (2), we add a dummy for catheter (possibly used jointly with an angioplasty or a stent) which is intended to capture a specific treatment but may also pick up some unobserved
6 Note that, surprisingly, the propensity to die is lowest in 1998. This may be due to coding errors, as 1998 is the first
year for which exhaustive data are available. We assessed the robustness of the results excluding 1998 data and the results remain very similar.
heterogenity.7 It has the expected negative effect on mortality. Finally, in column (3), we replace the dummy for catheter by dummies for detailed procedures (catheter only, angioplasty with catheter, stent with angioplasty and catheter). All the procedures have the expected negative effect on mortality. Note that the estimated coefficient of stent is lower in absolute terms than the estimated coefficient of catheter, whereas patients treated with a stent also have a catheter and their care is more costly for the hospital. In fact, surgeons treating patients first use a catheter, and then add stents if they consider them necessary because the patients' arteries or veins are too damaged.
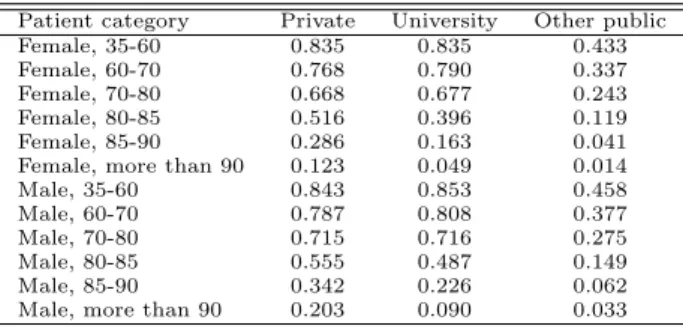
We now investigate the differences in probability of death between for-profit, university and other public hospitals when controlling for the different subsets of individual variables. Graph 2 represents the probability of death as a function of duration by type of hospital when controlling only for age, sex, and secondary diagnoses in the first stage.8 The probabilities of death between for-profit, university and other public hospitals are roughly similar, the mortality rate in university hospitals remaining slightly lower than in other hospitals. Hence, composition effects are enough to explain the differences in probability of death. Graph 3 represents the probabilities of death obtained from the model when adding a dummy for catheter (possibly used jointly with an angioplasty or a stent). Non-teaching public hospitals now have the lowest mortality rates. This change can be explained by the more intensive use of catheters in university and for-profit hospitals allowing to avoid deaths. This effect is now netted out. Interestingly, there is now a large gap between for-profit and university hospitals whereas their catheter use is similar. This arises because their intensity of catheter use differs for some categories of patients. In particular, for-profit hospitals use catheters more intensively in the treatment of at-risk oldest patients than university hospitals. The catheter rate in for-profit hospitals is as high as 20.3% for males more than 90 years old, whereas it is only 9.0% in university hospitals (see Table A.2).
It is possible to draw a comparison with clinical trials showing that aspirin, beta blockers and reperfusion explain the substantial difference of 3.9 points in one-year survival between the highest and lowest quintiles of US hospitals ranked according to their rate of innovation diffusion
7 We also added a dummy for by-pass surgery but its introduction is innocuous for the analysis since only 0.9% of
patients in our sample are treated with by-pass surgery. We could check that the introduction of this dummy does not affect our results.
8 The level of probabilities cannot be directly compared between Graph 1 and Graphs 2-4. Graph 1 represents the
average probability of death by ownership status. By contrast, Graphs 2-4 represent the probability of death for the reference category of the model by ownership status. Nevertheless, it is still meaningful to compare the differences in probability of death between university, non-teaching public and for-profit hospitals across graphs.
across time (Skinner and Staiger, 2009). Here, catheters have an impact of 4.5 points on the mortality difference between for-profit and other public hospitals, which is also large. Results are confirmed by Graph 4 which represents the probabilities of death obtained when replacing the catheter by some dummies for detailed procedures. We see that the curves remain unchanged.
Conclusion
This paper investigates the differences in mortality between university, non-teaching public and for-profit hospitals. Mortality is roughly similar in the three types of hospitals after controlling for case-mix. For-profit hospitals treat the at-risk oldest patients more often with innovative procedures. Therefore, additionnally controlling for innovative procedures makes them having the highest mortality rate. Non-teaching public hospitals end up having the lowest mortality rate. What remains to be investigated is why there are still some mortality differences between the different types of hospitals when holding constant observable patients' charactistics and treatments.
References
Breslow N.E. (1974), Covariance Analysis of Censored Survival Data, Biometrics, 30, pp. 89-99. Cutler D. and R. Huckman (2003), Technological Development and Medical Productivity: The Diffusion of Angioplasty in New York State, Journal of Health Economics, 22(2), pp. 187-217.
Duggan M. (2000), Hospital Ownership and Public Medical Spending, Quaterly Journal of
Economics, 115(4), pp. 1343-1373.
Lien H., Chou S. and J. Liu (2008), Hospital ownership and performance: Evidence from stroke and cardiac treatment in Taiwan, Journal of Health Economics, 27, pp. 1208--1223.
McClellan M. and D.O. Staiger (2000), Comparing Hospital Quality at For-Profit and Not-for-Profit Hospitals, in The Changing Hospital Industry: Comparing Not-for-Not-for-Profit and For-Not-for-Profit
Institutions, D.M. Cutler ed., University of Chicago Press.
Ridder G. and I. Tunali (1999), Stratified partial likelihood estimation, Journal of Econometrics, 92(2), pp. 193-232.
Sloan F. (2000), Not-for-Profit Ownership and Hospital Behavior, in Handbook of Health Economics, vol. 1, ed. Culyer A.J. and J.P. Newhouse, Elsevier Science B.V., pp. 1141-1174.
Skinner J. and D. Staiger (2009), Technology Diffusion and Productivity Growth in Healthcare, NBER Working Paper 14865.
Table 1: Descriptive statistics
For-profit University Other public All
Type of exit
Death 0.060 0.064 0.097 0.080
Home 0.699 0.697 0.481 0.588
Transfer to another service 0.005 0.013 0.029 0.019
Transfer to another acute care hospital 0.149 0.140 0.335 0.241
Transfer to another type of hospital 0.087 0.086 0.058 0.072
Demographic characteristics
Female, 35-60 year old 0.035 0.041 0.031 0.035
Female, 60-70 year old 0.046 0.045 0.043 0.044
Female, 70-80 year old 0.100 0.088 0.108 0.101
Female, more than 80 year old 0.102 0.106 0.171 0.138
Male, 35-60 year old 0.268 0.311 0.219 0.256
Male, 60-70 year old 0.174 0.169 0.141 0.156
Male, 70-80 year old 0.189 0.162 0.175 0.174
Male, more than 80 year old 0.087 0.076 0.111 0.096
Secondary diagnoses Alcohol problems 0.011 0.009 0.013 0.012 Diabetes 0.169 0.144 0.152 0.153 Obesity 0.082 0.065 0.052 0.062 Renal failure 0.046 0.046 0.052 0.049 Excessive smoking 0.144 0.143 0.098 0.120 Hypertension 0.356 0.277 0.284 0.297 Surgical French DRGs (GHMC) 0.046 0.062 0.018 0.036 Vascular disease 0.068 0.030 0.040 0.043
Peripheral arterial disease 0.076 0.052 0.060 0.061
Stroke 0.033 0.025 0.033 0.031
History of coronary artery disease 0.058 0.030 0.037 0.039
Heart failure 0.130 0.129 0.183 0.156
Conduction disease 0.203 0.156 0.214 0.195
Severity index (IGS) 0.270 0.228 0.305 0.276
Location unknown or not reported 0.321 0.253 0.283 0.282
Anterior location 0.325 0.269 0.278 0.285
Posterior location 0.113 0.092 0.117 0.109
Sub-endocardial 0.103 0.064 0.088 0.085
Other location 0.138 0.322 0.233 0.239
Treatments
Cabbage or Coronary Bypass surgery 0.015 0.020 0.000 0.009
Catheter (possibly with angioplasty/stent) 0.704 0.698 0.278 0.487
Catheter alone 0.238 0.231 0.146 0.190
Catheter with dilatation 0.061 0.112 0.022 0.056
Catheter with dilatation and stent 0.405 0.355 0.109 0.241
Note: another service refers to a service which is not ischemic, patients being treated there for a pathology different from their AMI.
Table 2: Cox model stratified by hospital, propensity to die
Age, sex, diagnoses Age, sex, diagnoses, Age, sex, diagnoses,
Explanatory variables catheter and all procedures
Year 1998 < ref > < ref > < ref >
Year 1999 0.163*** 0.191*** 0.190*** (0.027) (0.027) (0.027) Year 2000 0.131*** 0.180*** 0.181*** (0.027) (0.027) (0.027) Year 2001 0.136*** 0.203*** 0.203*** (0.027) (0.027) (0.027) Year 2002 0.111*** 0.179*** 0.179*** (0.027) (0.027) (0.027) Year 2003 0.106*** 0.172*** 0.172*** (0.028) (0.028) (0.028)
Female, 35-60 year old < ref > < ref > < ref >
Female, 60-70 year old 0.665*** 0.600*** 0.602***
(0.081) (0.081) (0.082)
Female, 70-80 year old 1.190*** 1.019*** 1.020***
(0.073) (0.073) (0.073)
Female, more than 80 year old 1.837*** 1.471*** 1.471***
(0.072) (0.072) (0.072)
Male, 35-60 year old -0.457*** -0.429*** -0.439***
(0.078) (0.078) (0.078)
Male, 60-70 year old 0.384*** 0.357*** 0.354***
(0.075) (0.075) (0.075)
Male, 70-80 year old 1.016*** 0.893*** 0.894***
(0.072) (0.072) (0.072)
Male, more than 80 year old 1.665*** 1.341*** 1.341***
(0.072) (0.072) (0.072) Alcohol problems 0.443*** 0.342*** 0.343*** (0.066) (0.067) (0.066) Diabetes -0.048*** -0.061*** -0.060*** (0.018) (0.018) (0.018) Obesity -0.285*** -0.231*** -0.232*** (0.042) (0.042) (0.042) Renal failure 0.411*** 0.354*** 0.353*** (0.019) (0.019) (0.019) Excessive smoking -0.543*** -0.470*** -0.473*** (0.042) (0.042) (0.042) Hypertension -0.596*** -0.573*** -0.571*** (0.016) (0.016) (0.016) Surgical French DRGs (GHMC) -0.045 0.254*** 0.234*** (0.034) (0.036) (0.036) Vascular disease -0.414*** -0.410*** -0.409*** (0.030) (0.030) (0.030)
Peripheral arterial disease -0.010 -0.025 -0.021
(0.025) (0.025) (0.025)
Stroke 0.352*** 0.292*** 0.293***
(0.025) (0.025) (0.025)
History of coronary artery disease -0.219*** -0.237*** -0.235***
(0.030) (0.030) (0.030)
Heart failure 0.096*** 0.052*** 0.053***
(0.014) (0.014) (0.014)
Conduction disease 0.903*** 0.871*** 0.869***
(0.013) (0.013) (0.013)
Severity index (IGS) 0.186*** 0.203*** 0.202***
(0.021) (0.021) (0.021)
Location unknown or not reported < ref > < ref > < ref >
Anterior location -0.295*** -0.205*** -0.210*** (0.017) (0.017) (0.017) Posterior location -0.565*** -0.465*** -0.472*** (0.020) (0.020) (0.020) Sub-endocardial -1.028*** -0.979*** -0.978*** (0.028) (0.028) (0.028) Other location -0.530*** -0.456*** -0.459*** (0.027) (0.027) (0.027)
Cabbage or Coronary Bypass surgery -0.966***
(0.090)
Catheter -1.091*** -0.900***
(possibly with dilatation or stent) (0.021) (0.091)
Catheter alone -1.291***
(0.031)
Catheter with dilatation -0.682***
(0.040)
Catheter with dilatation and stent -1.057***
(0.028)
Number of observations 325,760 325,760 325,760
Figure 1: Probabil it y of death as a function o f duration (in da ys) Kaplan-Meier Mo del: Age, se x and secondary diagnoses Mo del: Age, sex, secondary diagnoses and catheter Mo del: Age, sex, secondary diagnoses and pro cedures
T able A.1: Probabilit y of death b y mo del and hospital statu s Kaplan-Meier Mo del : Mo del : age, sex, Mo del : age, sex, age, sex and diagno ses diagnoses and catheter diagnoses and pro cedures F or-profit Univ ersit y Other public F or-profit Univ er s it y Other public F or-profit Univ ersit y Other public F or-profit Univ ersit y Other public 1 da y .012 .014 .023 .015 .016 .020 .020 .019 .0 19 .020 .018 .019 [.012,.013] [.013,.015] [.02 2,.024] [.014,.016] [.015,.017] [.019,.021] [.018,.021] [.017,.02 0] [.018,.019] [.018,.021] [. 0 17,.019] [.018,.019] 3 da ys .029 .030 .04 8 .0 34 .035 .042 .046 .041 .039 .04 6 .040 .039 [.028,.030] [.029,.031] [.04 7,.049] [.033,.036] [.033,.036] [.041,.043] [.043,.048] [.039,.04 3] [.038,.041] [.043,.048] [. 0 39,.042] [.038,.041] 5 da ys .042 .043 .06 6 .0 49 .050 .057 .066 .058 .054 .06 5 .058 .054 [.041,.044] [.042,.045] [.06 5,.068] [.047,.051] [.048,.052] [.056,.059] [.063,.069] [.056,.06 1] [.052,.055] [.062,.068] [. 0 56,.060] [.052,.056] 10 da ys .074 .071 .104 .079 .076 .085 .107 .089 .080 .106 .088 .0 80 [.071,.077] [.068,.073] [.10 2,.106] [.076,.083] [.073,.079] [.082,.087] [.102,.112] [.086,.09 2] [.078,.082] [.101,.0111] [.085,.091] [.078,.0 83] 15 da ys .113 .104 .145 .111 .101 .109 .149 .118 .104 .147 .116 .1 05 [.107,.120] [.101,.108] [.14 2,.148] [.104,.118] [.097,.105] [.106,.113] [.140,.158] [.113,.12 2] [.101,.107] [.139,.156] [.112,.121] [.101,.108] F or a giv en duration, th e p oin t estimate is rep orted on the first ro w and the confidence in terv al is rep orted in brac k ets on the second ro w.
Table A.2: Proportion of catheters, by age/sex category and hospital status
Patient category Private University Other public
Female, 35-60 0.835 0.835 0.433
Female, 60-70 0.768 0.790 0.337
Female, 70-80 0.668 0.677 0.243
Female, 80-85 0.516 0.396 0.119
Female, 85-90 0.286 0.163 0.041
Female, more than 90 0.123 0.049 0.014
Male, 35-60 0.843 0.853 0.458
Male, 60-70 0.787 0.808 0.377
Male, 70-80 0.715 0.716 0.275
Male, 80-85 0.555 0.487 0.149
Male, 85-90 0.342 0.226 0.062