H I V / A I D S
M A J O R A R T I C L E
The Incidence of AIDS-De
fining Illnesses at a
Current CD4 Count
≥200 Cells/µL in the Post–
Combination Antiretroviral Therapy Era
A. Mocroft,1H. J. Furrer,2J. M. Miro,3P. Reiss,4,5C. Mussini,6O. Kirk,7,8S. Abgrall,9,10,11S. Ayayi,12B. Bartmeyer,13 D. Braun,14A. Castagna,15A. d’Arminio Monforte,16B. Gazzard,17F. Gutierrez,18I. Hurtado,19K. Jansen,20L. Meyer,21,22 P. Muñoz,23N. Obel,8P. Soler-Palacin,24A. Papadopoulos,25F. Raffi,26J. T. Ramos,27J. K. Rockstroh,28D. Salmon,29 C. Torti,30,31J. Warszawski,32S. de Wit,33R. Zangerle,34C. Fabre-Colin,35,36J. Kjaer,7G. Chene,35,36J. Grarup,7and J. D. Lundgren7,8; for the Opportunistic Infections Working Group on behalf of the Collaboration of Observational HIV Epidemiological Research Europe (COHERE) study in EuroCOORDa
1Department of Infection and Population Health, University College London, United Kingdom;2Department of Infectious Diseases, Bern University
Hospital and University of Bern, Switzerland;3Hospital Clinic–IDIBAPS, University of Barcelona, Spain;4Academisch Medisch Centrum bij de Universiteit
van Amsterdam;5Stichting HIV Monitoring, Amsterdam, The Netherlands;6Università Modena, Italy;7Copenhagen HIV Programme, and8Department of
Infectious Diseases, Copenhagen University Hospital/Rigshospitalet, Denmark;9UPMC, Université Paris 06, and10INSERM, UMR_S 943, and11AP-HP,
Hôpital Avicenne, Services des Maladies Infectieuses et Tropicales, Paris, and12CHU de Bordeaux and INSERM U897, Bordeaux, France;13Department
of Infectious Disease, Robert Koch-Institute, Berlin, Germany;14Division of Infectious Diseases and Hospital Epidemiology, University Hospital Zurich,
University of Zurich, Switzerland;15Department of Infectious Diseases IRCCS San Raffaele, and16Department of Health Sciences, Institute of Infectious
Diseases, Milan, Italy;17St Stephen’s Clinic, Chelsea and Westminster Hospital, London, United Kingdom;18Infectious Diseases Unit, Hospital General
Universitario de Elche, Universidad Miguel Hernández, Alicante, and19Centro Superior de Investigación en Salud Pública (CSISP-FISABIO), Red de
Investigacion en Servicios de Salud en Enfermedades Cronicas (REDISSEC), Valencia, Spain;20Competence Network for HIV/AIDS, St Josef-Clinic,
Ruhr-University, Bochum, Germany;21CESP Centre for Research in Epidemiology and Population Health, INSERM U1018, Paris, and22Epidemiology and Public
Health Service, AP-HP, Hopital Bicêtre, Le Kremlin Bicêtre, France;23Departament of Infectious Diseases, Hospital Universitario de Basurto, Bilbao, and 24Hospital Universitari Vall d’Hebron, Universitat Autònoma de Barcelona, Spain;25University of Athens Medical School, University General Hospital
“ATTIKON,” Greece;26University Hospital, Hotel Dieu, Nantes, France;27Hospital Universitario de Getafe, Madrid, Spain;28Medizinische Universitäts
Klinik I, University of Bonn, Germany;29Department of Internal Medicine and Infectious Diseases, Cochin Hospital, Paris, France;30University Division of
Infectious and Tropical Diseases, University and Spedali Civili of Brescia, and31Department of Medical and Surgical Sciences, Unit of Infectious
Diseases, University“Magna Graecia,” Catanzaro, Italy;32AP-HP Public Health Department, INSERM CESP U1018, Université Paris-Sud, Le
Kremlin-Bicêtre, France;33Saint-Pierre Hospital, Brussels, Belgium;34Medical University Innsbruck, Austria;35Centre INSERM U897-Epidémiologie Statistique,
Université de Bordeaux, ISPED, and36INSERM, ISPED, Centre INSERM U897-Epidémiologie Statistique, Bordeaux, France
(See the HIV/AIDS Major Article by Lesko et al on pages 1027–37 and the Editorial Commentary by Lange on pages 1048–50.)
Background. Few studies consider the incidence of individual AIDS-defining illnesses (ADIs) at higher CD4
counts, relevant on a population level for monitoring and resource allocation.
Methods. Individuals from the Collaboration of Observational HIV Epidemiological Research Europe (COHERE)
aged≥14 years with ≥1 CD4 count of ≥200 µL between 1998 and 2010 were included. Incidence rates (per 1000 person-years of follow-up [PYFU]) were calculated for each ADI within different CD4 strata; Poisson regression, using general-ized estimating equations and robust standard errors, was used to model rates of ADIs with current CD4≥500/µL.
Results. A total of 12 135 ADIs occurred at a CD4 count of ≥200 cells/µL among 207 539 persons with
1 154 803 PYFU. Incidence rates declined from 20.5 per 1000 PYFU (95% confidence interval [CI], 20.0–21.1 per
1000 PYFU) with current CD4 200–349 cells/µL to 4.1 per 1000 PYFU (95% CI, 3.6–4.6 per 1000 PYFU) with
current CD4≥ 1000 cells/µL. Persons with a current CD4 of 500–749 cells/µL had a significantly higher rate of
ADIs (adjusted incidence rate ratio [aIRR], 1.20; 95% CI, 1.10–1.32), whereas those with a current CD4 of ≥1000
Received 11 March 2013; accepted 1 May 2013; electronically published 6 August 2013.
a
Members of the study group are listed in the Appendix.
Correspondence: Amanda Mocroft, PhD, Department of Infection and Population Health, University College London, Rowland Hill St, London NW3 2PF, UK (a. [email protected]).
Clinical Infectious Diseases 2013;57(7):1038–47
© The Author 2013. Published by Oxford University Press on behalf of the Infectious Diseases Society of America. All rights reserved. For Permissions, please e-mail: [email protected].
cells/µL had a similar rate (aIRR, 0.92; 95% CI, .79–1.07), compared to a current CD4 of 750–999 cells/µL. Results were consistent in persons with high or low viral load. Findings were stronger for malignant ADIs (aIRR, 1.52; 95% CI, 1.25–1.86) than for nonma-lignant ADIs (aIRR, 1.12; 95% CI, 1.01–1.25), comparing persons with a current CD4 of 500–749 cells/µL to 750–999 cells/µL.
Discussion. The incidence of ADIs was higher in individuals with a current CD4 count of 500–749 cells/µL compared to those
with a CD4 count of 750–999 cells/µL, but did not decrease further at higher CD4 counts. Results were similar in patients virologi-cally suppressed on combination antiretroviral therapy, suggesting that immune reconstitution is not complete until the CD4 increases to >750 cells/µL.
Keywords. CD4; virologic suppression; cART; AIDS defining illnesses; immune reconstitution.
The decline in AIDS-defining illnesses (ADIs) and deaths fol-lowing the introduction of combination antiretroviral therapy (cART) in 1996–1997 has been well documented [1–3]. Studies have also described the decline in individual ADIs, such as non-Hodgkin lymphoma, Pneumocystis jirovecii pneumonia, Mycobacterium avium complex, Kaposi sarcoma, tuberculosis, and cytomegalovirus infections [1,4–7]. Prior to the introduc-tion of cART, and in antiretroviral-naive patients, the incidence of ADIs according to current CD4 count has been described [8,9] There is preliminary evidence that the risk of ADIs continues to decrease as CD4 count increases, even at CD4 counts >500 cells/µL [9,10], but, to our knowledge, there are few studies that have specifically considered the incidence of individual ADIs at higher CD4 counts [10,11]. Previous work from the Collabora-tion of ObservaCollabora-tional HIV Epidemiological Research Europe (COHERE) has shown that the risk of a new ADI or death con-tinued to decrease in patients with virological suppression where the current CD4 count was >500 cells/µL, but the study did not report the incidence of individual ADIs or investigate whether there was an additional decrease at higher CD4 counts [12]. Approximately 80% of persons on cART are virologically sup-pressed [13], but it is also relevant to determine the incidence of ADIs overall and for specific diagnoses on a population level, both for monitoring and for resource allocation. Knowledge of the risk of a specific ADI at a given CD4 lymphocyte count and the identification of a possible threshold of immunodeficiency have important implications for patient management, as well as providing an important reference for the incidence of a wide range of ADIs at higher CD4 counts.
The aims of this study were to describe the incidence of
spe-cific ADIs at CD4 counts of ≥200 cells/µL, according to the
latest CD4 count across a wide range of CD4 counts using data from COHERE, a European collaboration of HIV cohort studies. Our second objective was to determine the factors associated with developing a new ADI at a CD4 count of≥500 cells/µL.
METHODS
Patients
COHERE is a collaboration of 33 cohorts from across Europe. COHERE was established in 2005 and merges data from
already established cohorts to conduct epidemiological research on the prognosis of HIV-positive persons where the individual contributing cohorts are not adequately powered. Local ethical committee and/or other regulatory approval were obtained as applicable according to local and/or national regulations in all cohorts unless no such requirement applied to observational studies according to national regulations. Each cohort submits information using the standardized HIV Collaboration Data Exchange Protocol (HICDEP; [14]) to coordinating centers at the Copenhagen HIV Programme (CHIP), Copenhagen, Denmark, or the Institut de Santé Publique d’Épidémiologie et de Développement (ISPED), Bordeaux, France. Data collected and analyzed herein were part of the 2011 merger, and included data from the period 1998–2010. Data collected include infor-mation on patient demographics, use of cART, CD4 cell counts, ADIs, and deaths. ADIs were diagnosed using the 1993 classification from the Centers for Disease Control and Preven-tion [15]. COHERE is part of EuroCOORD, a network of excel-lence established in 2010 (http://www.eurocoord.net/). Further
details about COHERE can be found at www.cphiv.dk and
http://etudes.isped.u-bordeaux2.fr/cohere/. All individuals in
COHERE aged≥14 years with at least 1 CD4 count of ≥200
cells/ µL measured after 1 January 1998 with some prospective follow-up were included in the analyses, regardless of their current antiretroviral treatment or treatment history.
Statistical Methods
Baseline was defined as the first recorded CD4 count ≥200
cells/µL measured after 1 January 1998 (corresponding to the widespread availability of cART); person-years of follow-up (PYFU) were allocated to CD4 count strata (200–349, 350–499,
500–749, 750–999, and ≥1000 cells/µL) and the individual
ADIs allocated to the stratum they occurred in. Follow-up was censored when the CD4 count fell below 200 cells/µL (and was subsequently reentered into the analysis if the CD4 count rose to≥200 cells/µL) or at last CD4 count. Incidence rates were cal-culated for each individual ADI occurring in >50 individuals,
and other diagnoses were combined to create an“other”
cate-gory. Recurrences of the same ADI were excluded but persons could contribute >1 event to the analysis and moved through CD4 count categories according to their current CD4 count.
Poisson regression, using generalized estimating equations and robust standard errors, were used to model rates of a new ADI in persons with a current CD4≥500 cells/µL. Baseline for
this analysis was the first CD4 count ≥500 cells/µL measured
after January 1998. Standard adjustments for other factors in-cluded age, sex, HIV transmission group, ethnic origin, HIV RNA load, duration of immune suppression ( proportion of
follow-up time with CD4 count≤200 cells/µL, including prior
to baseline for this analysis) or of controlled viremia (viral load [VL] <400 copies/mL including time prior to baseline), and starting cART. Within each CD4 count stratum, the current CD4 count was included as a continuous variable to see if there was a trend of an increasing rate of new ADIs at lower CD4 counts within CD4 stratum.
We performed a number of sensitivity analyses to investigate if our results were robust in different populations. We excluded thefirst 6 months of follow-up to see if patients presenting with
ADIs were biasing our findings, and also limited analyses to
those with a definitive diagnosis, defined by cohorts according to the 1993 guidelines [15] and follow-up where the current CD4 count had been measured within the previous 6 months. We also repeated the analysis in antiretroviral-naive persons by right-censoring at starting cART, in those with VL <400 copies/ mL or >400 copies/mL, and in follow-up limited to the first 6 months after initiation of cART. We also considered new malignant ADIs (cervical cancer, Kaposi sarcoma, non-Hodgkin lymphoma) and nonmalignant disease (all other ADIs) sepa-rately, as well as pulmonary and extrapulmonary tuberculosis. A subset of individuals had information available on CD8 count and CD4 and CD8 percentages; additional models investigated whether adjusting for these immunological markers, or ratios of these, further explained ourfindings.
All analyses were performed using SAS software version 9.2 (SAS Institute Inc, Cary, North Carolina).
RESULTS
Of 250 553 individuals included in participating cohorts in COHERE, 24 481 were excluded because they had no CD4 counts recorded of≥200 cells/µL; a further 218 were excluded because sex or information on date of birth was missing; 1930 were excluded because they were aged <14 years; and 16 385 were excluded because they had no prospective follow-up, leaving 207 539 persons included in the analysis. Characteris-tics at baseline are shown in Table1; 149 730 persons were
in-cluded in the analysis focused on those with CD4 counts≥500
cells/µL. The most common HIV transmission group was men who have sex with men (MSM). The median CD4 at baseline was 378 cells/µL (interquartile range [IQR], 264–548 cells/µL), and 39 968 (19.3%) had a prior AIDS diagnosis.
A total of 12 135 of the ADIs observed occurred at a CD4
count of≥200 cells/µL. The most common ADI was esophageal
candidiasis (n = 1629 [13.4%]), followed by Kaposi sarcoma (n = 1323 [10.9%]) and pulmonary tuberculosis (n = 1263 [10.4%]). The median CD4 count at diagnosis ranged from 314 cells/µL (IQR, 252–450 cells/µL) in persons diagnosed with dis-seminated Mycobacterium avium complex to 416 cells/µL
(IQR, 310–574 cells/µL) in persons diagnosed with recurrent
herpes infections. Incidence rates of new ADIs declined from
20.5 per 1000 PYFU (95% confidence interval [CI], 20.0–21.1
per 1000 PYFU) in those with a current CD4 count of 200–349
cells/µL to 4.1 per 1000 PYFU (95% CI, 3.6–4.6 per 1000
PYFU) where current CD4 count was ≥1000 cells/µL. The
number of events, PYFU, and event rates within each CD4 count
stratum are shown for each ADI in Table2, ordered from the
highest overall incidence to the lowest. Four ADIs—esophageal candidiasis (1.4 [95% CI, 1.3–1.5]), Kaposi sarcoma (1.2 [95% CI, 1.1–1.2]), pulmonary tuberculosis (1.1 [95% CI, 1.0–1.2]), and extrapulmonary tuberculosis (1.1 [95% CI, 1.0–1.1])—had overall incidence rates >1 per 1000 PYFU.
Factors associated with the development of a new ADI at a current CD4 count of≥500 cells/µL are shown in Table3. Male and female intravenous drug users had an increased rate of de-veloping a new ADI, whereas male and female heterosexuals had a lower rate. Persons with a current VL >10 000 copies/mL had a higher rate, as did older individuals and those with a higher pro-portion of follow-up time with a CD4 count <200 cells/µL. A higher proportion of follow-up time with VL <400 copies/mL was associated with a lower rate of new ADIs. Compared to
persons with a CD4 count of 750–999 cells/µL, those with a
current CD4 count of 500–749 cells/µL had a significantly
higher rate of new ADIs (adjusted incidence rate ratio [aIRR], 1.20 [95% CI, 1.10–1.32], P < .0001), whereas those with a CD4 count of≥1000 cells/µL had a similar rate (aIRR, 0.92 [95% CI, .79–1.07], P = .26). Among persons with a current CD4 of 500– 749 cells/µL, a 50-cells/µL-lower CD4 count was associated with a 6% increased rate of a new ADI (aIRR, 1.06 [95% CI, 1.02– 1.10], P < .0001), whereas in those with a CD4 count of 750–999 cells/µL, there was no evidence that a lower CD4 count within this stratum was associated with an increased rate (aIRR, 1.01 [95% CI, .96–1.07], P = .72), or in those with a current CD4 of ≥1000 cells/µL (aIRR, 1.00 [95% CI, .98–1.03], P = .86).
We performed several sensitivity analyses; those considering viral suppression or antiretroviral treatment are shown in Figure 1. Results were consistent in antiretroviral-naive pa-tients. There was no evidence that the relationship between current CD4 and ADIs differed according to level of viral sup-pression (P = .49, test for interaction). Compared to patients with a current CD4 count of 750–999 cells/µL, those with a CD4 count of 500–749 cells/µL had significantly higher rates of new ADIs after adjustment in those with a low (<400 copies/mL)
or high viral load (>400 copies/mL; Figure 1). During the first 6 months of cART, slightly different results were found
(Figure 1). After adjustment, compared to patients with a
current CD4 of 750–999 cells/µL, there was no increased rate of
a new ADI in those with either lower (500–749 cells/µL) or
higher current CD4 counts (>1000 cells/µL). Additional
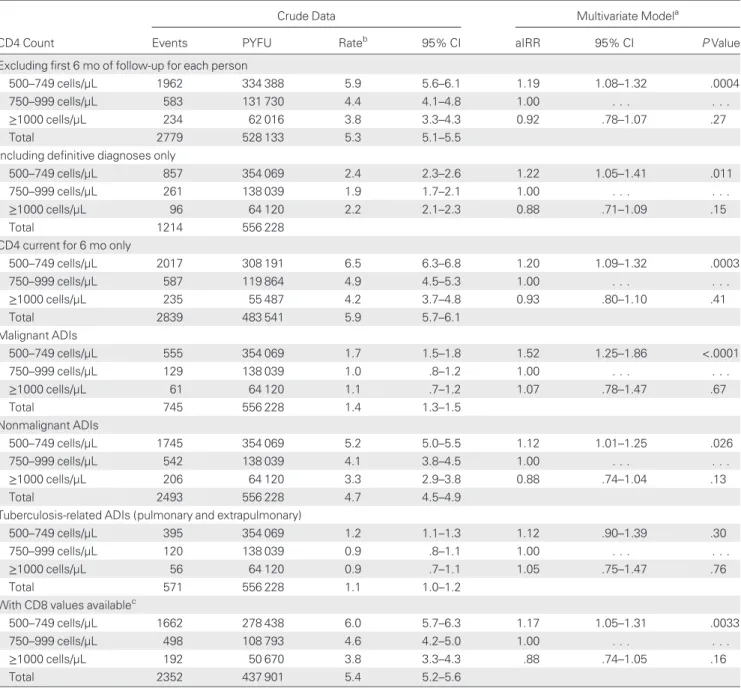
sensi-tivity analyses are shown in Table 4. We removed thefirst 6
months of follow-up for each individual due to concerns that a significant number of new ADIs might be diagnosed at, or soon after, initial presentation, and found a 19% increased incidence
of a new ADI in those with a current CD4 count of 500–749
cells/µL compared to those with a current CD4 count of 750– 999 cells/µL (aIRR, 1.19 [95% CI, 1.08–1.32]). In an analysis limited to those with only definitive diagnoses, there was a 22%
increased rate in those with a current CD4 count of 500–749
cells/µL (aIRR, 1.22 [95% CI, 1.05–1.41]). This increased rate was somewhat higher for malignant ADIs (aIRR, 1.52 [95% CI, 1.25–1.86]) than for nonmalignant ADIs (aIRR, 1.12 [95% CI, 1.01–1.25]). Adjusting additionally for CD8, missing for
ap-proximately 20% of persons, did not alter our findings
(Table4), but CD8 was a predictor of a new ADI; a CD8 count >1000 cells/µL was associated with a higher rate of new ADIs (aIRR, 1.16 [95% CI, 1.06–1.27], P = .0009).
DISCUSSION
This analysis included >200 000 HIV-infected individuals with 1 154 803 PYFU while at a current CD4 count of≥200 cells/µL,
Table 1. Characteristics of Included Persons at Baseline; Collaboration of Observational HIV Epidemiological Research Europe (COHERE), 1998–2010a
CD4 Count≥200 Cells/µL CD4 Count≥500 Cells/µL
Characteristic No. % No. %
All 207 539 100 149 730 100
HIV transmission group
MSM 83 831 40.4 64 929 43.4 Male IDU 21 973 10.6 14 247 9.5 Female IDU 8526 4.1 6066 4.1 Male heterosexual 31 913 15.4 20 763 13.9 Female heterosexual 41 682 20.1 30 546 20.4 Male other 13 300 6.4 8823 5.9 Female other 6314 3.0 4356 2.9 Country of origin Developed country 86 445 41.7 65 037 43.4 Africa 20 425 9.8 13 018 8.7 Other 9498 4.6 6445 4.3 Unknown 91 171 43.9 65 230 43.6 Ethnic origin White 68 127 32.8 51 939 34.7 Other 18 250 8.8 12 036 8.0 Unknown 121 162 58.4 85 755 57.3
Prior AIDS at baseline 39 968 19.3 26 931 18.0
VL <400 copies/mLbat baseline 66 370 33.1 76 989 52.9
On cART at baseline 92 103 44.4 86 198 57.5
ART naive at baseline 94 339 45.5 50 055 33.4
Measurements at Baseline Median IQR Median IQR
CD4 378 265–548 580 530–680
VLb 3.30 2.55
–4.44 2.60 1.70–3.74
Baseline date (month/year) 12/2001 7/1998–11/2005 12/2002 7/1999–7/2006
Age 37 31–43 37 32–44
Abbreviations: ART, antiretroviral therapy; cART, combination ART; HIV, human immunodeficiency virus; IDU, intravenous drug user; IQR, interquartile range; MSM, men who have sex with men; VL, viral load.
a
Baseline defined as first CD4≥200 cells/µL (or ≥500 cells/µL) after 1 January 1998.
b
Viral load data available for 200 827 (96.7%) of those with baseline CD4 count≥200 cells/ul and 145 529 (97.2%) of those with baseline CD4 count ≥500 cells/uL at baseline, respectively.
including almost 150 000 persons and >550 000 PYFU with a
current CD4 count of ≥500 cells/µL, and described the
inci-dence of the 18 most commonly occurring ADIs in European HIV Cohort studies, across a range of current CD4 stratum, up to and including CD4 counts >1000/µL. Compared to patients
with a current CD4 count of 750–999 cells/µL, those with a
CD4 count of 500–749 cells/µL had a significantly higher rate of new ADIs, whereas those with current CD4 counts of >1000 cells/µL had a similar incidence. Within CD4 count strata 750–999 cells/µL and ≥1000 cells µL, there was no evidence of a decreasing incidence of new ADIs within the strata. Highly consistent results were found across a wide range of sensitivity analyses.
The overall rate of new ADIs was low at current CD4 counts ≥500 cells/µL, <6 per 1000 PYFU, compared to a rate of >1000 per 1000 PYFU at current CD4 counts <50 cells/µL [9]. We found an increased rate of new ADIs at a current CD4 count of 500–749 cells/µL compared to 750–999 cells/µL or higher
but no evidence of any association between CD4 count and in-cidence of new ADIs within the 750–999 cells/µL or ≥1000 cells/µL category, with quite narrow confidence intervals,
sug-gesting that HIV-infected patients with a CD4 count ≥750
cells/µL have no further reduction in risk of new ADIs with higher CD4 counts. We adjusted for other markers of immuno-logical function, such as CD8, CD4 percentage, and CD8 per-centage, in the subset of individuals with data, with consistent results (data not shown). There are a number of studies that
have shown that having a current CD4 count≥500 cells/µL is
beneficial in terms of a combined endpoint of a new ADI and
death [9,10,12, 16], although these studies have been more
limited by power and have not split CD4 count stratum≥500
cells/µL as in this current analysis.
Our results were consistent across a range of sensitivity anal-yses, and were similar between antiretroviral-naive persons and those who were or were not virologically suppressed, although we were unable to say whether the ADIs experienced were
Table 2. Crude Incidence Rates (Per 1000 Person-years of Follow-up) of AIDS-Defining Illnesses in CD4-Specific Strata Stratum (Cells/µL)
ADI All 200–349 350–499 500–749 750–999 ≥1000
PYFU 1 154 803 274 441 324 134 354 069 138 039 64 120
Events 12 135 5632 3319 2271 648 265
Rate (95% CI) 10.5 (10.3–10.7) 20.5 (20.0–21.1) 10.2 (9.9–10.6) 6.4 (6.2–6.7) 4.7 (4.3–5.1) 4.1 (3.6–4.6) AIDS defining illness
Esophageal candidiasis 1629/1.4/1.3–1.5 823/3.0/2.8–3.2 418/1.3/1.2–1.4 263/0.7/.7–.8 96/0.7/.6–.8 29/0.5/.3–.6 Kaposi’s sarcoma 1323/1.2/1.1–1.2 560/2.0/1.9–2.2 423/1.3/1.2–1.4 261/0.7/.7–.8 57/0.4/.3–.5 22/0.3/.2–.5 Pulmonary tuberculosis 1263/1.1/1.0–1.1 576/2.1/1.9–2.3 351/1.1/1.0–1.2 230/0.7/.6–.7 68/0.5/.4–.6 38/0.6/.4–.8 Non-Hodgkins lymphoma 1236/1.1/1.0–1.1 574/2.1/1.9–2.3 345/1.1/1.0–1.2 235/0.7/.6–.8 51/0.4/.3–.5 31/0.5/.3–.7 Extrapulmonary tuberculosis 997/0.9/.8–.9 491/1.8/1.6–2.0 282/0.9/.8–1.0 158/0.5/.4–.5 48/0.4/.3–.5 18/0.3/.2–.4 Bacterial pneumonia 898/0.8/.7–.8 384/1.4/1.3–1.5 264/0.8/.7–.9 174/0.5/.4–.6 58/0.4/.3–.5 18/0.3/.2–.4 Pneumocystis jirovecii pneumonia 840/0.7/.7–.8 507/1.9/1.7–2.0 196/0.6/.5–.7 112/0.3/.3–.4 18/0.1/.1–.2 7/0.1/.0–.2 Recurrent herpes simplex 778/0.7/.6–.7 274/1.0/.9–1.1 222/0.7/.6–.8 212/0.6/.5–.7 58/0.4/.3–.5 12/0.2/.1–.3 HIV dementia 750/0.7/.6–.7 314/1.1/1.0–1.3 196/0.6/.5–.7 166/0.5/.4–.5 56/0.4/.3–.5 18/0.3/.2–.4 Cervical cancera 190/0.6/.5–.7 71/0.9/.7–1.2 53/0.6/.4–.8 44/0.5/.3–.6 14/0.4/.2–.6 8/0.5/.2–.9 Other ADIs occurring in
<50 persons
495/0.4/.4–.5 196/0.7/.6–.8 135/0.4/.4–.5 115/0.3/.3–.4 35/0.3/.2–.3 14/0.2/.1–.4 HIV wasting syndrome 374/0.3/.3–.4 183/0.7/.6–.8 102/0.3/.3–.4 62/0.2/.1–.2 18/0.1/.1–.2 9/0.1/.1–.3 Progressive multifocal leukoencephalopathy 307/0.3/.2–.3 167/0.6/.5–.7 78/0.2/.2–.3 50/0.1/.1–.2 8/0.1/.0–.1 4/0.1/.0–.2 Toxoplasmosis of brain 299/0.3/.2–.3 169/0.6/.5–.7 74/0.2/.2–.3 44/0.1/.1–.2 9/0.1/.0–.1 3/0.1/.0–.1 Cytomegalovirus (nonretinitis) 273/0.2/.2–.3 113/0.4/.3–.5 53/0.2/.1–.2 56/0.2/.1–.2 30/0.2/.1–.3 21/0.3/.2–.5 Cryptosporidiosis 174/0.2/.1–.2 66/0.2/.2–.3 54/0.2/.1–.2 37/0.1/.1–.1 8/0.1/.0–.1 9/0.1/.1–.3 Mycobacterium avium complex 127/0.1/.1–.1 78/0.3/.2–.4 24/0.1/.0–.1 15/0.0/.0–.1 8/0.1/.0–.1 2/0.0/.0–.1 Cytomegalovirus retinitis 95/0.1/.1–.1 45/0.2/.1–.2 27/0.1/.1–.1 16/0.1/.0–.1 6/0.0/.0–.1 1/0.0/.0–.1 Cryptococcosis 87/0.1/.1–.1 41/0.2/.1–.2 22/0.1/.0–.1 21/0.1/.0–.1 2/0.0/.0–.1 1/0.0/.0–.1
Data are presented as events/rate/95% CI for the rate.
Abbreviations: ADI, AIDS-defining illness; CI, confidence interval; HIV, human immunodeficiency virus; PYFU, person-years of follow-up.
a
PYFU totaled 313 010 in females; 75 173, 88 209, 94 734, 37 084, and 17 811 in the CD4 count strata 200–349, 350–499, 500–749, 750–999, and ≥1000 cells/µL, respectively.
similar between those on and off cART or with and without vi-rologic suppression. The relationship between current CD4 and ADIs differed slightly during thefirst 6 months of cART, with no increased rate seen in those with a current CD4 count of
500–749 cells/µL compared to 750–999 cells/µL. The reasons
for this are unclear, but could reflect the increased rate of ADIs
in relation to high viremia irrespective of CD4 count during the initial period after starting cART, compared to patients who have been on cART for longer [6].
Ourfindings were stronger for malignant compared to
non-malignant ADIs. The strength of the association was similar for Kaposi sarcoma and non-Hodgkin lymphoma (data not
Table 3. Factors Associated With a New AIDS-Defining Illness With CD4 Count ≥500 Cells/µL
Univariate Analysis Multivariate Analysis
Factor IRR 95% CI P Value IRR 95% CI P Value
Current CD4, cells/µL
<750 1.33 1.22–1.46 <.0001 1.20 1.10–1.32 <.0001
750–999 1.00 . . . 1.00 . . . .
≥1000 0.85 .74–.98 .029 0.92 .79–1.07 .26
HIV transmission group
MSM 1.00 . . . 1.00 . . . . Male IDU 1.13 .99–1.28 .066 1.24 1.09–1.40 .0009 Female IDU 1.50 1.28–1.77 <.0001 1.61 1.37–1.89 <.0001 Male heterosexual 0.86 .76–.97 .015 0.88 .78–.99 .037 Female heterosexual 0.86 .77–.95 .0043 0.88 .79–.97 .019 Male other 0.87 .72–1.04 .13 0.97 .82–1.14 .71 Female other 1.14 .90–1.43 .28 1.19 .95–1.48 .13 Country of origin Developed 1.00 . . . 1.00 . . . . Africa 1.02 .88–1.19 .76 1.26 1.07–1.47 .0047 Other 0.97 .79–1.19 .76 1.13 .92–1.39 .24 Unknown 1.03 .95–1.12 .49 1.10 1.01–1.19 .026 Ethnic origin White 1.00 . . . 1.00 . . . . Other 1.02 .88–1.15 .83 1.08 .92–1.26 .37 Unknown 0.85 .78–.92 <.0001 0.85 .78–.92 <.0001 Current VL, copies/mL <400 1.00 . . . 1.00 . . . . 400–10 000 1.28 1.16–1.42 <.0001 0.94 .82–1.07 .34 >10 000 2.60 2.36–2.85 <.0001 1.68 1.46–1.92 <.0001 Baseline AIDS Yes vs no 1.32 1.20–1.45 <.0001 1.57 1.42–1.74 <.0001 Baseline
Per year later 1.04 1.03–1.06 <.0001 1.04 1.03–1.05 <.0001
Baseline cART Yes vs no 0.88 .82–.95 .006 1.24 1.13–1.36 <.0001 Age Per 10 y older 1.03 .99–1.08 .13 1.14 1.09–1.18 <.0001 Follow-up CD4≤ 200a Per 10% longer 1.22 1.14–1.31 <.0001 1.17 1.09–1.25 <.0001 Follow-up VL < 400a Per 10% longer 0.91 .90–0.92 <.0001 0.92 .90–.93 <.0001
Abbreviations: cART, combination antiretroviral therapy; CI, confidence interval; HIV, human immunodeficiency virus; IDU, intravenous drug user; IRR, incidence rate ratio; MSM, men who have sex with men; VL, viral load.
a
shown) while the model for cervical cancer did not converge due to insufficient numbers. Kaposi sarcoma is diagnosed across a wide range of CD4 counts independent of CD4 nadir [17]. Most persons in this study had started cART at low CD4
count levels [18], and the onset of non-Hodgkin lymphoma
soon after cART initiation might be indicative of immune re-constitution syndrome [19] or subclinical disease. COHERE is an observational study, and confounding by indication is likely to play a significant role. Our findings should not therefore be extrapolated to the“when to start cART” question. In time, the randomized clinical trial START (Strategic Timing of Initiation of Antiretroviral Therapy), with both AIDS and non-AIDS clinical endpoints, will provide unbiased estimates of whether cART is of net clinical benefit to persons commencing therapy at higher CD4 counts. The clinical benefits of cART at higher CD4 counts, where the reduction in risk is statistically but not necessarily clinically significant, need to be balanced against the long-term potential costs and risks of antiretroviral therapy, such as resistance development and adverse events including cardiovascular and renal disease, and malignancies that may add to other comorbidities associated with aging, immune acti-vation, and HIV-related inflammation [20–22].
Other predictors of a new ADI included HIV transmission group and HIV load, as previously reported [23–25]. Both
pro-portion of follow-up time with advanced immunodeficiency
(CD4 count≤200 cells/µL) and with controlled viremia (<400 copies/mL) were independent predictors of a new ADI. Viremia
copy-years, a different way of measuring exposure to replicating virus, has been shown to predict mortality independent of
current CD4 counts among those on cART [26]. This supports
findings from the SMART trial, which also showed that the proportion of follow-up time with detectable viremia was, as expected, higher in persons who interrupted vs continued cART, and that the group that interrupted cART had an in-creased risk of both ADI as well as various types of organ disease [27]. One explanation is that cumulative exposure to un-controlled HIV replication is a surrogate for cumulative immune
system activation, inflammation, and depletion of lymphoid
organs from central memory and naive CD4+T cells exhausting the immune system [26,28,29]. Duration of immune deficiency as a marker of disease progression has been investigated in
previous studies with varying degrees of immunodeficiency,
endpoints, and results [30–32]. It is likely that circulating CD4 cells are a good but not a perfect marker of the immune capacity in HIV infection, In addition, duration of immunode-ficiency likely captures extra data not measured through the CD4 count due to its variability [33] or differences in frequency of measurement between persons.
This study has a number of limitations. We were not able to adjust for hepatitis B or C status, or prior use of disease-specific prophylaxis, as the data were quite limited. The incidence of new ADIs at higher CD4 counts was extremely low, and our results provide some evidence that there is a small increased risk of a new ADI at CD4 counts of 500–750 cells/µL, but not
Figure 1. Relationship between current CD4 and AIDS-defining illness with a CD4 count ≥500 cells/µL: relationship with current viral load and antiretro-viral treatment. *Adjusted for human immunodeficiency virus transmission category, region of origin, region of presentation, age, baseline date, on combi-nation antiretroviral therapy at baseline, AIDS diagnosis at baseline, CD4 nadir, proportion of follow-up time with CD4 count≤200 cells/µL, and proportion of follow-up time with viral load <400 copies/mL. Overall model also adjusts for current viral load (< or≥400 copies/mL). Abbreviations: aIRR, adjusted in-cidence rate ratio; ARV, antiretroviral; cART, combination antiretroviral therapy; CI, confidence interval; VL, viral load.
above this level. Although COHERE includes many of the Eu-ropean observational cohorts, some regions, such as Eastern Europe, are not well represented [18] and the incidence of spe-cific ADIs in these regions may well differ from that presented here [34]. In addition, cohorts have a range of quality assurance systems, and we did not use case verification for any ADIs.
Even small differences in reporting of ADIs could change the incidence rates in these rare events considerably. COHERE does not have complete information on non-AIDS events, and we were unable to assess the relationship between non-AIDS
events and high CD4 counts, which form a significant
propor-tion of morbidity and mortality in HIV-positive persons [35].
Table 4. Relationship Between Current CD4 and AIDS-Defining Illness With CD4 Count ≥500 Cells/µL—Sensitivity Analyses
Crude Data Multivariate Modela
CD4 Count Events PYFU Rateb 95% CI aIRR 95% CI
P Value Excluding first 6 mo of follow-up for each person
500–749 cells/µL 1962 334 388 5.9 5.6–6.1 1.19 1.08–1.32 .0004
750–999 cells/µL 583 131 730 4.4 4.1–4.8 1.00 . . . .
≥1000 cells/µL 234 62 016 3.8 3.3–4.3 0.92 .78–1.07 .27
Total 2779 528 133 5.3 5.1–5.5
Including definitive diagnoses only
500–749 cells/µL 857 354 069 2.4 2.3–2.6 1.22 1.05–1.41 .011
750–999 cells/µL 261 138 039 1.9 1.7–2.1 1.00 . . . .
≥1000 cells/µL 96 64 120 2.2 2.1–2.3 0.88 .71–1.09 .15
Total 1214 556 228
CD4 current for 6 mo only
500–749 cells/µL 2017 308 191 6.5 6.3–6.8 1.20 1.09–1.32 .0003 750–999 cells/µL 587 119 864 4.9 4.5–5.3 1.00 . . . . ≥1000 cells/µL 235 55 487 4.2 3.7–4.8 0.93 .80–1.10 .41 Total 2839 483 541 5.9 5.7–6.1 Malignant ADIs 500–749 cells/µL 555 354 069 1.7 1.5–1.8 1.52 1.25–1.86 <.0001 750–999 cells/µL 129 138 039 1.0 .8–1.2 1.00 . . . . ≥1000 cells/µL 61 64 120 1.1 .7–1.2 1.07 .78–1.47 .67 Total 745 556 228 1.4 1.3–1.5 Nonmalignant ADIs 500–749 cells/µL 1745 354 069 5.2 5.0–5.5 1.12 1.01–1.25 .026 750–999 cells/µL 542 138 039 4.1 3.8–4.5 1.00 . . . . ≥1000 cells/µL 206 64 120 3.3 2.9–3.8 0.88 .74–1.04 .13 Total 2493 556 228 4.7 4.5–4.9
Tuberculosis-related ADIs (pulmonary and extrapulmonary)
500–749 cells/µL 395 354 069 1.2 1.1–1.3 1.12 .90–1.39 .30
750–999 cells/µL 120 138 039 0.9 .8–1.1 1.00 . . . .
≥1000 cells/µL 56 64 120 0.9 .7–1.1 1.05 .75–1.47 .76
Total 571 556 228 1.1 1.0–1.2
With CD8 values availablec
500–749 cells/µL 1662 278 438 6.0 5.7–6.3 1.17 1.05–1.31 .0033
750–999 cells/µL 498 108 793 4.6 4.2–5.0 1.00 . . . .
≥1000 cells/µL 192 50 670 3.8 3.3–4.3 .88 .74–1.05 .16
Total 2352 437 901 5.4 5.2–5.6
Abbreviations: ADI, AIDS-defining illness; aIRR, adjusted incidence rate ratio; CI, confidence interval; PYFU, person-years of follow-up.
a
Adjusted for HIV transmission category, region of origin, region of presentation, current viral load, age, baseline date, on combination antiretroviral therapy at baseline, AIDS diagnosis at baseline, CD4 nadir, proportion of follow-up time with CD4 ≤200 cells/µL, and proportion of follow-up time with viral load <400 copies/mL.
b
Rate per 1000 PYFU.
c
In conclusion, the incidence of specific ADIs varied widely
among persons with current CD4 counts 200–499 cells/µL and
was generally low among all persons at higher CD4 counts.
Despite this low rate of new ADIs at current CD4 counts≥500
cells/µL, the rate was increased by 20% when compared to those with a current CD4 of 750–999 cells/µL, whereas there were no further significant reductions in ADIs at higher CD4 counts. Results were similar in those with viral suppression and stronger for malignant than nonmalignant events, suggesting that immune-mediated mechanisms other than those induced by HIV replica-tion alone are responsible for this increased rate. Persons with HIV infection are not fully immune reconstituted until the CD4 count increases to >750 cells/µL.
Notes
Financial support. The Collaboration of Observational HIV Epidemio-logical Research Europe (COHERE) study group is supported by the Agence Nationale de Recherches sur le SIDA et les Hépatites Virales (ANRS), France; HIV Monitoring Foundation, The Netherlands; and the Augustinus Foundation, Denmark. COHERE receives funding from the Eu-ropean Union Seventh Framework Programme (FP7/2007–2013) under EuroCoord grant agreement number 260694. A list of the funders of the participating cohorts can be found on the regional coordinating center web-sites at http://www.cphiv.dk/COHERE/tabid/295/Default.aspx and http:// etudes.isped.u-bordeaux2.fr/cohere.
Potential conflicts of interest. All authors: No reported conflicts. All authors have submitted the ICMJE Form for Disclosure of Potential Conflicts of Interest. Conflicts that the editors consider relevant to the content of the manuscript have been disclosed.
References
1. Mocroft A, Katlama C, Johnson AM, et al. AIDS across Europe, 1994–98: the EuroSIDA study. Lancet 2000; 356:291–6.
2. Palella FJ Jr., Delaney KM, Moorman AC, et al. Declining morbidity and mortality among patients with advanced human immunodeficien-cy virus infection. HIV Outpatient Study Investigators. N Engl J Med 1998; 338:853–60.
3. Egger M, Hirschel B, Francioli P, et al. Impact of new antiretroviral com-bination therapies in HIV infected patients in Switzerland: prospective multicentre study. Swiss HIV Cohort Study. BMJ 1997; 315:1194–9. 4. Grabar S, Lanoy E, Allavena C, et al. Causes of thefirst AIDS-defining
illness and subsequent survival before and after the advent of combined antiretroviral therapy. HIV Med 2008; 9:246–56.
5. Kirk O, Gatell JM, Mocroft A, et al. Infections with Mycobacterium tu-berculosis and Mycobacterium avium among HIV-infected patients after the introduction of highly active antiretroviral therapy. EuroSIDA Study Group JD. Am J Respir Crit Care Med 2000; 162(3 Pt 1):865–72. 6. Ledergerber B, Egger M, Erard V, et al. AIDS-related opportunistic
ill-nesses occurring after initiation of potent antiretroviral therapy: the Swiss HIV Cohort Study. JAMA 1999; 282:2220–6.
7. Polesel J, Clifford GM, Rickenbach M, et al. Non-Hodgkin lymphoma incidence in the Swiss HIV Cohort Study before and after highly active antiretroviral therapy. AIDS 2008; 22:301–6.
8. Mocroft A, Youle M, Phillips AN, et al. The incidence of AIDS-defining illnesses in 4883 patients with human immunodeficiency virus infec-tion. Royal Free/Chelsea and Westminster Hospitals Collaborative Group. Arch Intern Med 1998; 158:491–7.
9. Phillips AN, Gazzard B, Gilson R, et al. Rate of AIDS diseases or death in HIV-infected antiretroviral therapy-naive individuals with high CD4 cell count. AIDS 2007; 21:1717–21.
10. Anglaret X, Minga A, Gabillard D, et al. AIDS and non-AIDS morbidi-ty and mortalimorbidi-ty across the spectrum of CD4 cell counts in HIV-infect-ed adults before starting antiretroviral therapy in Cote d’Ivoire. Clin Infect Dis 2012; 54:714–23.
11. Podlekareva D, Mocroft A, Dragsted UB, et al. Factors associated with the development of opportunistic infections in HIV-1-infected adults with high CD4+ cell counts: a EuroSIDA study. J Infect Dis 2006; 194:633–41.
12. Opportunistic Infections Project Team of the Collaboration of Observa-tional HIV Epidemiological Research in Europe (COHERE) in Euro-Coord. CD4 cell count and the risk of AIDS or death in HIV-infected adults on combination antiretroviral therapy with a suppressed viral load: a longitudinal cohort study from COHERE. PLoS Med 2012; 9: e1001194.
13. Lampe FC, Gatell JM, Staszewski S, et al. Changes over time in risk of initial virological failure of combination antiretroviral therapy: a multi-cohort analysis, 1996 to 2002. Arch Intern Med 2006; 166:521–8. 14. Kjaer J, Ledergerber B. HIV cohort collaborations: proposal for
harmo-nization of data exchange. Antivir Ther 2004; 9:631–3.
15. 1993 revised classification system for HIV infection and expanded sur-veillance case definition for AIDS among adolescents and adults. MMWR Recomm Rep 1992; 41(RR-17):1–19.
16. Maman D, Pujades-Rodriguez M, Nicholas S, et al. Response to antire-troviral therapy: improved survival associated with CD4 above 500 cells/µL. AIDS 2012; 26:1393–8.
17. Lodi S, Guiguet M, Costagliola D, Fisher M, de Luca A, Porter K. Kaposi sarcoma incidence and survival among HIV-infected homosex-ual men after HIV seroconversion. J Natl Cancer Inst 2010; 102: 784–92.
18. Lundgren J. Characteristics of individuals presenting late for care across Europe: results from the Collaboration of Observational HIV Epidemi-ological Research Europe (COHERE). 19th International AIDS Confer-ence, 22–27 July 2012. Washington DC, USA. Abstract no.THAB0303. 19. Huhn GD, Badri S, Vibhakar S, et al. Early development of
non-Hodgkin lymphoma following initiation of newer class antiretroviral therapy among HIV-infected patients—implications for immune re-constitution. AIDS Res Ther 2010; 7:44.
20. Deeks SG, Phillips AN. HIV infection, antiretroviral treatment, ageing, and non-AIDS related morbidity. BMJ 2009; 338:a3172.
21. High KP, Brennan-Ing M, Clifford DB, et al. HIV and aging: state of knowledge and areas of critical need for research. A report to the NIH Office of AIDS Research by the HIV and Aging Working Group. J Acquir Immune Defic Syndr 2012; 60(suppl 1):S1–18.
22. Justice AC, Braithwaite RS. Lessons learned from thefirst wave of aging with HIV. AIDS 2012; 26(suppl 1):S11–S18.
23. Reekie J, Gatell JM, Yust I, et al. Fatal and nonfatal AIDS and non-AIDS events in HIV-1-positive individuals with high CD4 cell counts according to viral load strata. AIDS 2011; 25:2259–68.
24. May M, Sterne JA, Sabin C, et al. Prognosis of HIV-1-infected patients up to 5 years after initiation of HAART: collaborative analysis of pro-spective studies. AIDS 2007; 21:1185–97.
25. Mellors JW, Munoz A, Giorgi JV, et al. Plasma viral load and CD4+ lymphocytes as prognostic markers of HIV-1 infection. Ann Intern Med 1997; 126:946–54.
26. Mugavero MJ, Napravnik S, Cole SR, et al. Viremia copy-years predicts mortality among treatment-naive HIV-infected patients initiating anti-retroviral therapy. Clin Infect Dis 2011; 53:927–35.
27. El-Sadr WM, Lundgren JD, Neaton JD, et al. CD4+ count-guided interruption of antiretroviral treatment. N Engl J Med 2006; 355: 2283–96.
28. Kuller LH, Tracy R, Belloso W, et al. Inflammatory and coagulation biomarkers and mortality in patients with HIV infection. PLoS Med 2008; 5:e203.
29. Grossman Z, Meier-Schellersheim M, Paul WE, Picker LJ. Pathogenesis of HIV infection: what the virus spares is as important as what it de-stroys. Nat Med 2006; 12:289–95.
30. Guiguet M, Boue F, Cadranel J, Lang JM, Rosenthal E, Costagliola D. Effect of immunodeficiency, HIV viral load, and antiretroviral therapy on the risk of individual malignancies (FHDH-ANRS CO4): a prospec-tive cohort study. Lancet Oncol 2009; 10:1152–9.
31. Mocroft A, Reiss P, Gasiorowski J, et al. Serious fatal and nonfatal non-AIDS-defining illnesses in Europe. J Acquir Immune Defic Syndr 2010; 55:262–70.
32. Kesselring A, Gras L, Smit C, et al. Immunodeficiency as a risk factor for non-AIDS-defining malignancies in HIV-1-infected patients receiving combination antiretroviral therapy. Clin Infect Dis 2011; 52:1458–65. 33. Maini MK, Gilson RJ, Chavda N, et al. Reference ranges and sources of
variability of CD4 counts in HIV-seronegative women and men. Geni-tourin Med 1996; 72:27–31.
34. Podlekareva D, Bannister W, Mocroft A, et al. The EuroSIDA study: re-gional differences in the HIV-1 epidemic and treatment response to an-tiretroviral therapy among HIV-infected patients across Europe—a review of published results. Cent Eur J Public Health 2008; 16:99–105. 35. Reekie J, Kowalska JD, Karpov I, et al. Regional differences in AIDS
and non-AIDS related mortality in HIV-positive individuals across Europe and Argentina: the EuroSIDA study. PLoS One 2012; 7:e41673.
Appendix
The Collaboration of Observational HIV Epidemiological Research Europe (COHERE) Group
Analysis and Writing Committee
Amanda Mocroft, Hansjakob Furrer, Jose M. Miro, Peter Reiss, Cristina Mussini, Ole Kirk, Sophie Abgrall, Sylvie Ayayi, Barbara Bartmeyer, Dominique Braun, Antonella Castagna, Antonella d’Arminio Monforte, Brian Gazzard, Félix Gutierrez, Isabel Hurtado, Klaus Jansen, Laurence Meyer, Pepa Muñoz, Niels Obel, Pere Soler-Palacin, Antonios Papadopoulos,
Fran-çois Raffi, Jose T. Ramos, Jürgen Rockstroh, Dominique
Salmon, Carlo Torti, Josianne Warszawski, Stephane de Wit, Robert Zangerle, Céline Fabre-Colin, Jesper Kjaer, Genevieve Chene, Jesper Grarup, Jens D. Lundgren.
The Opportunistic Infections Project Team
Sophie Abgrall, Sylvie Ayayi, Barbara Bartmeyer, Dominique
Braun, Antonella Castagna, Antonella d’Arminio Monforte,
Hansjakob Furrer, Brian Gazzard, Félix Gutierrez, Isabel Hurtado, Klaus Jansen, Ole Kirk, Jens Lundgren, Laurence Meyer, Jose Miiro, Amanda Mocroft, Pepa Muñoz, Cristina Mussini, Niels Obel, Pere Soler Palacin, Antonios Papadopou-los, François Raffi, Jose T. Ramos, Peter Reiss, Jürgen Rock-stroh, Dominique Salmon, Carolo Torti, Stephane de Wit, Robert Zangerle, Jens D. Lundgren.
COHERE Steering Committee
Steering Committee—contributing cohorts: Robert Zangerle (AHIVCOS), Antonios Papadopoulos (AMACS), Josiane Warszawski (ANRS CO1 EPF/ANRS CO11 OBSERVATOIRE EPF), Laurence Meyer (ANRS CO2 SEROCO and ANRS CO6 PRIMO), Sylvie Ayayi (ANRS CO3 AQUITAINE), Sophie
Abgrall (ANRS CO4 FHDH), François Raffi (ANRS CO8
COPILOTE), Peter Reiss (ATHENA), Barbara Bartmeyer (CASCADE), Brian Gazzard (CHIC), Jurgen Rockstroh (Cologne Bonn), Félix Gutierrez (Co-RIS), Pere Soler-Palacin (Co-RISpe cat), Niels Obel (Danish HIV Cohort), Amanda Mocroft (EuroSIDA), Ole Kirk (EuroSIDA), Isabel Hurtado (GEMES-Haemo), Dominique Salmon (HEPAVIH), Antonella d’Arminio Monforte (ICONA), Klaus Jansen (Kompnet), José Ramos (Madrid Cohort), Carlo Torti (MASTER), Cristina Mussini (MODENA), Jose M. Miró (PISCIS), Antonella Casta-gna (San Raffaele), Hansjakob Furrer (SHCS), Dominique Braun (SHCS), Stephane de Wit (St. Pierre Cohort), Pepa Munoz (VACH).
Paediatric cohort representatives: Ali Judd, Josiane Warszawski. European AIDS Treatment Group: David Haerry.
Executive committee:
Ian Weller (Chair, University College London), Jordi Casa-bona (PISCIS), Dominique Costagliola (FHDH), Antonella
d’Arminio-Monforte (ICONA), Manuel Battegay (MoCHIV),
Maria Prins (CASCADE), Frank de Wolf (ATHENA), Jesper Grarup (Head of Copenhagen Regional Coordinating Centre), Genevieve Chene (Head, Bordeaux Regional Coordinating Centre).
Regional coordinating centres:
Bordeaux RCC cohorts: Céline Colin, Christine Schwimmer, Guillaume Touzeau; Copenhagen RCC cohorts: Jesper Kjaer, Maria Campbell.
Project leaders and statistical analysis:
Julia Bohlius, Vincent Bouteloup, Heiner Bucher, Alessandro Cozzi-Lepri, François Dabis, Antonella d’Arminio Monforte, Frank de Wolf, Maria Dorrucci, Matthias Egger, Frederik Engsig, Hansjakob Furrer, Ole Kirk, Olivier Lambotte, Char-lotte Lewden, Rebecca Lodwick, Sophie Matheron, Laurence Meyer, Jose Miro, Amanda Mocroft, Niels Obel, Roger Paredes, Andrew Phillips, Massimo Puoti, Joanne Reekie, Caroline Sabin, Alexandra Scherrer, Colette Smit, Jonathan Sterne, Ro-dolphe Thiebaut, Claire Thorne, Carlo Torti, Viktor von Wyl, Linda Wittkop, Jim Young.