N e w L C A T h e s e s G a s P u r i f i c a t i o n S y s t e m s
New LCA Thesis and Book
U n c e r t a i n t y A n a l y s i s a n d T o x i c i t y C l a s s i f i c a t i o n in L i f e - C y c l e A s s e s s m e n t U s i n g t h e C a s e - s t u d y o f G a s P u r i f i c a t i o n S y s t e m s
Markus A. Meier 1 and Konrad Hungerbiihler z
1Ciba Specialty Chemicals Inc., K-147.4.39, CH-4002 Basel, Switzerland
2 Swiss Federal Institute of Technology, Department of Chemical Engineering, Safety and Environmental Technology Group, ETH-Zentrum UNK, CH-8092 Zurich, Switzerland
Corresponding author: Dr. Mart(us A. Meier; e-mail: [email protected]
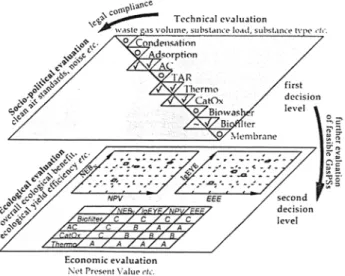
organic compounds, was used as a case study. The decision- making process for the choice of the most adequate GasPS may be divided into two "decision levels" (Fig. 1). Based on their compliance with clean air legislation and their technical feasibility (first decision level), four GasPSs were chosen for in-depth evaluation: a biofilter, an activated carbon filter (AC), a catalytic incinerator (CatOx), and a thermoreactor (Thermo). The second decision level evaluates the alternatives with re- spect to their economic and ecological performance. Economic evaluation was based on the Net Present Value (NPV) of the costs during construction, operation and disposal of the GasPSs. Ecological performance of GasPSs was evaluated us- ing life-cycle assessment methodology (LCA). Life-cycle im- pact assessment was performed using the methods Eco-Indi- cator 95 and Swiss Ecopoints.
With respect to LCA and to ecological evaluation in gen- eral, three major innovations were made in this study: the addition of a quantitative uncertainty analysis, a new classi- fication for toxic substances, and the definition of eco-effi- ciency indicators.
I n t r o d u c t i o n
Over the last few years, the chemical industry has begun to implement the ideas of sustainable development by applying the concept of integrated product and process development (II'PD). Even if this concept is fully implemented, however, end-of-pipe technologies will remain necessary for reducing the remaining environmental impacts. Therefore, given the socio-political, technical, ecological and economic contexts that have motivated IPPD, there is a critical need for the integrated evaluation of these end-of-pipe technologies.
In this thesis, an extensive study was carried out to develop an integrated evaluation methodology for gas purification systems (GasPSs). The purification of an industrial waste gas stream, consisting of a mix of twenty different volatile
Fig. 1: Overall decision-making process for an adequate GasPS in the chemical industry, structured on two decision levels (first level: techni- cal and socio-political evaluation; second level: ecological and eco- nomic evaluation).
Int. J. LCA 5 (2) 75 - 77 (2000)
9 ecomed publishers, D-86899 Landsberg, Germany and-Ft. Worth/-rX, USA 9 Tokyo, Japan 9 Mumbai, India 9 Seoul, Korea
Gas Purification Systems
New LCATheses
1 Quantitative U n c e r t a i n t y Analysis
Decision making in real life must occur under uncertainty. After an LCA was performed on the four GasPS alterna- tives, detailed uncertainty and imprecision analyses of the results were performed using Monte Carlo simulations with Latin Hypercube sampling. In a first step, nine different quantifiable uncertainties in Eco-Indicator 95 were identi- fied (others were found for Swiss Ecopoints):
(1) Measurement of site-specific process data (dl) , (2) age of the foreground data (temporal variation, d2) , (3) choice of background data modules (d3) ,
(4) emission measurements (d4) ,
(5) averaging background data over space and time (ds) , (6) non-consideration (ignorance) of emissions (d6) , (7) determination of classification factors (wl) ,
(8) determination of the normalisation factors (w2) , and (9) determination of the reduction factors (83).
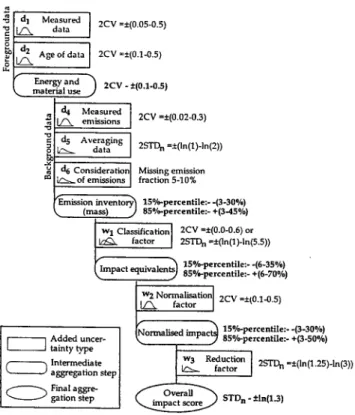
Uncertainties were quantified based on the analysis of the actual foreground and background data, literature, and ex- pert judgement. The distribution of the uncertainty was modelled either with the normal or log-normal distribution. Fig. 2 summarises the results from the uncertainty quantifi- cation as well as the uncertainty propagation throughout the LCA aggregation.
i & data 2CV +(005 05) "~ 1 Measured = . . . dl~ Age of data 2CV =+(0.1-0.5) [ E..~,,~,..d "~ 2cv-,(0.1-0.5) k~. materlal use j ,r d4 Measured I .~ ~ emissions , 2CV =+(0.02-0.3) d5 Averaging [ ~ data I 2STDn =•
d6 Consideration Missing emission
m L~:~of emissions fraction 5-10%
Emksslon mventory~ 15%-percentile:--(3-30%) (mass) , ] 85%-percentile:- +(345%) Wl Classification] 2CV =*(0.0-0.6) or factor I 2STDn =+(ln(1)'ln(5"5)) 9 ~x~ 15%-pe rcentile:- -(6-35%) ~ m p a c t eqmvalen~J 85%-p ... tll . . . . (6-70o/.) w2~k qormalisatlon factor 2CV -•
f .. . . r~ormausecl a n ac ~ 15%-pe rce ntile:- -(3-30%)
P ~ sso/0-p .. . . . tll .... (3-s0%) ]Added ... ] ! tainty type I ! [ w3 Reducaon 2ST~ =• 2S)4n~3~) Intermediate [ 1[s factor [ ., 9 . 9 ,, ~ aggregation step [ Final aggre- [ - - _ _ 1 gatio.step i k . . ~ a ~ - ; ; ~ j ~ ) ST~.-*~n(1.3~
Fig. 2: Uncertainty propagation tree for calculating the ecological bur- den of gas purification systems throughout the LCA steps using the modified Eco-lndicator 95 (STD: Standard deviation of the correspond- ing normal distribution; CV: coefficient of variation).
Based on the uncertainty analysis, the following findings were possible for the LCA results:
(1) Distribution of the overall effect score,
(2) evaluation of the significance of the different effects scores on the level of impact categories and overall score, (3) significance of the relative ranking of various GasPSs
alternatives,
(4) identification of major contributions to the overall un- certainty range, and
(5) analysis of the influence of data correlation on the un- certainty range.
2 Classification of Toxic S u b s t a n c e s
Neither Eco-Indicator 95 nor Swiss Ecopoints account for the toxicity of volatile organic compounds found in indus- trial waste gas streams, such as the one in this case study. Thus, a new toxicity classification method had to be devel- oped in the thesis and integrated into both methods. The classification method was developed based on fate-and-ex- posure modelling similar to the EU-risk assessment of chemi- cals. The volatile organic compounds were classified on the basis of a "critical discharge flow" into a unit world. The critical discharge flow is the discharge flow leading to an impairment of either humans or ecosystems and is related to an adequate reference substance. Finally, the strengths and weaknesses of the proposed classification method and the fate-and-exposure modelling were reviewed with respect to the following issues: (1) quality of toxicological data, (2) complexity of the applied unit world model, (3) impacts of degradation products, (4) sensitivity of toxicity classifica- tion to uncertainties of input variables, (5) time to steady- state for fugacity models, and (6) the choice of appropriate reference substances.
3 Definition of Eco-Efficiency Indicators
For an integrated evaluation of end-of-pipe GasPS technolo- gies, four appropriate performance indicators have been de- fined in the thesis. The eco-efficiency indicators complement one another and describe the system's performance adequately. The performance indicators assist the decision-making proc- ess in choosing
adequate
GasPSs. Net Ecological Benefit (NEBN) measures if, and how much of, an overall ecological benefit is reached. It is a measure ofeffectiveness.
Ecological Yield Efficiency (IgEYE) measures how the invested ecologi- cal costs compare to the particular ecological benefits achieved. It is a measure ofefficiency.
Economic costs are measured using NPV. Finally, Ecological-Economic Efficiency (EEE) pro- vides the ratio of NEB N to NPV.Fig. 3 shows the indicators NEB N and lgEYE for the four investigated GasPSes. The indicators allow a ranking and prioritising of the various GasPSes. Due to the comprehen- sive uncertainty analysis, the significance of the ranking can be determined. For instance, the probability that NEB N of the activated carbon filter (AC) is higher than for the cata- lytic incinerator (CatOx) is 68.9%.
New LCATheses
Gas Purification Systems
Based on these indicators, various optimisation approaches and their potentials could be identified for the investigated GasPSes. In addition, the ability of the GasPSes to adapt to changes in the pollutant load or waste gas volume was dis- cussed. Finally, the clean air legislation was analysed with re- spect to their effectiveness and efficiency. A simplified LCA for the evaluation of GasPSes was proposed in the thesis.
Fig. 3: Ranking and significance diagrams of the investigated GasPSes (NEB N [Pts./m 3 gas] and IgEYE [-] as median; modified Eco-lndicator 95).The middle column shows the ranking with the corresponding in- dicator value. The significance is indicated for each comparison as the probability of the actual ranking (P(X>0) in %).
4
Summary
The defined performance indicators and the adapted evalua- tion methods allow an integrated evaluation of gas purifica- tion systems with respect to their effectiveness and efficiency.
Reference
MEIER, M.A. (1997): Eco-Efficiency Evaluation of Waste Gas Puri- fication Systems in the Chemical Industry; LCA documents, Vol. 2 (edited by Walter Kl6pffer and Otto Hutzinger); Ecoin- forma Press, Bayreuth (Germany)
Spatial Differentiation in Life Cycle Impact Assessment
A Framework, and Site-Dependent Factors to Assess Acidification and Human Exposure" Jos~ Potting
IPU/LCC-DTU Building 424, DK-2800 Lyngby, Denmark; e-mail: [email protected]
Table of Contents
4.5
4.6
1 Introduction 1 4.7
1.0 Abstract 1 4.8
1.1 Introduction 1 4.9
1.2 Methodology development in progress 2 5
1.3 General framework 3 5.0
1.4 Spatial differentiation and threshold exceedance 6 5.1
1.5 Problem-setting, research question and outline of this dissertation 7 5.2
1.6 References 9 5.3
2 The linear nature of environmental impact 13 5.4
2.0 Abstract 13 5.5
2.1 Introduction 13 5.6
2.2 Necessity of the impact assessment phase 14 5.7
2.3 Cause/effect relationships 15 5.8
2.4 Predicted impact and expected occurrence of actual impact 17 5.9
2.5 Product oriented environmental policy 18 5.10
2.6 Regional, continental and global impact categories 19
2.7 Local impact categories 20 6
2.8 Conclusions 22 6.0
2.9 Outlook 23 6.1
2.10 Acknowledgement 23 6.2
2.11 References 24 6.3
3 Framework for spatial differentiation 27 6.4
3.0 Abstract 27 6.5
3.1 Introduction 27 6.6
3.2 The linear nature of environmental impact in LCA 28 6.7
3.3 Levels of detail in characterisation 29 6.8
3.4 Cause/effect relationships in characterisation modelling 33 6.9
3.5 Temporal aspects in characterisation modelling 34 7
3.6 Spatial aspects in characterisation modelling 36 7.1
3.7 Site-dependent assessment 37 7.2
3.8 Conclusions 39 7.3
3.9 Acknowledgement 40 7.4
3.10 References 40 7.5
4 Thresholds in human toxicity in life cycle 45 7.6
4.0 Abstract 45 7.7
4.1 Introduction 45 7.8
4.2 "Less is better" and "only above threshold" 47 7.9
4.3 No-effect-levels 49 7.10
4.4 Data availability 51 7.11
"Josepha Maria Sarbara (Jose) Potting got her doctorate at the University of Utrecht, March 8th, 2000, 15.30 o'clock.
Existing modelling of human toxicity in LCA 52
Integration of principles and methods 54
Human toxicity from air emissions in LCA 56
Conclusions 57
References 59
Human exposure from air emissions 63
Abstract 63
Introduction 63
Human exposure from air emissions 65
Identification of source types, and classification of processes 68 Accumulated human exposure increase local to the source 71 Accumulated human exposure increase regional to the source 76 Total increase of accumulated exposure from air emissions 82 Identification of the exposure situation being above or below the threshold 85
Conclusions 86 Acknowledgement 87 References 88 Appendix 90 Acidification 95 Summary 95 Introduction 95
Life cycle inventory and impact assessment 96
The RAINS model 98
Mathematical framework 108
Acidification factors 110
Discussion 120
Conclusions and recommendations 123
Acknowledgement 124
References 124
Discussion 127
Introduction 127
The basis for spatial differentiation 128
Levels of sophistication and uncertainties in impact modelling 130
The mathematical framework for spatial differentiation 132
Application of site-dependent impact factors 134
LCA in relation to RA and EIA 136
Threshold exceedance in LCA 138
Site-dependent normalisation 141
Temporal differentiation in LCA 144
Conclusions and issues for further research 145
References 147
![Fig. 3: Ranking and significance diagrams of the investigated GasPSes (NEB N [Pts./m 3 gas] and IgEYE [-] as median; modified Eco-lndicator 95).The middle column shows the ranking with the corresponding in- dicator value](https://thumb-eu.123doks.com/thumbv2/123doknet/14870694.639711/3.918.102.450.117.254/ranking-significance-diagrams-investigated-gaspses-modified-lndicator-corresponding.webp)