Intracortical Excitation of Spiny Neurons in Layer 4 of Cat Striate Cortex In Vitro
11
0
0
Texte intégral
(2) Intracellular Recording Recording electrodes were filled with 0.5 M potassium methyl sulphate with 5 mM potassium chloride and 2% biocytin (2 mg/100 µl) (Sigma). The first electrode, positioned in the upper portion of layer 4 parallel to the cortical surface, was advanced obliquely using a microdrive (SCAT-01, Digitimer, Welwyn Garden City, UK) until we obtained a stable impalement. To study connections within layer 4, a second electrode approaching from the opposite direction was then placed on the slice surface parallel to the first, but slightly further from the layer 3/4 border. This strategy was adopted in light of the known axonal arborization patterns of spiny stellate neurons in layer 4, which project mainly to superficial layers. The pipette entry points were 200 µm apart laterally on average. The second electrode was advanced until a second neuron was recorded. We tested whether this second neuron was synaptically connected to the first. If no connection was found in either direction, we abandoned the second neuron after a total duration of only a few minutes (i.e. usually insufficient for biocytin to fill the cell). The process was repeated until a connection was found or the first neuron was lost, after which we moved to a new area of the slice, to avoid possible ambiguity in matching physiology to labelled neurons. Positions of the pipette penetrations in the slice were plotted precisely with the aid of an eyepiece micrometer, and the angles of penetration noted, before moving to a new site. In studying connections between layer 6 and layer 4, we varied the search strategy, beginning sometimes with a layer 6 impalement. Within layer 4, the ratio of connections found (all types — inhibitory or excitatory) to formally tested pairs ranged from 3% to 28% in different experiments. Layer 6 to layer 4 connections were much harder to find than connections within layer 4. All excitator y postsynaptic potentials (EPSPs) were recorded at postsynaptic membrane potentials between –65 and –75 mV. Presynaptic activity was evoked by current injections of varying amplitude, adjusted to trigger single or multiple action potentials. We did not usually use separate current steps to control spike timing, so the intervals used to study paired-pulse behaviour were variable. Where multiple intervals were studied, we report the interval nearest to 50 ms. Histology Following recording from cells, slices were immediately fixed in 4% paraformaldehyde/0.5% glutaraldehyde/0.2% picric acid in 0.1 M phosphate buffer, pH 7.4 (PB), and left overnight. Slices were then washed several times in PB and then transferred through a graded series of sucrose solutions (10–30%) before being freeze-thawed in liquid nitrogen. Each slice was then resectioned to a thickness of 60 or 80 µm, preceding a standard biocytin reaction technique. The sections were incubated in a solution of avidin–biotin complex (ABC; Vector Labs Ltd, Peterborough, UK), 2% in PB, overnight at 4°C. After several washes in PB the sections were transferred to a 0.16% solution of Hanker–Yates reagent (Sigma) in PB for 15 min. A solution of hydrogen peroxide was then added to give a final concentration of 0.004% and the reaction monitored under a dissecting microscope. When the cell had become sufficiently dark, the reaction was terminated by rinsing several times with PB. The sections were then osmicated in a 1% solution of OsO4 (in PB), dehydrated through a graded series of ethanol and then mounted on microscope slides in epoxy resin (Araldite or Durcupan; Fluka) with coverslips. In later experiments diaminobenzidine rather than Hanker–Yates was used, and the ABC reaction was preceded by a 10 min preincubation in 3% hydrogen peroxide to decrease background staining. Cells were drawn and reconstructed using the TR A KA reconstruction system (Anderson et al., 1994). Most neurons impaled in layer 4 were spiny stellate cells and star pyramidal cells, though ∼10% of recovered neurons impaled in layer 4 were pyramidal cells of lower layer 3 or upper layer 5; these have been excluded. Presumed layer 4 cells that were not identified anatomically have been included. Layer 4 neurons were provisionally identified at the time of recording as spiny (i.e. excitator y) or smooth (i.e. inhibitor y) on the basis of their firing patterns. In the cat confirmed smooth or inhibitory neurons responded to increments of suprathreshold current injection with increases in firing rate three to four times greater than those seen in confirmed spiny or excitatory neurons (K. Tarczy-Hornoch, unpublished. 834 Intracortical Excitation of Layer 4 • Tarczy-Hornoch et al.. Ph.D. thesis). Since the classification on the basis of firing pattern was invariably confirmed when further information concerning synaptic inf luence or morphology became available, it has been used to identify postsynaptic targets as ‘spiny’ neurons when no morphological data were obtained.. Electrophysiological Data Analysis All synaptic responses were filtered at 2 kHz and recorded with 5 kHz digitization using a CED 1401 interface (Cambridge Electronic Design) and SIGAVG software (Cambridge Electronic Design). In-house software was used to derive input resistances from the voltage responses to small 0.5 ms current pulses. For analysis of synaptic responses, we used in-house software to extract the amplitudes of individual synaptic events from raw data traces. These were measured as differences between averages taken over short windows at baseline and at signal peak, whose positions were defined relative to presynaptic action potential peak. In pairs or trains of EPSPs with short interpulse inter vals, the measurement windows for later events fall on the decay phase of previous EPSPs; individual trial measurements were corrected for this decaying baseline on the basis of a template average waveform derived from the responses to repeated single action potentials. For every trace, we also measured the amplitude difference, during the baseline period, between windows of the same size and separation as used for measuring the response, to determine the variance of the background noise. To improve accuracy, four separate determinations of noise variance were made using different regions of the baseline, and the average of these variances was used. Noise-corrected coefficients of variation (CV) of EPSPs were calculated as. SD2EPSP − SD2noise mean EPSP Second and later pulses in trains sometimes required the selection of different amplitude measurement windows from the first pulse, in which case separate corresponding noise measurements were performed to calculate CV for these pulses. The number of trials used to calculate CV is indicated in the tables; this was a subset of consecutive trials at 1 Hz, usually drawn from a larger set of recorded trials exploring paired pulses, trains and different repeat rates (total trials recorded ranged from 100 to >1500 except for EPSPs 8, 10, 27, 35). In deriving CV of pulse 2 for analysis of paired-pulse changes in CV, we used between 100 and 400 trials for pulse 2 CV (except for EPSP 37, using 50 trials for pulse 2). Means and CVs reported are for periods of data in which the mean was stable over time.. Analysis of Statistics of Neurotransmitter Release In the theory of quantal analysis of synaptic transmission in the central nervous system (Jack et al., 1990, 1994; Redman, 1990), the binomial parameter n is thought to be the number of synapses, or release sites, mediating the synaptic connection, and on this assumption is an integer (Korn and Faber, 1987). The likelihood that neurotransmitter release (i.e. release of at least one vesicle) will take place at a given release site is given by the probability p. In this paper we make the simple assumption that the release probability at each release site is the same and that the quantal size, q, recorded from the soma, is similar for all release sites of a given connection. Our observations, in rat hippocampus and rat visual cortex, are in support of that assumption (Larkman et al., 1997) (N.J. Bannister, N. Hardingham and A.U. Larkman, unpublished observations). On this basis, we can use the measures of the mean and standard deviation (SD) of our samples as an estimate of the above parameters in the following way:. mean = nqp. b. (1). g. SD = np 1 − p q2. CV =. F 1− pI GH np JK. 1 2. (2). 1 2. (3).
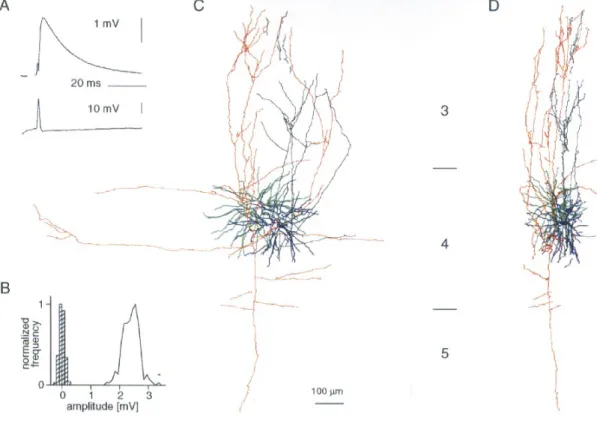
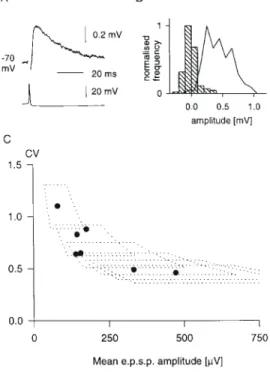
(3) Figure 1. Synaptic connection between two spiny stellate cells. (A) Averages (200 trials) of postsynaptic (upper trace) and presynaptic (lower trace) recordings from this cell pair. (B) Amplitude histograms of background noise (hatched bars) and EPSP (200 trials). Frequency normalized to highest frequency for each histogram. (C,D) Digitized reconstruction, from serial sections, of morphology of cell pair from which EPSP 3 was recorded. Cortical layers 3–5 as indicated. (C) is transverse view, (D) is parasaggital view. Postsynaptic neuron in green dendrites and red axon, presynaptic neuron in blue dendrites and black axon. Reconstructed by J.C. Anderson. 1 CV 2. =. np 1− p. (4). For each n, a range of p and q values will define a limited area on the plot of CV against mean (see Figs 3A and 5C). Our approach has been to find the minimum ranges for both p and q that embrace all our data points. We have also made plots of 1/CV2 against mean amplitude to shed light on the locus of synaptic plasticity (Malinow and Tsien, 1990). Trajectories for changes in release probability alone should fall not just above the diagonal, but on a hyperbolic trajectory whose particular form depends on the release probability for the condition used for normalization. We will illustrate these in selected cases. For Figure 4F, release probabilites are derived from two pairs of values for mean and CV that might reasonably be assumed to differ only in release probability, since neither n nor q would be expected to change at repeat rates <1 Hz [AMPA recovery from desensitization occurs over tens of milliseconds (Trussell and Fischbach, 1989; Colquhoun et al., 1992)]. On this assumption, the release probabilities are derived as follows: using equations (1) and (3) above it can be shown, by simple algebraic manipulation, that. p1 =. 1 − ab2 1 − b2. and p2 =. p1 a. where a is the ratio of the first to the second mean and b is the ratio of first to the second CV.. Results Dual intracellular recording yielded recordings from 30 pairs of layer 4 excitatory neurons, seven connections between pre-. synaptic pyramidal cells in layer 6 and postsynaptic spiny neurons in layer 4, and one connection from a layer 4 spiny neuron to layer 6. Of the postsynaptic targets of excitatory connections between layer 4 spiny neurons, 14 were identified morphologically as spiny stellate cells, and 9 as pyramidal cells of layer 4. Of the presynaptic sources, 12 were spiny stellate cells and 6 were layer 4 pyramidal cells. The remaining cells were not identified morphologically, but their electrophysiological properties were characteristic (see Materials and Methods) of excitatory neurons, and presumably were other examples of either the spiny stellate or pyramidal cells we had identified morphologically. Excitatory Synaptic Connections Between Layer 4 Spiny Neurons The properties of the 14 layer 4 excitatory synaptic connections onto spiny stellate cells are summarized in Table 1. In seven pairs, the presynaptic neurons were also identified: five were spiny stellate cells, and two were pyramidal cells. A reconstruction of the morphology of a connected pair of spiny stellate neurons is shown in Figure 1, along with the EPSP recorded. Comparison of EPSP variation to baseline noise suggests multiquantal transmitter release with trial-to-trial f luctuations in quantal content (Fig. 1B). The absence of low-amplitude events indicates a high probability of neurotransmitter release. The average EPSP amplitude recorded in spiny stellate cells was 1018 µV and the average CV was 0.25. Amplitudes tended to be larger and CVs lower for the subset of EPSPs originating from identified spiny stellate neurons: these EPSPs averaged 1739 ± 790 µV in amplitude, with an average CV of 0.19 ± 0.16.. Cerebral Cortex Dec 1999, V 9 N 8 835.
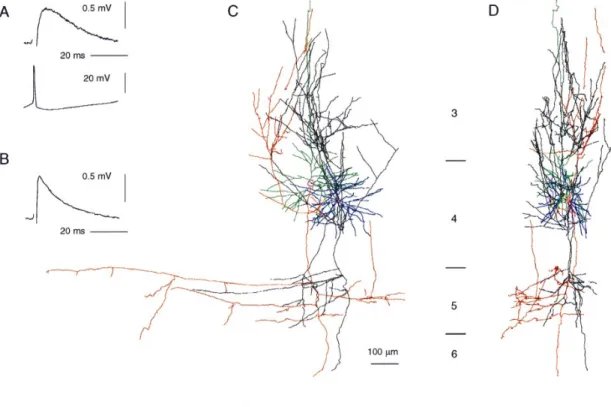
(4) Figure 2. Synaptic connection from spiny stellate to layer 4 pyramidal cell. (A) Averages (200 trials) of postsynaptic response (upper trace) and presynaptic spike (lower trace) recorded from the cell pair in (C) (EPSP 16). (B) EPSP 20, averaged response (200 trials), showing waveform typical of most EPSPs recorded in pyramidal cells. (C,D) Digitized reconstruction, from serial sections, of morphology of cell pair from which EPSP 16 was recorded. Cortical layers 3–5 as indicated. (C) is transverse view, (D) is parasaggital view. Presynaptic spiny stellate shown with blue dendrites and black axon. Postsynaptic pyramid shown with green dendrites and red axon. Reconstruction by J.C. Anderson.. Table 1 Layer 4 EPSPs onto spiny stellate cells EPSP. Amp (µV). CV. nCV. RT (ms). HW (ms). Rin pp (MΩ). ∆/p1. IPI (ms). Source d (µm). 1 2 3 4 5a 6 7 8 9 10 11 12 13 14. 1838 1987 2433 382 2055 961 786 1295 178 437 604 359 790 153. 0.11 0.11 0.11 0.47 0.17 0.17 0.10 0.19 0.35 0.31 0.27 0.40 0.24 0.51. 340 300 200 100 400 400 250 40 120 50 100 400 200 100. – – 1.6 0.8 0.8 0.8 1.6 0.8 0.8 – – 1.4 1.8 –. 11 7.6 13 8.4 8.2 5.4 18 11 5.4 – 12 14 18 16. 121 24 72 37 109 – – – – – 102 86 – –. – d n n n – d – n d n d d d. – –0.3 –0.06 –0.09 –0.07 – –0.22 – 0.04 –0.11 –0.02 –0.17 –0.34 –0.22. – 28 54 31 43 – 79 – 19 41 36 38 50 46. ss ss ss ss ss pc pc – – – – – – –. 20 102 55 58 – 91 92 – 169 – 83 76 131 –. Mean 1018 SD 768. 0.25 0.14. 1.2 0.4. 11.4 4.3. 79 37. – –. – –. – –. – –. 88 41. ,. Amp, mean amplitude (single pulses at 1 Hz stimulation rate); CV, coefficient of variation: (SDEPSP2 – SDnoise2)1/2/meanEPSP; nCV, number of trials used for calculation of CV; RT, rise-time; HW, half width; Rin, input resistance (postsynaptic neuron); pp, paired-pulse behaviour (d, depression; n, no change, i.e. <10% change); ∆/p1: paired-pulse amplitude change: (amppulse2 – amppulse1)/ amppulse1; IPI, mean interpulse interval; source, presynaptic neuron (ss, spiny stellate; pc, pyramidal cell); d, lateral separation of neurons, measured from histological material (italics) or estimated from measured electrode positions. a If a second pulse occurred on only 15% of trials, this EPSP showed atypical facilitation of 22% (IPI 28 ms).. The properties of the nine excitatory connections recorded in layer 4 pyramidal cells are summarized in Table 2. The amplitude of EPSPs recorded in pyramidal cells averaged 965 µV, and CV 836 Intracortical Excitation of Layer 4 • Tarczy-Hornoch et al.. averaged 0.20. Four of the presynaptic neurons were identified as spiny stellate cells and three as pyramidal cells. A reconstruction of a presynaptic spiny stellate cell and the postsynaptic layer 4 pyramidal cell to which it connected is shown in Figure 2C,D, along with the EPSP recorded (Fig. 2A). Although most EPSPs onto pyramidal cells had shorter rise-times (as in Fig. 2B), this EPSP and one other recorded in a pyramidal cell (EPSP 21, Table 2) had particularly long rise-times and rounded waveforms, whereas the rise-times of EPSPs onto spiny stellates were fast and never exceeded 1.8 ms to peak. The rounded waveform (recorded under NMDA receptor blockade) suggests cable filtering of the synaptic signal between a distant site of synaptic current f low (such as the apical dendrite of a pyramidal cell) and the somatic recording site (Jack et al., 1975). The presynaptic axon ascended alongside the postsynaptic apical dendrite in this cell pair, so a distal synaptic location was possible. The properties of seven further EPSPs, recorded from postsynaptic neurons whose morphology was not recovered, are summarized in Table 3. The average mean amplitude and CV of these EPSPs were 787 µV and 0.14 respectively. Pooling the data for all connections between layer 4 excitatory neurons, the overall average mean amplitude is 949 ± 653 µV, and average CV is 0.21 ± 0.12. EPSP amplitude and CV vary considerably across the sample of 30 connections. There was no correlation between the EPSP amplitude and the input resistance of the postsynaptic neurons (n = 16). There was an inverse relationship between CV and mean amplitude across the population (Fig. 3A). The dotted outlines indicate the set of amplitude–CV pairs possible when release probability varies between 0.69 and 0.98, and quantal size between 100 and 300 µV, for different numbers of release sites (shown from 1 up to.
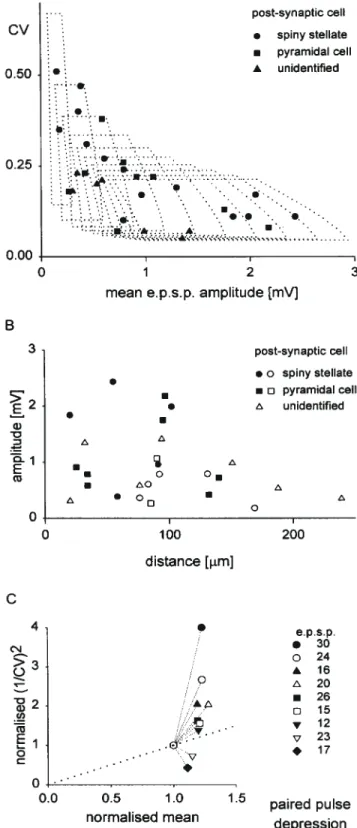
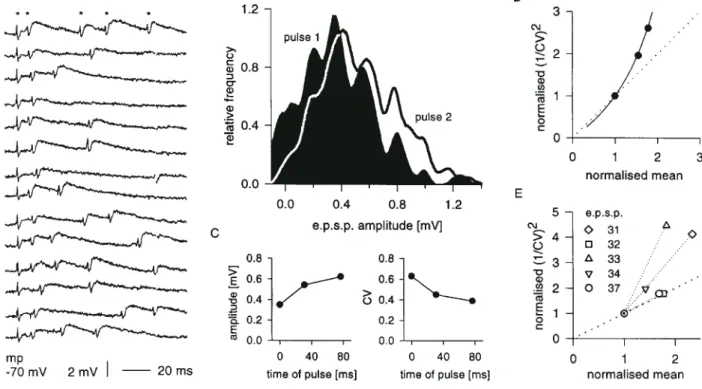
(5) Table 2 Layer 4 EPSPs onto pyramidal cells EPSP Amp (µV). CV. nCV. RT (ms). HW (ms). Rin pp (MΩ). ∆/p1. IPI Source (ms). d (µm). 15 16 17 18 19 20 21 22 23. 0.13 0.07 0.23 0.22 0.38 0.26 0.08 0.22 0.18. 360 120 100 100 200 300 120 250 300. 0.6 2.2 – 1 0.8 0.8 3 0.6 1.4. 4.8 20 11 7 14.4 10.6 13.8 4.2 11.6. 14 – 71 – 97 75 – 47 34. d d d – n d – d d. –0.17 –0.16 –0.1 – –0.07 –0.22 – –0.1 –0.13. 41 44 36 – 49 50 – 30 31. ss ss ss ss pc pc pc – –. 95 140 132 25 34 34 97 90 85. 1.3 0.9. 10.8 5.0. 56 30. – –. – –. – –. – –. 81 42. Mean SD. 1752 723 419 912 583 787 2178 1071 264. 965 0.20 626 0.10. See Table 1 for key to abbreviations.. Table 3 Layer 4 EPSPs onto unidentified excitatory cells EPSP. Amp (µV). CV. nCV. RT (ms). HW (ms). Rin pp (MΩ). ∆/p1. IPI (ms). Source d (µm). 24 25 26 27 28 29 30. 301 1418 583 983 346 532 1349. 0.18 0.07 0.21 0.07 0.23 0.20 0.05. 400 100 400 45 200 100 135. 1 1 – 1.8 0.8 0.6 0.8. 9.2 11 10.4 12.2 10.4 7 11.6. – 49 69 – 29 – –. d n d n – n d. –0.19 –0.09 –0.16 –0.02 – –0.07 –0.19. 19 53 53 36 – 40 48. ss ss ss pc – – –. 20 94 76 151 239 188 32. 787 464. 0.14 0.08. 1.0 0.4. 10.3 1.7. 49 20. – –. – –. – –. – –. 114 82. Mean SD. See Table 1 for key to abbreviations.. 10). Assuming a larger range of quantal size — up to 700 µV — the data can be accounted for by an even narrower range of release probabilities (0.79–0.98; not shown). While the number of release sites involved may vary, release probability is uniformly ver y high at excitatory connections between spiny cells of layer 4. Figure 3B shows the relationship between EPSP amplitude and the net lateral distance (i.e. excluding separation along the white matter–pial axis) separating synaptically connected cells in layer 4. Large amplitude connections (>1 mV) were rarely seen at intersomatic distances >100 µm. Few connections at all were detected beyond 150 µm, but the sample is biased since cell pairs were deliberately sought close together to minimize subsequent ambiguity in cell identification. Most presynaptic cells were nearer to the white matter than their postsynaptic targets (not shown). While we deliberately sought presynaptic cells further from the layer 3/4 border after first establishing an impalement in a cell at the top of layer 4, we were able to test for connections in both directions in more than two-thirds of cases. Within this subset, more than three times as many connections from ascending projections were found as from descending ones. Dynamic Properties of Excitatory Synaptic Connections Between Layer 4 Spiny Neurons The synapses between layer 4 spiny cells showed either depression or no change on the second EPSP when pairs of action potentials were evoked in the presynaptic cell (n = 24; see Tables 1–3). Nine of the 15 connections that showed depression were. Figure 3. Excitatory connections between spiny neurons of layer 4. (A) CV as a function of mean amplitude for different EPSPs. Each domain outlined shows area encompassed as quantal size varies from 100 to 300 µV, and release probability from 0.69 to 0.98; each domain corresponds to a different number of release sites, shown ranging from 1 (far left) to 10. (B) EPSP amplitude as a function of lateral distance between cells. Filled symbols indicate measured distances (both cells recovered), and unfilled symbols indicate distances estimated from electrode positions measured at the time of recording. (C) Trajectories of 1/CV2 plotted against mean amplitude during paired pulse depression, for those connections between spiny neurons of layer 4 demonstrating at least 10% paired pulse depression. 1/CV 2 and mean are normalized to pulse 2 values.. Cerebral Cortex Dec 1999, V 9 N 8 837.
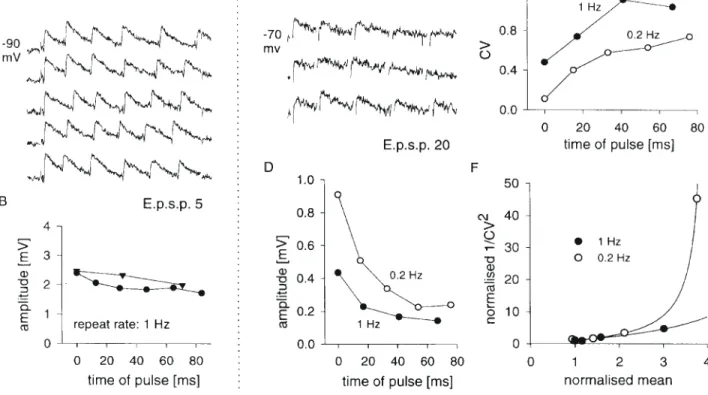
(6) Figure 4. Dynamic properties of excitatory synaptic connections between layer 4 spiny neurons. (A,B) Data from EPSP 5. (A) Consecutive raw data traces of responses to trains of six presynaptic spikes evoked by 100 ms presynaptic current injections at a rate of 1 Hz (closed circles in B). (B) Average amplitudes of successive EPSPs in response to trains of three (triangles) or six (circles) presynaptic spikes (30 trials each). Abscissa is average time of occurrence of pulses at a given ordinal position in train. (C–F) Data from EPSP 20. (C) Consecutive raw data traces of responses to trains of five presynaptic spikes evoked at 0.2 Hz (open circles in D). (D) Amplitude of successive EPSPs in response to trains of action potentials elicited by 100 ms presynaptic current pulses delivered at either 1 or 0.2 Hz (100 trials each). Abscissa as in (B). Note that pulse 1 amplitude for trains at 1 Hz is smaller than the amplitude of single pulses evoked at the same repeat rate (see Table 2). (E) CV of successive pulses in trains, as in (D). (F) Data from (D,E), shown as evolution of 1/CV2 compared to mean amplitude over the course of trains evoked at 1 or 0.2 Hz; values are normalized to last pulse in train. The solid lines show, for each case, the hyperbolic trajectory obtained if release probability alone is varied (curves derived on the assumption that starting amplitudes in the two conditions differ in release probability). These curves are normalized to last pulse values of mean and corresponding theoretical CV.. analysed for paired-pulse changes in CV. In seven of these, the ratio of 1/CV2 (pulse 1/pulse 2) was greater than the ratio of mean amplitudes (Fig. 3C), which suggests an important presynaptic contribution to paired-pulse depression (see Materials and Methods). In eight connections we also analysed responses to third and subsequent spikes in trains of action potentials. EPSPs were heterogeneous with respect to the magnitude of depression seen with repetitive stimulation. Some, such as EPSP 5 (Fig. 4A,B), were robust during repetitive firing, showing little second pulse depression except at very short interpulse intervals (Fig. 4B, compare second pulse in trains of six versus three spikes), and little overall depression during trains. Other synaptic responses, such as EPSP 20 (Fig. 4C,F), depressed more markedly under similar conditions (compare Fig. 4D, filled circles, and 4B). We consistently observed that average amplitude decreased cumulatively with successive pulses in a train, but tended to converge to a stable fraction of the first pulse amplitude (e.g. Fig. 4B,D). This was accompanied by an opposite trend in CV (Fig. 4E). However, EPSP amplitude depended also on the trial repeat rate, increasing with slower repeat rates in six of the seven cases examined. This is shown for EPSP 20, where the first pulse amplitude was larger and CV smaller, if presynaptic trains were evoked at 0.2 Hz rather than 1 Hz (Fig. 4D,E). We can calculate the release probabilities for the first pulse for the 1 and 0.2 Hz repeat rate conditions if we assume that the difference in first pulse response amplitude between the two. 838 Intracortical Excitation of Layer 4 • Tarczy-Hornoch et al.. conditions is due to a change in release probability (see Materials and Methods). We can then derive n from the CV, and thereby calculate release probabilities for successive pulses within trains. For EPSP 20, depression within the train is accounted for by a fall in release probability without change in quantal size, with p falling ∼70% by the end of the train from starting values of 0.45 and 0.94 for trains at 1 and 0.2 Hz respectively. Figure 4F illustrates the trajectory of 1/CV2 against mean amplitude over the course of a train of pulses for each trial repeat rate, closely matching in each case the predicted hyperbolic trajectory for pure changes in release probability.. Reciprocal Synaptic Connections Between Excitatory Neurons of Layer 4 Of the 20 pairs of layer 4 excitatory cells tested for reciprocity, four were reciprocally connected. One of these was the pair of pyramidal cells from which we recorded EPSPs 19 and 20 (Table 2). Another pair, consisting of a spiny stellate and an unidentified neuron, produced EPSPs 12 and 26 (Tables 1 and 3). Although reciprocity was established for the remaining two pairs, adequate data were only collected for one direction in each case before one cell was lost. For these two pairs the reciprocal EPSPs do not appear in the tabulated data, but the reciprocal of EPSP 14 (Table 1), from a spiny stellate to an unidentified neuron, was ∼1 mV in amplitude and the reciprocal of EPSP 27 (Table 3), from an unidentified neuron to a pyramidal cell, was ∼200 µV..
(7) Table 4 EPSPs in synaptic connections from layer 6 to layer 4 EPSP. amp (µV). CV. nCV (ms). RT (ms). HW (ms). Rin (MΩ). pp. ∆/p1. IPI (ms). Target. 31 32 33 34 35 36 37. 156 144 80 473 175 140 333. 0.65 0.83 1.10 0.46 0.88 0.64 0.49. 170 400 230 150 34 250 150. 1.0 1.0 0.6 1.4 1.0 1.4 1.6. 10.4 11.0 – 21.0 – 10.8 8.4. – – – 153 – 117 92. f f f f f f f. 1.35 0.77 0.84 0.42 0.13 0.54 0.69. 7 21 23 43 16 21 25. – – pc ss – – ss. Mean SD. 214 138. 0.72 0.23. 12.3 5.0. 121 31. – –. – –. – –. – –. 1.1 0.3. See Table 1 for key to abbreviations (f, facilitation, i.e. >10% change).. Excitatory Synaptic Connections Between Layer 6 and Layer 4 Spiny Cells Seven connections from layer 6 to layer 4 were recorded, as well as one connection from layer 4 to layer 6. The properties of the EPSPs recorded from the ascending connections are summarized in Table 4. The postsynaptic cells were recovered in three cases: two spiny stellates and one pyramidal cell. No connections were obtained in which both the presynaptic and the postsynaptic cell were recovered for morphological reconstruction. The presynaptic layer 6 cells, when recovered, had the dendritic and axonal morphology typical of the ‘lateral geniculate nucleusprojecting’ layer 6 pyramidal cells described by Katz (Katz, 1987), which form the majority of layer 6 neurons. The EPSPs evoked in layer 4 spiny cells by layer 6 neurons are small in amplitude (mean 214 µV), with high coefficients of variation (mean 0.72) (Table 4, Figure 5). As in the case of excitatory connections between spiny cells within layer 4, we determined the range of transmitter release parameters that would account for the range of mean amplitude–CV combinations obser ved for layer 6 to layer 4 connections. Figure 5C shows the domains covered as n varies from 1 to 6, if in each instance quantal size is allowed to range from 100 to 300 µV, and release probability ranges from 0.37 to 0.56. Dynamic Properties of Layer 6 to Layer 4 Excitatory Connections The EPSPs recorded from the seven postsynaptic cells in layer 4 all showed facilitation (Table 4). This facilitation persisted throughout a train of multiple presynaptic spikes (Fig. 6A). Figure 6B shows the shift in amplitude distribution occurring between pulse 1 and pulse 2 for EPSP 34. Figure 6C shows the rise in mean amplitude and fall in CV occurring over trains of three spikes. Figure 6D plots 1/CV2 against mean amplitude for these trains. The solid line would be the predicted trajectory for a pure change in p without an increase in q if we were to assume a q of 200 µV, based on the regular interpeak spacing of the histograms in Figure 6B (Larkman et al., 1991). A plot of the trajectories of 1/CV2 against the mean during paired-pulse facilitation is shown for five different layer 6 to layer 4 connections in Figure 6E. Excitatory Pathway from Layer 4 to Layer 6 One EPSP was recorded in a layer 6 pyramidal cell during a presynaptic impalement in layer 4. The layer 4 cell was not recovered, but the layer 6 cell had the morphology of the layer 6 pyramidal cells described by Katz (Katz, 1987) that project to the claustrum. These pyramidal cells have a single unbranched. Figure 5. Excitatory synaptic connections from layer 6 pyramidal cells to layer 4 spiny neurons. (A,B) Data from EPSP 34. (A) Averaged postsynaptic (upper trace) and presynaptic (lower trace) records (100 trials). (B) Amplitude distributions of background noise (hatched bars) and EPSP (100 trials). (C) CV as a function of mean EPSP amplitude for the seven layer 6 to layer 4 connections recorded. The polygonal domains represent the range of CV–amplitude combinations expected with different numbers of release sites, ranging from 1 (far left) to 6, if quantal size is allowed to vary between 100 and 300 µV and release probability between 0.37 and 0.56, for each value of n.. apical dendrite extending through layer 2/3, one very thick dominant basal dendrite giving the soma a fusiform appearance, an asymmetric basal dendritic tree with branches extending horizontally, and basal dendrites descending into the white matter. The local projections of the axons of the claustrally projecting cells are largely confined to layers 5 and 6. Consistent with this general pattern, the layer 6 cell was not reciprocally connected to the layer 4 cell. This EPSP is shown in Figure 7. The mean amplitude, with single action potentials evoked at 1 Hz, was 497 µV, with a CV of 0.48. Unlike the layer 6 pyramidal cells that project to layer 4, it showed 15% depression at an interpulse interval of 46 ms, without a change in CV. Pulse 1 amplitude increased to 851 µV at a lower trial repeat rate, with a CV of only 0.23, and under these circumstances pulse 2 depression was greater and associated with an increase in CV. If the difference in pulse 1 amplitudes at different repeat rates were due to release probability alone, then pulse 1 release probability at 1 Hz would be 0.36.. Discussion Comparison with In Vivo Findings Our findings in vitro regarding the different dynamics of the excitatory synapses in layer 4 are consistent with the findings of Ferster and Lindström who examined the responses of simple cells in layer 4 in vivo (Ferster and Lindström, 1985a,b). After destroying the relay cells of the lateral geniculate nucleus, they antidromically activated the recurrent collaterals of populations of layer 6 geniculocortical cells and observed ‘augmentation’, or facilitation, of the excitator y responses recorded in layer 4. Cerebral Cortex Dec 1999, V 9 N 8 839.
(8) Figure 6. Dynamic properties of layer 6 to layer 4 excitatory connections. (A–E) Data from EPSP 34. (A) Consecutive raw traces of postsynaptic responses to trains of two to five action potentials evoked by 100 ms presynaptic current injections. Asterisks indicate the first and subsequent spike artefacts for the first raw trace. First pulses are all aligned; timing of subsequent spikes varies from trial to trial. (B) Smoothed filtered amplitude distributions (230 consecutive trials, as in A) for first (shaded) and second pulse (thick line) responses. (C) Amplitude and CV of successive EPSPs evoked by trains of three spikes (120 trials). Abscissa is average time of occurrence of pulses of a given ordinal position in train. (D) Data from (C) plotted as (1/CV)2 against mean EPSP amplitude, normalized to first pulse. The solid line is the predicted trajectory for a pure increase in release probability with a quantal size of 200 µV, derived from the regular interpeak spacing in the histograms of (B). (E) Trajectories of 1/CV2 against mean during paired pulse facilitation for different layer 6 to layer 4 EPSPs. Values are normalized to those of first pulse.. Figure 7. Excitatory synaptic connection from layer 4 to layer 6. (A) Averaged presynaptic (lower trace) and postsynaptic (upper trace) records (250 trials). EPSP rise time 0.8 ms; half-width 8.2 ms. (B) Amplitude distributions (250 trials) of background noise (hatched bars) and EPSP (250 trials).. neurons. The layer 6 pyramidal synapses with layer 4 neurons, therefore, are the likely origin of the augmenting response seen in electrically evoked cortical potentials in vivo (Dempsey and Morison, 1943; Bishop et al., 1961; Spencer and Brookhart, 1961; Grossman et al., 1967; Sasaki et al., 1970; Morin and Steriade, 1981). Ferster and Lindström also noted the slow rising phase of the responses, which they thought ref lected latency scatter due to the slow conduction velocity of the corticogeniculate pyramidal cells (Ferster and Lindström, 1985b). They supposed that the lack of discrete inf lections on the depolarization was due to the convergence of many inputs from the layer 6 pyramidal cells, ‘each giving rise to a very small unitar y EPSP’. Consistent with this interpretation, we have shown that the each layer 6 pyramid evokes a small, facilitating EPSP in layer 4 postsynaptic cells. Ferster and Lindström also. 840 Intracortical Excitation of Layer 4 • Tarczy-Hornoch et al.. observed depression in both monosynaptic and the disynaptic EPSPs evoked by electrically stimulating relay neurons in the intact lateral geniculate nucleus (Ferster and Lindström, 1985b). The disynaptic EPSP was probably generated by the excitatory connections between layer 4 cells that we also found to depress. The monosynaptic EPSP was due to the geniculocortical synapse, which we have previously shown to depress in vitro (Stratford et al., 1996). Thus, the basic characteristics of the different excitatory synapses seen in layer 4 in vivo seem to be preserved, despite the insults involved in preparing and maintaining slices in vitro. Morphology and Local Connections of Layer 4 Excitatory Neurons Our frequent finding of pyramidal cells in layer 4 of cat visual cortex is at odds with the common assertion that layer 4 ‘largely contains spiny stellate cells’ (Peters and Payne, 1993), but is consistent with the findings of Martin and Whitteridge, who filled 17 spiny stellates and 14 star pyramidal cells in layer 4 during ‘blind’ in vivo recording (Martin and Whitteridge, 1984). However, the spiny stellate neurons do have much richer projections within layer 4 than the star pyramids (Martin and Whitteridge, 1984), so the spiny stellates are the major local source of excitation within layer 4 (Anderson et al., 1994). Within the layer 4 connections, our data do not suggest marked differences between the synapses involving pyramidal versus spiny stellate neurons; there was, however, a tendency for the synaptic connections between spiny stellate cells to produce among the largest and most reliable EPSPs. It has been estimated that at least 60% of the layer 6 pyramidal.
(9) neurons in the cat have their major collateral axonal projection in layer 4 and form asymmetric synapses with the dendritic shafts of spiny and smooth neurons (McGuire et al., 1984; Katz, 1987; A hmed et al., 1994). Seven synaptic connections we studied were of this circuit. We also recorded one connection from layer 4 to layer 6. The existence of a functional descending pathway from layer 4 to layer 6 has not been described, but the axons of layer 4 spiny neurons do send branches into the deep layers (Lund et al., 1979; Martin and Whitteridge, 1984). Spiny stellate cells also form synapses with the ascending dendrites of layer 6 pyramidal cells (J.C. Anderson, K.A.C. Martin and J.C. Nelson, unpublished observations) although the waveform of the EPSP we recorded did not suggest passive cable filtering of a distal input. There is now anatomical (A hmed et al., 1994) and physiological evidence (Ferster and Lindström, 1985a,b; Stratford et al., 1996) that at least three distinct groups of presynaptic excitatory neurons form synapses with layer 4 spiny stellate cells in cat. The physiological properties of two of these types of excitatory synapses described here appear to depend on the identity of the presynaptic neuron. Studies in rat cortex have shown that synapses originating from a given class of cells either facilitate or depress according to the nature of the postsynaptic target (Thomson, 1997; Markram et al., 1998, Reyes et al., 1998). Galarreta and Hestrin found that prolonged activation produced stronger depression at excitatory than at inhibitory cortical synapses in rat layer 5 cells (Galarreta and Hestrin, 1998). Clearly, therefore, neither the presynaptic nor the postsynaptic neuron alone determines synaptic behaviour. Our study focused on local connectivity, in contrast to the long-range horizontal connections known to exist in cat visual cortex. Over the range studied, we noted a decrease in EPSP amplitude with increasing physical separation of the neurons in a connected pair. This qualitatively supports a model of connectivity in which synapses between the cloud of axonal boutons of one neuron and of the dendritic arbour of another occur by chance (Braitenberg and Schuz, 1991). For spiny stellate cells the densities of synaptic boutons and their dendritic target sites approximate three-dimensional Gaussian distributions, so assuming random connectivity, the average number of release sites per synaptic connection decreases as a function of distance (Douglas et al., 1995). The patterns of axonal arborization, meanwhile, impose broad constraints on connectivity, as seen in the predominance of ascending over descending connections within layer 4. Estimates of Release Probabilities For each population of synaptic connections, we have examined the relationship of mean amplitude to coefficient of variation within the population, in order to estimate the range of release probabilities at the synapses in question. Our estimates are robust with respect to our assumptions regarding the range of quantal size, such that our conclusions would vary little if we were to assume a much larger range of q. The release probabilities seen at the synapses mediating recurrent excitation in layer 4 are striking, and seem to pertain even when only small numbers of release sites mediate the connections. The actual release probabilities are probably even higher than estimated, because it has been assumed that the CV is due entirely to variation in quantal content. In reality, however, the stochastic variation in channel opening (Sigworth, 1980) may also contribute to the variance of the postsynaptic response, because AMPA channels can have opening probabilities not of 1.0 but. nearer 0.7 (Hestrin, 1992; Silver et al., 1996) [see also Jack et al. (Jack et al., 1994)]. This contribution to overall variance will be all the greater at high release probabilities, when quantal content varies relatively little. The synapses from layer 6 to layer 4 excitatory neurons, under the same stimulation conditions, operate at lower release probabilities, with no overlap between the two populations. Smetters and Zador (1996) concluded in their review of available literature that, ‘In the cortex, individual synapses seem to be extremely unreliable: the probability of transmitter release in response to a single action potential can be as low as 0.1 or lower’ (Smetters and Zador, 1996). Similarly, in hippocampal pyramidal cells probabilities in the range 0.19–0.37 are considered to be high (Hessler et al., 1993; Huang and Stevens, 1997). Our quantitative estimates indicate that the excitatory synapses in layer 4 of cat visual cortex have release probabilities that are out of this range and we have had to scale our qualitative descriptions accordingly. Thus, the release probability for layer 6 pyramidal cell synapses in layer 4 is moderately high (0.37–0.56) and is very high (0.69–0.98) for layer 4 cell synapses. The thalamic synapses also fall in the very high range (Stratford et al., 1996). It is clear that the synaptic transmission involved in the first stage of processing in the cat is much more secure than that reported in the rat. Short-term Synaptic Plasticity It has been suggested that the release probability determines the degree of short-term synaptic plasticity that may be effected. The reasoning is that a low initial release probability results in little depletion of putative synaptic resources, and thus less depression with repeated stimulation (Tsodyks and Markram, 1997) [see also Korn and Faber (Korn and Faber, 1987), Thomson and West (Thomson and West, 1993) and Thomson et al. (Thomson et al., 1993a)], perhaps even unmasking facilitation. For a given synaptic connection this principle may operate, since we consistently observed that the factors that seemingly inf luenced the first pulse release probability (e.g. trial repeat rate), also changed the relative magnitude of depression on the second pulse. It is also true that the population of synapses showing facilitation was that with lower initial release probabilities. However, synaptic connections between layer 4 cells do not, on average, show marked depression, despite very high starting release probabilities. Furthermore, there is diversity even within this population, with some connections showing a greater tendency to depress than do others. This indicates that factors other than resource depletion must vary between synapses and contribute to net paired-pulse behaviour. In investigating short-term synaptic plasticity in our two populations of synaptic connections, we studied paired-pulse changes in CV and mean. In normalized plots of 1/CV2 against mean, trajectories above the diagonal do not exclude changes in quantal size, e.g. from postsynaptic A MPA receptor desensitization (Trussell and Fischbach, 1989; Colquhoun et al., 1992; Hestrin, 1992). However, in the absence of knowledge of the precise hyperbolic trajectory for pure probability change, only trajectories with slope less than the diagonal necessarily involve changes in quantal size. For both depression at synapses between layer 4 cells and facilitation at layer 6 to layer 4 synapses, it is mainly modifications of presynaptic release probability that make the largest contribution to the dynamic behaviour of the synapses. This mechanism allows rapid modulation of synaptic efficacy for a given synaptic connection.. Cerebral Cortex Dec 1999, V 9 N 8 841.
(10) gratefully acknowledge the support of the Wellcome Trust Programme Grant to J.J.B.J., A.U. Larkman and K.J.S.; K.T.-H. was also the recipient of a Wellcome Trust prize studentship. K.A.C.M. was supported by the Swiss National Science Fund SPP. Address correspondence to K.A.C. Martin, Institute of Neuroinformatics, University/ETH Zurich, Winterthurerstrasse 190, 8057 Zurich, Switzerland. Email: [email protected].. References. Figure 8. Schematic representation of variation of synaptic strengths with time in cortical network. Change in arrow size over time represents qualitative change in synaptic strength. Arrow sizes are not intended for comparison between different synaptic connections. SS, spiny stellate cell; L6, layer 6; LGN, lateral geniculate nucleus; IN, inhibitory interneuron in layer 4. Note that arrows represent synaptic strength only and do not take into account presynaptic activity, which together with synaptic strength will determine the amount of synaptic input to the postsynaptic cell from a given source.. Relevance of Synaptic Dynamics to In Vivo Circuits Benevento et al. wrote: ‘it should be realized that excitatory interaction between cortical neurons may play a role in cortical organization. . . . This excitatory intracortical interaction could be viewed as modulating the intracortical inhibition which shapes the suprathreshold trigger feature properties of cortical neurons’ (Benevento et al., 1972). We now understand that there are many factors that govern this interaction between inhibition and excitation. The characteristic strength and reliability of different synaptic connections, as well as their dynamic properties, must be included in consideration of how a given cortical cell is inf luenced by the stimulus-evoked patterns of discharge observed in vivo in the different neuronal populations constituting the cortical network. Dynamic synapses transmit different aspects of presynaptic activity depending on the pattern of activity and synaptic parameters (Markram et al., 1998; Tsodyks et al., 1998). Dynamic synaptic behaviour also implies that the balance of ‘weights’ of converging inputs shifts with time. The temporal properties of the connections discussed here, along with those of interactions involving inhibitory neurons in layer 4 (Tarczy-Hornoch et al., 1998) and LGN inputs (Stratford et al., 1996), are represented schematically in Figure 8. Our findings imply that even if the receptive field characteristics of converging layer 6 cells are identical to those of converging neighbouring layer 4 cells, the responses of a given spiny stellate simple cell should evolve with time. We might also expect that the time-course of the in vivo firing output of a layer 4 neuron, which receives diminishing layer 4 and LGN excitation as a result of synaptic depression at these synapses, would ref lect transformation (by diminishing synaptic weights) of the symmetrical time-course of LGN input. In fact, however, the post-stimulus time histograms of layer 4 cells retain a symmetrical response to moving bars. Is this because of simultaneous facilitation of the input from layer 6, or because of diminishing inhibition as the efficacy of the input from layer 4 smooth cells diminishes? Recording from pairs or even triplets of connected neurons cannot answer these kinds of questions about the behaviour of networks of neurons. Such recordings do, however, provide insights into the synaptic mechanisms available for cortical computation in vivo. They are important for highlighting significant new areas for investigation in vivo and for providing important constraints on theoretical models of the functional role of dynamic synapses.. Notes We thank John Anderson and Tom Binzegger for reconstructions. We. 842 Intracortical Excitation of Layer 4 • Tarczy-Hornoch et al.. Abbott LF, Varela JA, Sen K, Nelson SB (1997) Synaptic depression and cortical gain control. Science 275:220–224. A hmed B, Anderson JC, Douglas RJ, Martin K AC, Nelson JC (1994) Polyneuronal innervation of spiny stellate neurons in cat visual cortex. J Comp Neurol 341:39–49. A hmed B, Allison JC, Douglas RJ, Martin K AC (1997) An intracellular study of the contrast-dependence of neuronal activity in cat visual cortex. J Physiol 347:713–739. Anderson JC, Douglas RC, Martin K AC, Nelson JC (1994) Synaptic output of physiologically identified spiny stellate neurons in cat visual cortex. J Comp Neurol 341:16–24. Benevento LA, Creutzfeldt OD, Kuhnt U (1972) Significance of intracortical inhibition in the visual cortex. Nature 238:124–126. Ben-Yishai R, Bar-Or RL, Sompolinsky H (1995) Theory of orientation tuning in visual cortex. Proc Natl Acad Sci USA 92:3844–3848. Bishop GH, Clare MH, Landau WM (1961) The equivalence of recruiting and augementing phenomena in the visual cortex of the cat. Electroenceph Clin Neurophysiol 13: 34–42. Braitenberg V, Schuz A (1991) Anatomy of the cortex. Berlin: Springer-Verlag. Buhl EH, Tamas G, Szilagyi T, Stricker C, Paulsen O, Somogyi P (1997) Effect, number and location of synapses made by single pyramidal cells into aspiny interneurones of cat visual cortex. J Physiol 500:689–713. Chance FS, Nelson SB, Abbott LF (1998) Synaptic depression and the temporal response characteristics of V1 cells. J Neurosci 18: 4785–4799. Colquhoun D, Jonas P, Sakmann B (1992) Action of brief pulses of glutamate on A MPA/kainate receptors in patches from different neurones of rat hippocampal slices. J Physiol 458:261–287. Dempsey EW, Morison RS (1943) The electrical activity of a thalmocortical relay system. Am J Physiol 138:283–296. Douglas RJ, Martin K AC (1991) A functional microcircuit for cat visual cortex. J Physiol 440:735–769. Douglas RJ, Martin K AC, Whitteridge D (1989) A canonical microcircuit for neocortex. Neural Comput 1:480–488. Douglas RJ, Koch C, Mahowald M, Martin K AC, Suarez HH (1995) Recurrent excitation in neocortical circuits. Science 269:981–984. Ferster D, Lindström S (1985a) Augmenting responses evoked in area 17 of the cat by intracortical axon collaterals of cortico-geniculate cells. J Physiol 367:217–232. Ferster D, Lindström S (1985b) Synaptic excitation of neurones in area 17 of the cat by intracortical axon collaterals of cortico-geniculate cells. J Physiol 367:233–252. Galarreta M, Hestrin S (1998) Frequency-dependent synaptic depression and the balance of excitation and inhibition in the neocortex. Nature Neurosci 1:587–594. Gilbert CD, Wiesel TN (1979) Morphology and intracortical projections of functionally characterised neurones in the cat visual cortex. Nature 280:120–125. Grossman RG, Clark K, Whiteside L (1967) The inf luence of thalamis stimulation parameters on primary and augmenting cortical intracellular potentials. Brain Res 5:273–288. Hessler NA, Shirke AM, Malinow R (1993) The probability of transmitter release at a mammalian synapse. Nature 366:569–572. Hestrin S (1992) Activation and desensitization of glutamate-activated channels mediating fast excitator y currents in the visual cortex. Neuron 9:991–999. Huang EP, Stevens CF (1997) Estimating the distribution of synaptic reliabilities. J Neurophysiol 78:2870–2880. Jack JJB, Noble D, Tsien RW (1975) Electric current f low in excitable cells. Oxford: Clarendon Press. Jack JJB, Kullmann DM, Larkman AU, Major G, Stratford KJ (1990) Quantal analysis of excitatory synaptic mechanisms in the mammalian.
(11) central ner vous system. Cold Spring Harbor Symp Quant Biol 55:57–67. Jack JJB, Larkman AU, Major G, Stratford KJ (1994) Quantal analysis of the synaptic excitation of CA1 hippocampal pyramidal cells. In: Molecular and cellular mechanisms of neurotransmitter release (Stjarne L, Greengard P, Grillner S, Hokfelt T, Ottoson D, eds), pp. 275–299. New York: Raven Press. Katz LC (1987) Local circuitry of identified projection neurons in cat visual cortex brain slices. J. Neurosci. 7:1223–1249. Korn H, Faber DS (1987) Regulation and significance of probabilistic release mechanisms at central synapses. In: Synaptic function (Edelman GM, Gall WE, Cowan WM, eds), pp. 57–108. New York: Wiley. Larkman A, Stratford K, Jack J (1991) Quantal analysis of excitator y synaptic action and depression in hippocampal synapses. Nature 350:344–347. Larkman A, Jack JJB, Stratford KJ (1997) Quantal analysis of excitatory synapses in rat hippocampal CA1 in vitro during low frequency depression. J Physiol 505:457–471. Lund JS, Henry GH, Macqueen CL, Har vey A R (1979) Anatomical organization of the primar y visual cortex (area 17) of the cat. A comparison with area 17 of the macaque monkey. J Comp Neurol 184:599–618. Malinow R, Tsien R (1990) Presynaptic enhancement shown by whole-cell recordings of long-term potentiation in hippocampal slices. Nature 346:177–180. Markram H, Tsodyks MV (1996) Redistribution of synaptic efficacy between neocortical pyramidal neurons. Nature 382:807–810. Markram H, Wang Y, Tsodyks M (1998) Differential signalling via the same axon of neocortical pyramidal neurons. Proc Natl Acad Sci USA 95:5323–5328. Martin K AC (1988) The Wellcome Prize Lecture — From single cells to simple circuits in the cerebral cortex. Quart J Exp Physiol 73: 637–702. Martin K AC, Whitteridge D (1984) Form, function and intracortical projections of spiny neurones in the striate visual cortex of the cat. J Physiol 353:463–504. Mason A, Nicoll A, Stratford K (1991) Synaptic transmission between individual pyramidal neurons of the rat visual cortex in vitro. J Neurosci 11:72–84. McGuire BA, Hornung JP, Gilbert CD, Wiesel TN (1984) Patterns of synaptic input to layer 4 of cat striate cortex. J Neurosci 4:3021–3033. Morin D, Steriade M (1981) Development from primary to augmenting responses in the somatosensory system. Brain Res 205:49–66. Morison RS, Dempsey EW (1943) Mechanism of thalmocortical augmentation and repetition. Am J Physiol 138:297–308. Peters A, Payne BR (1993) Numerical relationships between geniculocortical afferents and pyramidal cell modules in cat primary visual cortex. Cereb Cortex 3:69–78. Redman S (1990) Quantal analysis of synaptic potentials in neurons of the central nervous system. Physiol Rev 70:165–198. Reyes A, Lujan R, Rozov A, Burnashev N, Somogyi P, Sakmann B (1998). Target-cell-specific facilitation and depression in neocortical circuits. Nature Neurosci 1:279–285. Sigworth FJ (1980) The variance of sodium current f luctuations at the node of Ranvier. J Physiol 307:97–129. Sasaki K, Staunton HP, Dieckmann G. (1970) Characteristic features of augmenting and recruiting responses in the cerebral cortex. Exp Neurol 26:369–392. Silver R A, Cull-Candy SG, Takahashi T (1996) Non-NMDA glutamate receptor occupancy and open probability at a rat cerebellar synapse with single and multiple release sites. J Physiol 494:231–250. Smetters DKS, Zador A (1996) Noisy synapses and noisy neurons. Curr Biol 6:1217–1218. Somers DC, Nelson SB, Sur M (1995) An emergent model of orientation selectivity in cat visual cortical simple cells. J Neurosci 15:5448–5465. Spencer WA, Brookhart JM, (1961) Electrical patterns of augmenting and recruiting waves in the depths of sensorimotor cortex of the cat. J Neurophysiol 24:26–49. Stratford KJ, Tarczy-Hornoch K, Martin K AC, Bannister NJ, Jack JJB (1996) Excitatory synaptic inputs to spiny stellate cells in cat visual cortex. Nature 382:258–261. Tarczy-Hornoch K, Martin KAC, Jack JJB, Stratford KJ (1998) Synaptic interactions between smooth and spiny neurones in layer 4 of cat visual cortex in vitro. J Physiol 508:351–363. Thomson A (1997) Activity-dependent properties of synaptic transmission at two classes of connections made by rat neocortical pyramidal axons in vitro. J Physiol 50:131–147. Thomson A M, West DC (1993) Fluctuations in pyramid-pyramid excitatory postsynaptic potentials modified by presynaptic firing pattern and postsynaptic membrane potential using paired intracellular recordings in rat neocortex. Neuroscience 54:329–346. Thomson AM, Deuchars J, West DC (1993a) Large, deep layer pyramid– pyramid single axon EPSPs in slices of rat motor cortex display paired pulse and frequency-dependent depression, mediated presynaptically and self-facilitation, mediated postsynaptically. J Neurophysiol 70: 2354–2369. Thomson AM, Deuchars J, West DC (1993b) Single axon excitatory postsynaptic potentials in neocortical interneurons exhibit pronounced paired pulse facilitation. Neuroscience 54:347–360. Tsodyks MV, Markram H (1997) the neural code bewtween neocortical pyramidal neurons depends on neurotransmitter release probability. Proc Natl Acad Sci USA 94:710–723. Tsodyks M, Pawelzik K, Markram H (1998) Neural networks with dynamic synapses. Neural Comput 10:821–835. Trussell LO, Fischbach GD (1989) Glutamate receptor desensitization and its role in synaptic transmission. Neuron 3:209–218. Varela JA, Sen K, Gibson J, Fost J, Abbott LF, Nelson SB (1997) A quantitative description of short-term plasticity at excitatory synapses in layer 2/3 of rat primar y visual cortex. J Neurosci 17:7926–7940. Varela JA, Sen S, Turrigiano GS, Nelson SB (1999). Differential depression at excitator y and inhibitor y synapses in visual cortex. J Neurosci 19:4293–4304.. Cerebral Cortex Dec 1999, V 9 N 8 843.
(12)
Figure
+3
Documents relatifs
