EPIDEMIOLOGY
Perception of the Amount of Drinking by Others in A Sample of 20-Year-Old Men: The More I Think
You Drink, The More I Drink
Nicolas Bertholet *, Jacques Gaume , Mohamed Faouzi , Jean-Bernard Daeppen and Gerhard Gmel
Department of Community Medicine and Health, Alcohol treatment center, Lausanne University Hospital, Mont-Paisible 16, 1011 Lausanne, Switzerland *Corresponding author: E-mail: [email protected]
(Received 26 April 2010; in revised form 5 November 2010; accepted 6 November 2010)
Abstract — Background: The amount a person drinks can be influenced by their perception of drinking by others. Aim: We studied whether perception of the amount of drinking by others (same age and sex) is associated with one’s own current drinking, and the factors that are related to this perception. Methods: A random sample of drinkers (n = 404) from a census of 20-year-old Swiss men (n = 9686) estimated the percentage of others who drink more than they do. Using weekly alcohol consumption data of the census, we computed for each subject the percentage of individuals drinking more than they do. We compared the‘perceived’ to the ‘computed’ percentage and classified the drinkers as overestimating or not drinking by others. We compared the alcohol con-sumption of those who overestimated drinking by others to those who did not, using analyses of variance/covariance. We used logis-tic regression models to evaluate the impact of age, education level, occupation, living environment and family history of alcohol problems on estimations of drinking by others. Results: Among the 404 drinkers, the mean (SD) number of drinks/week was 7.95 (9.79); 45.5% overestimated drinking by others, while 35.2% underestimated it and 19.3% made an accurate estimation. The likeli-hood of overestimating increased as individual alcohol use increased. Those overestimating consumed more alcohol than those who did not; the adjusted mean number of drinks/week (SE) 11.45 (1.12) versus 4.50 (1.08), P < 0.0001. Except for current drinking, no other variables were significantly associated with overestimating. Conclusion: This study confirms prior findings within selective student populations. It sets the stage for preventive actions, such as normative feedback based on social norms theory.
INTRODUCTION
The perception of how much others drink has been the focus of various studies among students in the USA (Borsari and Carey, 1999,2001,2003;Carey et al., 2006a;Perkins et al., 2005) and other countries (New Zealand, UK, Canada and France; Borsari and Carey, 2001,2003;Carey et al., 2006a;
França et al., 2010;Kypri and Langley, 2003;McAlaney and McMahon, 2007; Werch et al., 2000). This research has demonstrated the high prevalence of overestimating (i.e. thinking that others drink more than they actually do). This overestimation, or misperception, has been identified as a strong predictor of one’s own drinking (McAlaney and McMahon, 2007;Perkins and Wechsler, 1996). According to social norms theory, our perceptions and beliefs of what is ‘normal’ behaviour by others will influence our own behav-iour (Berkowitz, 2005). For example, the belief that others drink heavily will have considerable influence on the amount a person drinks (Cunningham and Selby, 2007). The per-ceived prevalence of any given behaviour is known as descriptive norms; the difference between one’s current be-haviour and what one believes about the bebe-haviour of others is considered a ‘misperception’. Previous research among students has noted that misperceptions concerning overesti-mating the amount of drinking by others are associated with higher levels of alcohol consumption, and perceived social norms are a strong predictor of alcohol use by them (Kypri and Langley, 2003;McAlaney and McMahon, 2007;Perkins et al., 2005). Various interventions have been designed to address these misperceptions, and have had some success among college students (Carey et al., 2006b; Kypri et al., 2004;Walters et al., 2007). Alcohol use interventions should aim at correcting misperceptions by providing normative feedback on prevailing drinking norms. One hypothesis is that individuals with heavy alcohol use should decrease their
consumption by correcting the misperception. A Cochrane review listed evidence that normative feedback interventions for students have been effective in reducing the alcohol use (Moreira et al., 2009); brief interventions that include web-based interactive participation where normative feedback is provided have also had positive impacts on drinking and other alcohol-related outcomes (Moreira et al., 2009). Many of these interventions helped subjects narrow down the difference between perceived and actual behaviours of others (i.e. ‘correcting’ the misperceptions). The possibility that normative feedback may decrease misperceptions provides support for the theoretical rationale on which these interven-tions are based. (Berkowitz, 2005;Moreira et al., 2009).
General population studies also showed promising results when normative feedback is used, especially when embedded within web-based brief interventions (Cunningham et al., 2001,2009), yet most of the current literature is focused on USA, North American or English-speaking populations of college students. Estimating alcohol misperceptions in an entire population is of interest since factors such as living on campuses or being part of student activities may have an impact on perceptions. One could hypothesize that level of education, the college student ‘lifestyle’ or certain cultural aspects are associated with the misperception of the amount of drinking by others.
In Switzerland, or in other countries where there is a man-datory army conscription process, there is a unique opportu-nity to assess the health behaviours of young men at the population level and to conduct population-based preventive interventions. Understanding the factors influencing alcohol consumption in these settings is essential in developing tar-geted preventive interventions. The Swiss conscription process mandates that virtually all non-institutionalized young men attend a physical and psychological evaluation as part of the army recruitment, at least 6 months prior to actual
Alcohol and Alcoholism Vol. 46, No. 1, pp. 83–87, 2011 doi: 10.1093/alcalc/agq084
enrolment. Switzerland is divided into three main linguistic regions corresponding to the main national languages of French, German and Italian. All French-speaking males have to attend the same recruitment centre where the present study was conducted, offering an opportunity to study a census of these young Swiss men. In terms of drinking recommen-dations, Addiction Info Suisse published the following drink-ing guidelines: no more than 14 drinks per week and no more than 4 drinks per occasion (AddictionInfoSuisse, 2010). According to a Swiss federal survey (Enquête suisse sur la santé), 80.6% of men of this age group (20–24) are drinking at or below weekly recommendations (Office fédéral de la statistique, 2004).
We were, therefore, able to investigate the extent of mis-perceptions surrounding alcohol use in a random sub-sample of an entire population of 20-year-old French-speaking men in Switzerland. Factors associated with current drinking and misperceptions were assessed, with some focus on whether education or living environment influences differences in overestimating the amount of drinking by others.
METHODS
We conducted a survey among 20-year-old males attending the mandatory medical assessment portion of the Swiss army recruitment process. Subjects were informed that the study was not connected to the army, and that the military could not receive any information regarding the responses of any individual. Virtually all of the attendees were eligible to par-ticipate in the study, but only those giving their informed consent were accepted. Recruitment for the present study took place weekly during conscription between January 2007 and September 2008. The Ethics Committee for Clinical Research at the Lausanne University Medical School approved the research.
During the above period, 12,133 young men attended the Lausanne recruitment centre; of these, 1989 left before meeting with the research staff, 409 refused to participate in the study and 49 did not fully complete the questionnaire and were excluded. In all, 9686 (80%) of the conscripts com-pleted a brief self-administered screening questionnaire assessing alcohol and other drug use, containing questions on the frequency of drinking (How often do you have a drink containing alcohol? With possible answers: × days per week, 2–4 times a month, monthly or less, and never) and on the quantity of alcohol usually drunk per drinking day (How many drinks containing alcohol do you have on a typical day when you are drinking? With possible answers: × standard drinks). The following definition of a standard drink was used: 100 ml of wine; 250 ml of beer; 275 ml of premixed drink containing spirits; or 25 ml of spirits (each ~10 g of ethanol). A visual aid was provided to participants. Answers to these questions were combined to obtain weekly alcohol consumption. Data from the 9686 conscripts were used to compute the census norms. A random sample (n = 433) of men responded to the question about what percen-tage of people their age drink more than they do. This sample was random because it contained those individuals who were previously randomized for participation in a con-trolled trial of brief motivational interventions (BMI; no selec-tion based on reported alcohol use) and had completed
additional assessment questionnaires containing the perception item. The BMI was delivered after having filled out the ques-tionnaire, ensuring that questionnaire data were not biased by the BMI. Informed consent was already on file for those in the BMI trial. Individuals reporting no alcohol use were averaged into the overall computation of the census-based alcohol use estimates. However, to study a more homo-geneous group, subjects in the random sample that provided drinking perceptions but did not use alcohol in the past 6 months were dropped from further analyses. When asked what percentage of people their age drink more than they do, non-drinkers judge the prevalence of drinking in the popu-lation without any reference to the amount of alcohol drunk by others. Therefore, we chose to focus analyses on drinkers (n = 405). One additional individual was excluded since he did not respond to the perception question. This left 404 sub-jects with complete and usable data in the study sample. It is important to remember that this sample was indeed random and was not based on consumption reported in the screening questionnaire.
To determine for each person the proportion of persons in the census who drank more alcohol than that individual did, the weekly alcohol consumption (in standard drinks) of each of the 404 subjects was compared with the weekly alcohol consumption of each of the 9686 conscripts. The proportion of the sample that reported higher, lower or similar alcohol consumption was determined for each subject. The pro-portion of subjects in the census drinking more than a given subject in the sample was compared with the perceived pro-portion reported by each of the 404 subjects of the sample. The prevalence of overestimation, underestimation and accu-rate estimation of the amount of drinking by others was com-puted in the total sample, and in subgroups defined by weekly drinking categories (less than one, 1–2, 3–7, 8–14, 15–21 and 22 or more drinks). An accurate estimation was considered a perceived proportion within the ±5% range of the computed proportion.
Linear models (Analysis of variance and covariance, SAS, Proc GLM) were used to compare mean alcohol consump-tion between subjects who did or did not overestimate the amount of drinking by others. Potential confounders, such as socio-demographic environment and education level, were tested.
Logistic regression models were used to assess the deter-minants of the overestimation of drinking by others. In addition to individual alcohol consumption (drinks per week), the following variables were tested to determine the impact of education and socio-demographic characteristics on the overestimation: highest completed education level (obligatory school/higher); current occupation (employed/in training/inactive); living environment (urban/countryside); and personal characteristics (age and family history of alcohol problems). A multivariable model, including all the aforementioned variables in the same logistic regression model, was also used. Analyses were performed using SAS software (Version 9.1, SAS Institute Inc., Cary, NC, USA).
RESULTS
Table 1 displays the characteristics of the 404 subjects. The mean (SD) age was 19.4 (1.04) and the mean (SD) weekly
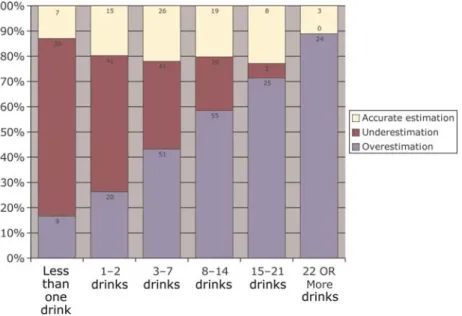
alcohol use (drinks per week) was 7.95 (9.79). Among the subjects, when the differences between the perceived pro-portion of individuals who drink more than them and the actual proportion was calculated from the census data, 45.5% of them overestimated, 35.2% underestimated and 19.3% accurately estimated. The prevalence of over, under and accurate estimation of the amount of drinking by others by subgroups according to weekly alcohol use is presented in Fig. 1. Overestimation of the amount of drinking by others increased as the self-reported weekly alcohol use increased.
Subjects who overestimated reported significantly more amount of drinking (mean number of drinks per week) (F = 57.52, P < 0.0001) than those who did not. The difference in the mean number of drinks per week remained significant (F = 56.61, P < 0.0001) even after adjustment for socio-demographic variables (age, education level, occupation and living environment). The adjusted means (SE) were 11.45 (1.12) drinks per week for subjects who overestimated, and 4.50 (1.08) drinks per week for those who did not.
To assess the impact of socio-demographic characteristics on overestimating, age, education level, occupation, living environment and family history of alcohol problems were each tested in a separate regression model. Except for
individual alcohol use, none of the other variables was sig-nificantly associated with overestimation. The single and the multivariable logistic regression models are presented in Table2.
DISCUSSION
We surveyed perceptions (estimates) of the amount of drink-ing by others (same sex and age) in a sample of 20-year-old males as they attended the mandatory Swiss army recruit-ment and found a high prevalence of overestimating the amount of drinking by others. This overestimation was associated with significantly more own drinking, by them-selves even after adjusting for socio-demographic variables.
Our results are consistent with other studies conducted among college students, notably in North America but also in the UK, where a significant proportion of the subjects reported similar drinking misperceptions (Borsari and Carey, 2001; Lewis and Neighbors, 2006; McAlaney and McMahon, 2007;Perkins, 2007). Our results are also consist-ent with previous research showing an association between misperception and own drinking (Kypri and Langley, 2003;
McAlaney and McMahon, 2007;McNally and Palfai, 2003;
Perkins et al., 2005).
In our sample of 20-year-old Swiss males, the overestima-tion of the amount of drinking by others is not influenced by factors such as education, occupation, living environment or family history of alcohol problems. Individuals who drink the most tend to overestimate the amount of drinking by others, regardless of their education level, occupation or living environment.
One finding of interest is that approximately a third of the subjects underestimated the amount of drinking by others. The evolution over time of the perception of the amount of Table 1. Characteristics of included subjects (n = 404)
Age in years, mean (SD) 19.40 (1.04)
Living in an urban environment, % (n) 51.49 (208) Highest completed education level: obligatory school only
versus higher, % (n) 43.32 (175) Current occupation Employed, % (n) 23.02 (93) In training, % (n) 74.01 (299) Inactive, % (n) 2.97 (12)
Current alcohol use in drinks per week, mean (SD) 7.95 (9.79) No family history of alcohol problems (versus yes), % (n) 68.41 (275)
Fig. 1. Proportion of subjects overestimating, underestimating and accurately estimating the amount of drinking by others by current weekly drinking (in drinks per week). Note: subjects in the random sample were asked to estimate what proportion of people their age and sex drink more than them. This perception was then compared with the weekly consumption of the census. Subjects were considered overestimating the amount of drinking by others when they thought that more people drink more than them, compared with the census data estimates. An accurate estimation was considered a perceived proportion
drinking by others outside of intervention studies targeting these perceptions should be the focus of future research to determine whether these perceptions (and especially the underestimation of the amount of drinking by others) and changes in perception are associated with changes in drinking.
Explaining overestimating
Social norms theory states that people’s behaviour is influ-enced by their perception of the behaviour of others and that people tend to exaggerate the negative health behaviour of others (such as smoking or drinking). It states that if an vidual perceives heavy alcohol drinking as typical, that indi-vidual is more likely to engage in heavy drinking. As such, perceptions of others’ behaviour play a role on how one adopts or does not a given behaviour. Explanations for the overestimation of the amount of drinking by others include the construction of perceptions on limited information: one usually does not precisely know the habits of others, and problematic behaviours tend to get most of the attention, thus giving them an inaccurate sense of what is the norm. Alternative explanations for the overestimation of the amount of drinking by others may include the fact that individuals may tend to select friends and peers according to their pre-ferences or to the behaviour of family members (including drinking) and therefore spend time with individuals drinking similar or larger amounts of alcohol than themselves. Even though we were not able to assess the behaviour of close peers, we were able to show that a family history of alcohol problems, occupation and living environment were not associated with overestimation of the amount of drinking by others. Overestimation may also be seen as a way to continue freely adopting a given behaviour with the impression that
the given behaviour is normal. Our results are consistent with social norms theory and we retain as a primary expla-nation that, according to social norms theory, it is the percep-tion itself that impacts the current behaviour, which implies that individuals overestimating the amount of drinking by others are more likely to drink more.
Limitations of this study
The present study has several limitations. First, it is cross-sectional in nature and we were not able to observe the impact of potential changes in perceptions or the influence of perceptions on the evolution of alcohol use over time. Secondly, only descriptive norms were assessed, and inter-personal perception was limited to those of the same age and sex as the subject. Perception of the amount of drinking by others in more proximal groups (such as close friends) was not evaluated. The large number of subjects screened (over 9000) precludes gathering with a brief survey questionnaire the kind of detailed data that could be obtained during, for example, face-to-face structured interviews. Nevertheless, we were able to compare the random sub-sample with the larger census from which it was drawn. Thirdly, this is a subset analysis embedded within a large survey of military con-scripts and did not include women or non-Swiss residents.
Our research sample is representative only of
French-speaking, young Swiss males. Fourthly, given that 20% did not respond to the survey (mostly because they left the centre before meeting with the research staff ), we cannot be certain regarding the accuracy of the population level measurement of alcohol consumption.
Our study has notable strengths. We were able to compare individual perceptions of the amount of drinking by others with actual reported amount of drinking in the larger census sample. Our sample consisted of subjects from a total popu-lation of young men; they were not all students, unlike many of the other perceived drinking studies. This allowed us to control for some of the potential biases created by the differ-ences between drinking and living in the college milieu versus those found in a less selective environment. Comparisons within our subsample of drinkers should gener-alize to the overall census from which the subjects were ran-domly selected, since they were all surveyed during the same period, and in the same facility with the same research staff.
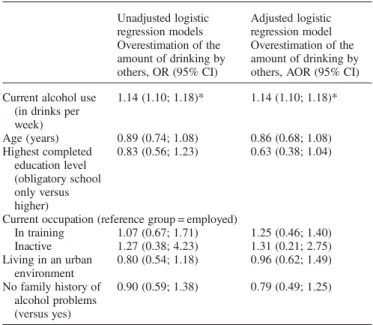
In conclusion, misperceptions surrounding the amount of drinking by others ( particularly the strong tendency towards overestimation) is prevalent among 20-year-old Swiss men. There is a strong link between own amount of drinking and estimating the amount of drinking by others, which is inde-pendent of several other common factors in the population. Preventive approaches designed to help individuals reduce their alcohol consumption might incorporate the use of nor-mative feedback, to counteract the misperceptions that might ‘encourage’ individuals to justify their own use of alcohol. Further research is needed in this population to assess whether interventions aimed at reducing misperceptions result in reduced drinking. The present research makes a strong case for agreeing with the notion that ‘the more one thinks someone else drinks, the more they (themselves) drink’. The phenomenon of overestimating the amount of drinking by others appears in the general population, as well Table 2. Determinants of the overestimation of the amount of drinking by
others Unadjusted logistic regression models Adjusted logistic regression model Overestimation of the amount of drinking by others, OR (95% CI) Overestimation of the amount of drinking by others, AOR (95% CI) Current alcohol use
(in drinks per week) 1.14 (1.10; 1.18)* 1.14 (1.10; 1.18)* Age (years) 0.89 (0.74; 1.08) 0.86 (0.68; 1.08) Highest completed education level (obligatory school only versus higher) 0.83 (0.56; 1.23) 0.63 (0.38; 1.04)
Current occupation (reference group = employed)
In training 1.07 (0.67; 1.71) 1.25 (0.46; 1.40) Inactive 1.27 (0.38; 4.23) 1.31 (0.21; 2.75) Living in an urban environment 0.80 (0.54; 1.18) 0.96 (0.62; 1.49) No family history of alcohol problems (versus yes) 0.90 (0.59; 1.38) 0.79 (0.49; 1.25)
The probability modelled is the presence of overestimation of the amount of drinking by others. Hosmer–Lemeshow test for the adjusted model: χ2= 12.12; P = 0.15, indicating satisfactory model fit.
OR, odds ratio; AOR, adjusted odds ratio; 95% CI, 95% confidence interval. *P < 0.0001.
as among students; thus preventive measures should be tar-geting a broader segment of the population.
Funding— The study was funded by the Swiss Foundation for Alcohol Research.
REFERENCES
Addiction Info Suisse (2010) Alcool et santé. Addiction Info Suisse, Lausanne (available at: http://www.sucht-info.ch/ fileadmin/user_upload/DocUpload/Alcool_sante.pdf).
Berkowitz AD. (2005) An overview of the social norms approach. In Lederman L, Stewart L (eds). Changing the Culture of College Drinking: A Socially Situated Health Communication Campaign. Creskill, NJ: Hampton Press.
Borsari BE, Carey KB. (1999) Understanding fraternity drinking: five recurring themes in the literature. 1980–1998. J Am Coll Health 48:30–7.
Borsari B, Carey KB. (2001) Peer influences on college drinking: a review of the research. J Subst Abuse 13:391–424.
Borsari B, Carey KB. (2003) Descriptive and injunctive norms in college drinking: a meta-analytic integration. J Stud Alcohol 64:331–41.
Carey KB, Borsari B, Carey MP et al. (2006a) Patterns and impor-tance of self-other differences in college drinking norms. Psychol Addict Behav 20:385–93.
Carey KB, Carey MP, Maisto SA et al. (2006b) Brief motivational intervention for heavy college drinkers: a randomized controlled trial. J Consult Clin Psychol 74:943–54.
Cunningham JA, Selby PL. (2007) Implications of the normative fallacy in young adult smokers aged 19–24 years. Am J Public Health 97:1399–1400.
Cunningham JA, Wild TC, Bondy SJ et al. (2001) Impact of nor-mative feedback on problem drinkers: a small-area population study. J Stud Alcohol 62:228–33.
Cunningham J, Wild TC, Cordingley J et al. (2009) A randomized controlled trial of an internet-based brief intervention for alcohol abusers. Addiction 12:2023–32.
França LR, Dautzenberg B, Reynaud M. (2010) Heavy episodic drinking and alcohol consumption in French colleges: the role of perceived social norms. Alcohol Clin Exp Res 34:1–11. Kypri K, Langley JD. (2003) Perceived social norms and their
relation to university student drinking. J Stud Alcohol 64:8. Kypri K, Saunders JB, Williams SM et al. (2004) Web-based
screening and brief intervention for hazardous drinking: a double-blind randomized controlled trial. Addiction 99:1410–7. Lewis MA, Neighbors C. (2006) Social norms approaches using
descriptive drinking norms education: a review of the research on personalized normative feedback. J Am Coll Health 54:213–8.
McAlaney J, McMahon J. (2007) Normative beliefs, mispercep-tions, and heavy episodic drinking in a British student sample. J Stud Alcohol Drugs 68:385–92.
McNally AM, Palfai TP. (2003) Brief group alcohol interventions with college students: examining motivational components. J Drug Educ 33:159–76.
Moreira MT, Smith LA, Foxcroft D. (2009) Social norms interven-tions to reduce alcohol misuse in university or college students. Cochrane Database Syst Rev 3:17–37.
Office fédéral de la statistique (2004) Enquête Suisse sur la Santé 2002. Neuchâtel: Office fédéral de la statistique.
Perkins HW. (2007) Misperception of peer drinking norms in Canada: another look at the‘reign of error’ and its consequences among college students. Addict Behav 32:2645–56.
Perkins HW, Wechsler H. (1996) Variation in perceived college drinking norms and its impact on alcohol abuse: a nationwide study. J Drug Issues 26:961–74.
Perkins HW, Haines MP, Rice R. (2005) Misperceiving the college drinking norm and related problems: a nationwide study of exposure to prevention information, perceived norms and student alcohol misuse. J Stud Alcohol 66: 470–8.
Walters ST, Vader AM, Harris TR. (2007) A controlled trial of web-based feedback for heavy drinking college students. Prev Sci 8:83–8.
Werch CE, Pappas DM, Carlson JM et al. (2000) Results of a social norm intervention to prevent binge drinking among first-year residential college students. J Am Coll Health 49:85–92.