RESEARCH
Characteristics and properties
of nano-LiCoO
2
synthesized by pre-organized
single source precursors: Li-ion diffusivity,
electrochemistry and biological assessment
Jean‑Pierre Brog
1, Aurélien Crochet
2, Joël Seydoux
1, Martin J. D. Clift
3, Benoît Baichette
1,
Sivarajakumar Maharajan
1, Hana Barosova
3, Pierre Brodard
4, Mariana Spodaryk
5, Andreas Züttel
5,
Barbara Rothen‑Rutishauser
3, Nam Hee Kwon
1*and Katharina M. Fromm
1*Abstract
Background: LiCoO2 is one of the most used cathode materials in Li‑ion batteries. Its conventional synthesis requires high temperature (>800 °C) and long heating time (>24 h) to obtain the micronscale rhombohedral layered high‑ temperature phase of LiCoO2 (HT‑LCO). Nanoscale HT‑LCO is of interest to improve the battery performance as the lithium (Li+) ion pathway is expected to be shorter in nanoparticles as compared to micron sized ones. Since batteries typically get recycled, the exposure to nanoparticles during this process needs to be evaluated.
Results: Several new single source precursors containing lithium (Li+) and cobalt (Co2+) ions, based on alkoxides and aryloxides have been structurally characterized and were thermally transformed into nanoscale HT‑LCO at 450 °C within few hours. The size of the nanoparticles depends on the precursor, determining the electrochemical perfor‑ mance. The Li‑ion diffusion coefficients of our LiCoO2 nanoparticles improved at least by a factor of 10 compared to commercial one, while showing good reversibility upon charging and discharging. The hazard of occupational expo‑ sure to nanoparticles during battery recycling was investigated with an in vitro multicellular lung model.
Conclusions: Our heterobimetallic single source precursors allow to dramatically reduce the production tem‑
perature and time for HT‑LCO. The obtained nanoparticles of LiCoO2 have faster kinetics for Li+ insertion/extraction compared to microparticles. Overall, nano‑sized LiCoO2 particles indicate a lower cytotoxic and (pro‑)inflammogenic potential in vitro compared to their micron‑sized counterparts. However, nanoparticles aggregate in air and behave partially like microparticles.
Keywords: Single source precursors, Nano‑LiCoO2, Li+ Diffusion coefficient, Li‑ion batteries, Nanoparticle hazard
© The Author(s) 2017. This article is distributed under the terms of the Creative Commons Attribution 4.0 International License (http://creativecommons.org/licenses/by/4.0/), which permits unrestricted use, distribution, and reproduction in any medium, provided you give appropriate credit to the original author(s) and the source, provide a link to the Creative Commons license, and indicate if changes were made. The Creative Commons Public Domain Dedication waiver (http://creativecommons.org/ publicdomain/zero/1.0/) applies to the data made available in this article, unless otherwise stated.
Background
Lithium cobalt oxide LiCoO2 has been the most
com-monly used cathode material in rechargeable Li-ion bat-teries since Goodenough first introduced the reversible reaction of Li-ions in the structure [1]. The structures of Li1−xCoO2 have been extensively studied as a function of
lithium de-intercalation, leading to several phase trans-formations from rhombohedral with 0.06 < x < 0.25 [2–
5], via monoclinic with x = 0.5 [2, 3], to hexagonal for 0.66 < x < 0.83 [6, 7], and a second hexagonal phase, O1, for 0.88 < x < 1 [6–8].
The layered structure of lithiated LiCoO2 exhibits two
crystal structures depending on the temperature during synthesis and the preparation method. LiCoO2 produced
at low temperature (~400 °C) (LT-LCO) has a cubic spi-nel structure with the space group Fd3 m [9, 10] while the phase synthesized at high temperature (>850 °C,
Open Access
*Correspondence: [email protected]; [email protected] 1 Department of Chemistry, University of Fribourg, Chemin du Musée 9, 1700 Fribourg, Switzerland
HT-LCO) has a rhombohedral layered structure [11]. LT-LCO shows a large hysteresis between the intercalation and de-intercalation of lithium ions [12–14], which is due to the mixing of Co3+ and Li+ in the structure, preventing
the formation of layered pathways for Li-ion diffusion. The material is therefore calcined at higher temperature to yield HT-LCO, which possesses alternating planes of Co3+ and Li+ cations in the hexagonal ABCABC oxygen
packing [15], providing superior electrochemical proper-ties in Li-ion batteries [16].
Industrially, two starting materials, typically Li2CO3
and Co3O4, are heated in a two-step process to yield
first at a temperature of <600 °C for 24 h under O2 the
LT-LCO. A second calcination step at 900 °C for >12 h under O2 [17] yields the HT-LCO [18–20]. Such a
pro-longed calcination process at high temperature causes however coarsening of the particles and evaporation of lithium [21]. Various synthetic methods have thus been investigated to avoid the high temperature process, with the aim to obtain the rhombohedral layered structure of HT-LCO, e.g. sol–gel [22–25], hydrothermal [26], or precipitation [16]. However, low temperature syntheses formed mostly the cubic spinel LT-LiCoO2, which is not
favorable for Li+ insertion/extraction. Thus, calcination
at high temperature >800 °C was always required in a sec-ond step to use the so-produced material in Li-ion bat-tery cathodes [16].
Another access to the layered structure of HT-LCO uses metal–organic single source precursors based on alkoxides or aryloxides, in which the metal ions are already preorganized. Indeed, the synthesis of heterobi-metallic alkoxides and/or aryloxides can provide a facile route for obtaining soluble, volatile, and generally mono-meric species, that can thus serve as valuable precursors for making metal oxides under rather mild conditions [27–36]. For example, Buzzeo published homoleptic cobalt phenolate compounds of the type K2[Co(OAr)4]
(OAr = OC6F5− or 3,5-OC6H3(CF3)2−), in which the effect
of fluorination of phenoxide on (K18C6)2[Co(OAr)4]
is highlighted [37]. Boyle et al. published lithium cobalt double aryloxide compounds obtained from LiN(SiMe3)2,
Co(N(SiMe3)2)2 in THF and subsequent addition of an
aryl alcohol. They obtained nanoparticles of LiCoO2 by
thin film formation [38], but did not characterize them electrochemically. Nanoparticles of HT-LCO have the advantage to offer shorter diffusion lengths for the Li-ions as compared to the commercial, micron-sized par-ticles from which only ~50% of Li-ions can be used [26,
35]. On the other hand, since batteries are typically also shredded upon recycling, the use of nanomaterials in bat-teries might present a certain danger, which requires a risk management for new materials.
In this context, we present here new molecular precur-sors using simple ligands such as phenoxide and alkox-ides with a low amount of carbon atoms that can produce nano-HT-LCO at quite low temperature. We have tested the new materials for their electrochemical properties in cathodes and their Li-ion diffusion coefficients were determined. In order to evaluate possible material haz-ards, the nanoparticles of HT-LCO were exposed directly at the air–liquid interface (ALI) using a well-established in vitro multicellular lung model [39]. The lung was cho-sen as an experimental tissue, since it can be considered by far the most important portal of entry for aerosolized nanoparticles into the human body [40–46]. Although various aspects of nanoparticles toxicity have already been described and studied in the recent literature, almost no studies were carried out in the domain of bat-tery cathode nanoparticles.
Methods
Materials and reagents
Cobalt chloride (CoCl2) (dry or hydrated with two H2O),
lithium phenoxide (LiOPh) in tetrahydrofuran (THF), lithium iso-propoxide (LiOiPr) in THF, ethanol (technical
grade and analytical grade), tetramethylethylenediamine (TMEDA), dioxane, dimethoxyethane (DME), pyridine (Py), heptane and micron-sized HT-LiCoO2 were
pur-chased from Sigma-Aldrich (Switzerland). Lithium tert-butoxide (LiOtBu) in THF, lithium methoxide (LiOMe) in
methanol, lithium ethoxide (LiOEt) in THF and THF (dry and over molecular sieves) were purchased from Acros Organics (Belgium). Deionized water was produced in house by double distillation.
Synthesis of bimetallic complexes [47]
All experiments were carried out under an inert argon atmosphere, using Schlenk techniques [48]. All solvents were bought dried and were stored over molecular sieve. The elemental analysis of the compounds turned out to be difficult to obtain due to the instability of most com-pounds in air, based on the loss of (coordinated) solvent.
The compounds [Co(OPh)4Li2(THF)4] (1), [Co(OPh)4Li2
(THF)4]·THF (2), [Co(OPh)4Li2(THF)2(H2O)(THF)2]2 (3),
[Co(OPh)4Li2(TMEDA)2] (4), [Co(OPh)4Li2(dioxane)2]n
(5), [Co(OPh)4Li2(DME)2] (6), [Co(OPh)4Li2(Py)4] (7),
[Co2(OtBu)6Li4(THF)2] (8), [Co2(OtBu)2(OPh)4Li2(THF)4]
(9), [Co2(OiPr)6Li2(THF)2] (10), [Co2(OEt)12Li8(THF)8–10]
(11), and [Co2(OMe)6Li2(THF)2(MeOH)2] (12) were
syn-thesized using CoCl2 as starting material and reacting
it with the corresponding lithium aryloxide or alkox-ide. In a typical reaction procedure, dried CoCl2 is
dis-solved in dry THF under heating to reflux. After stirring for 30 min, aliquots of LiOR (R = Ph, tBu, iPr, Et, Me)
are added. The mixture is heated to reflux, stirred dur-ing 30 min and then concentrated. Layerdur-ing the concen-trated solution with a non-solvent, respectively solvent exchange lead to single crystalline material for com-pounds 1–5 and 9, while powders were obtained for 6–8 and 10–12. Table 1 resumes the reaction conditions for all compounds, with detailed synthesis protocols and IR-analyses given in the Additional file 1: Text 1.
Calcination to LiCoO2
Among the so obtained precursors, compounds 1, 8–12 were heated up to 450 °C for 1 h and 500 °C for 2 h at an average rate of 18 °C/min under an air flow of 8 l/min in a muffle furnace equipped with an evacuation smoke-stack for combustion gases. The black powder obtained was then cooled to room temperature within 5 min in air. The black/grey powder was next washed by centrifuga-tion three times with water and two times with ethanol in order to remove LiCl. The clean and dry oxide nanopow-der was finally annealed using an average ramp of 17 °C/ min up to 600 °C for 80 min to remove low temperature oxide phase impurities. These materials were used for the biohazard tests. LiCoO2 prepared with LiOMe and
LiOtBu was calcined further until 700 °C for 30 min to
measure charge/discharge capacities at different current densities.
Characterization
Single crystal X‑ray structures
Single crystals of compounds 1–5 and 9 were mounted on a loop and all geometric and intensity data were taken from these crystals. Data collection using Mo-Kα1
radiation (λ = 0.71073 Å) was performed at 150 K on a STOE IPDS-II diffractometer equipped with an Oxford
Cryosystem open flow cryostat [49]. Absorption correc-tion was partially integrated in the data reduccorrec-tion pro-cedure [50]. The structure was solved by SIR 2004 and refined using full-matrix least-squares on F2 with the
SHELX-97 package [51, 52]. All heavy atoms could be refined anisotropically. Hydrogen atoms were introduced as fixed contributors when a residual electronic density was observed near their expected positions. Diffraction data sets for compounds 1–5 are unfortunately incom-plete due to decomposition of the single crystals, result-ing in poor data sets and R-values for the compounds. However, the isotropic attribution of heavy atoms is unambiguous.
Crystallographic data (excluding structure factors) for the structures in this paper have been deposited with the Cambridge Crystallographic Data Center, 12 Union Road, Cambridge CB21EZ, UK. Copies of the data can be obtained on quoting the depositing numbers CCDC- 1527018 (1), 1527022 (2), 1527023 (3), 1527020 (4), 1527019 (5), and 1527021 (9) (Fax: +44-1223-336-033; E-mail: [email protected]). Important crystal data for these compounds are given in the Additional file 1: Table S1.
Other characterizations
For powder XRD measurements, a Stoe IPDS II theta,
equipped with monochromated Mo-Kα1 radiation
(0.71073 Å) was used in order to avoid X-ray fluores-cence of the cobalt but also a Stoe STADIP, equipped with monochromated Cu-Kα1 radiation (1.540598 Å)
and Mythen detector. TGA was recorded on a Mettler Toledo TGA/SDTA851e in closed aluminium crucibles with a pin hole. Specific surface area was measured on a Micromeritics Gemini V series BET with a pre-treatment
Table 1 The reactants, synthetic conditions and the yields of the compounds 1, 8-12
Compound Formula Reactants in synthesis Yields (%) 1 [Co(OPh)4Li2(THF)4] CoCl2 (0.1 g, 0.77 mmol) + 4 LiOPh 1 M in THF (3.1 ml, 3.1 mmol) 82
2 [Co(OPh)4Li2(THF)4]·THF Idem as 1, but −24 °C under argon 56
3 [Co(OPh)4Li2(THF)2(H2O)
(THF)2]2 Idem as 1, but −24 °C in air <10
4 [Co(OPh)4Li2(TMEDA)2] Idem as 1, recrystallized from TMEDA 69
5 [Co(OPh)4Li2(dioxane)2]n Idem as 1, recrystallized from dioxane 95
6 [Co(OPh)4Li2(DME)2] Idem as 1, recrystallized from DME 47
7 [Co(OPh)4Li2(Py)4] Idem as 1, recrystallized from pyridine 39
8 [Co2(OtBu)6Li4(THF)2] CoCl2 (585 mg, 4.5 mmol) + 3 LiOtBu 1 M in THF 13.5 ml (13.5 mmol) 87
9 [Co2(OtBu)2(OPh)4Li2(THF)4] CoCl2 (500 mg, 3.85 mmol) + LiOtBu (3.9 ml, 3.9 mmol) + LiOPh 1 M in THF (7.7 ml,
7.7 mmol) 85
10 [Co2(OiPr)6Li2(THF)2] CoCl2 (500 mg, 3.85 mmol) + 3 LiOiPr 2 M in THF (5.8 ml, 11.6 mmol) 92
11 [Co2(OEt)12Li8 (THF)8‑10] CoCl2 (500 mg, 3.85 mmol) + 6 LiOEt 2 M in THF (11.6 ml, 23.2 mmol) 89
under vacuum at 150 °C for one night. SEM images were recorded on Phenom Desktop SEM and a FEI XL 30 Sirion FEG with Secondary Electron and EDS Energy Dispersive Spectrometer detectors. SEM samples were prepared by spraying them on a carbon tape glued on a SEM holder to reproduce the spraying in the exposure chamber. All images were obtained without sputter coat-ing pretreatment. TEM images were recorded on a FEI/ Philips CM-100 Biotwin. Raman spectra were recorded with a confocal micro-Raman spectrometer, HORIBA LabRAM HR800, combined with an optical microscope Olympus BX41, using a red laser at 633 nm for excita-tion, attenuated with filters in order to avoid thermal degradation of the scotch tape used as sample holder. The Li+ and Co2+/3+ ion concentrations were determined by
inductively coupled plasma optical emission spectros-copy (ICP-OES) using a Perkin Elmer Optima 7000DV.
The muffle furnace used for combustion and tempering is equipped with a eurotherm thermal controller (Tony Güller Naber Industrieofenbau, Zurich, Switzerland).
Metal ion release
A metal ion release test was conducted to assess the amount of potential metal ion dissolution from the tested compounds. 100 mg of each of the micro- and nanopar-ticles were immersed in 10 ml of deionised water at pH 7 and pH 4.5 for 24 h. The concentrations of the metal ions were then determined using ICP measurements (Addi-tional file 1).
Statistical and data analysis
The microparticles of LiCoO2 are represented in
black and the nanoparticles in grey bars. Data are the mean ± the standard error of the mean (SEM) and are absolute values. Values were considered significantly dif-ferent compared to the negative control with p < 0.05 using a one way Anova with a post hoc Tukey test (*nan-oparticles, #microparticles).
Electrodes and electrochemical tests
Preparation of the electrodes
0.5 g of the nanoscale-LiCoO2 and 10 wt% SFG graphite
with respect to LiCoO2 were ball milled in a
horizon-tal set-up (Retch MM 400) for 15 min at a frequency of 30 Hz. The ball milling jar had a volume of 10 ml and con-tained two stainless steel balls of 10 mm in diameter. The electrode paste was prepared in a glass tube, starting with polyvinylidene fluoride (PVDF) (10 wt% with respect to LiCoO2) and 0.5 ml of N-methyl-2-pyrrolidone (NMP),
which were stirred by a mechanical stirrer for 30 min until PVDF was completely dissolved. 2 wt% of ABG graphite with respect to LiCoO2 was then added and the mixture
was stirred for 15 min. Then, the ball milled composite
powder (0.6 g) of graphite and LiCoO2 were added to the
PVDF/graphite/NMP mix and stirred for a half an hour. The so-obtained paste of PVDF/NMP/graphite/LiCoO2
was spread onto an aluminum foil by the doctor-blade method and dried overnight at 120 °C. The overall weight ratio of the composite made of nano-LiCoO2 (active
mate-rial), carbon and binder was around 78:12:10. Cell assembly
All compounds used were dried to avoid HF formation in the electrolyte and were assembled in a glove box under argon (MBraun, Germany) having <0.1 ppm of water and oxygen. Typically, the LiCoO2 electrode was assembled in
a coin cell using lithium metal as anode, a few drops of an ethyl carbonate (EC) and diethylene carbonate (DEC) mixture in a 1:1 volume ratio with 1 M LiPF6 and 2 wt%
of vinylene carbonate as electrolyte with respect to sol-vents and LiPF6 as well as a Celgard separator.
Battery tests
A potentiostat, Princeton Applied Research 273A, and an Arbin battery test instrument (version 4.27) were used to examine the electrochemical properties of the car-bon-nano-LiCoO2 composite electrodes. Charge and
dis-charge capacities of coin cells were measured by an Arbin 2000 battery test instrument at different current densities of C/20, C/10, C/5, C/2 and 1C. The voltage window was set between 2.6 and 4.4 V vs. Li+/Li. The current
densi-ties between C/20 and 1C were based on the practical capacity of 140 mAh/g.
Li-ion diffusion coefficients were evaluated by cyclic voltammetry at a sweep rate of 1, 0.7, 0.5, 0.2 and 0.1 mV/s between 3.5 and 4.4 V vs. Li+/Li.
The discharge kinetic of LiCoO2 electrodes was
investi-gated at various current densities between 20C and C/20. The LiCoO2 coin cells were re-charged until 4.4 V vs. Li+/
Li at 20C current density and then rested for 3 min. The electrode was discharged at the same current density of 20C until 2.6 V. This procedure was repeated at various lower current densities until C/20 (so-called deep dis-charge). By this procedure, the capacity vs. the discharge current can be determined directly. The sum of all capac-ities, obtained at different discharge currents is the maxi-mum discharge capacity of the battery:
The equilibrium potentials of LiCoO2 electrodes were
measured with the pulsed cycle method (3 min with applied current, followed by 3 min rest) in the range of potentials between 2.6 and 4.2 V vs. Li+/Li. The
equi-librium charge/discharge current was C/10 (15 mA/g). These procedures were described in detail by Spodaryk et al. [53].
The exchange current densities were calculated from the Tafel plot, i.e. dependence of current vs. overpoten-tial. Currents (±i), starting from the smallest to the high-est, were alternatively applied and the potentials during the current flow were measured. From the overpoten-tial (the difference between measured potenoverpoten-tial with the applied current and equilibrium potential, i.e. the poten-tial which the electrode reaches during rest time), the exchange current densities were calculated. The detailed method is described by Chartouni et al. [54].
Electrochemical impedance spectroscopy (EIS) data were obtained using a potentiostat/galvanostat PGSTAT302N with FRA module (Metrohm Autolab). Impedance spectra of the Li-ion batteries were meas-ured in the range of working frequencies from 10 mHz to 100 kHz. The range was built using a logarithmic dis-tribution. The voltage modulation amplitude was 10 mV. The EIS spectra were analysed using fitting procedure in NOVA 1.4 software from Metrohm Autolab. The accu-racy of the potentials measurements is ±2 mV, of the cur-rent ±2% and of the capacity ±2%.
The values of the elements from the equivalent circuit model (Additional file 1: Figure S10) were obtained by the following formulas:
where Ri is contact resistance or charge transfer
resist-ance, Ohm,Constant phase element (CPE), which mod-els the behavior of an imperfect capacitor or of a double layer, calculated by:
where Y0 is admittance of an ideal capacitance, siemens
S; n is an empirical constant, 0 < n < 1 (n is frequency independent and in the case n = 1 formula describes an ideal capacitor, n = 0—resistor, n = 0.5—Warburg impedance); j is imaginary part of impedance; ω is angu-lar frequency, rad/s, ω = 2πf ; f is frequency, Hz.
The Warburg impedance is provided by:
Lung cell cultures
All in vitro exposure experiments in this study were conducted with a 3D triple cell co-culture model of the human epithelial tissue barrier cultured at the ALI. This system has previously been described in detail [39, 55]. Briefly, the model consists of a layer of human alveolar type II-like epithelial cells (A549, derived from the Amer-ican Type Culture Collection) with human monocyte-derived macrophages (MDM) on the apical side (upper chamber) and monocyte-derived dendritic cells (MDDC)
ZRi=Ri ZQ= 1 Y0(jω)n ZW = 1 Y0 jω
on the basolateral side (lower chamber). A549 epithelial cells were cultured at a density of 0.5 × 10⁶ cells/ml in
cell culture medium RPMI 1640 (supplemented), on BD Falcon cell culture inserts (high pore density PET mem-branes, 4.2 cm2 growth area, 3.0 µm pore size; Beckton Dickinson AG, Switzerland). The cell culture densities
of MDM and MDDC were 5 × 10⁴ and 25 × 104 cells/
insert, respectively [56].
Human blood monocytes were isolated from dif-ferent, individual buffy coats received from the Swiss blood donation service (Bern, Switzerland) (i.e. differ-ent donor for each exposure), using CD14+
MicroBe-ads as described previously [57]. Due to this, variations in the background between different sets of cell cultures were expected to occur. Co-cultures were incubated for 24 h under suspension conditions in order to allow cell– cell habituation. Subsequently, cell culture medium was extracted from the apical layer to allow formation of the ALI over a period of 24 h in the incubator prior to parti-cle exposures.
Air–liquid interface cell exposure system
The dry powder insufflator (DP-4, Penn Century, USA) was used to pulverise the LiCoO2 particles. The
par-ticle exposure system consisted of a closed cham-ber (15 × 15 × 35 cm) coated with aluminium foil and equipped with a quartz crystal microbalance (QCM) for the in situ determination of the amount of material deposited. As the material settles onto the QCM, the fre-quency of the crystal changes (ΔF). The ΔF value (Hz) calculated from the recorded frequency values before and after deposition of material is converted to deposited mass per area (μg/cm2) as described in [58].
To avoid electrostatic blocking of the needle, aggrega-tion, asymmetric deposition and low deposition yield, a stainless steel needle without bevel of 2 mm Ø and 7 cm of length was used as pulverization means with a gas expulsion flow of ~120 ml/s of air in two pulse of ~0.5 s for each exposure.
Particles exposures
As described for the aerosolisation of dry volcanic ash particles [59] the pulverisation of the dry powder of nan-oparticles produces a radial distribution of the particles at the bottom of the chamber. In order to obtain a regular and reproducible distribution of particles on the cells, the 6-well culture plates were placed in such a way that the inserts holding the triple cell co-cultures and the QCM balance were disposed equidistant from the centre in a cross-like pattern as drawn in the scheme below (Fig. 1).
Two inserts/wells were used for each of the three differ-ent concdiffer-entrations of nanoparticles and microparticles. Experiments were repeated 3–4 times for each of the two
particle sizes chosen (micronsize commercial particles and homemade nanoparticles). The pulverisation pro-cess took place over a period of about 1 month with each week a different blood donor source.
The samples (wells) were incubated overnight at 37 °C and 5% CO2. The day after incubation, the supernatant
was removed and replaced with 2 ml of culture medium.
Biological assays
Cytokine and chemokine quantification
The pro-inflammatory response of the triple co-culture after exposure to LiCoO2 particles was quantified using
the amount of the pro-inflammatory mediators which are tumor necrosis factor α (TNF-α) and interleukin-8 (IL-8) using commercial ELISA development kit and the related supplier protocol. The positive control for the pro-inflammatory proteins was treated with lipopolysac-charide 1 µg/ml (LPS) for 24 h.
Optical microscopy/LSM microscopy
After the exposure, cells were fixed and labelled as previ-ously described by Lehmann et al. [56]. In short, samples were stained with a 250 µl mix of a 1:50 dilution of phal-loidin-rhodamine for cell cytoskeleton and 1:100 dilu-tion of 4′,6-diamidino-2-phenylindole (DAPI) for the cell nuclei. Coverslips were then mounted onto microscope slides using Glycergel and imaged by LSM.
Results
1‑Solid states structures
Compounds 1–7 were obtained by reacting CoCl2 with
LiOPh in THF, followed by crystallization in THF under different conditions (temperature, presence of water or not, leading to compounds 1–3) or by eliminating the THF solvent and replacing it with other mono- or bis-dentate ligands, like TMEDA, dioxane, DME, or pyridine (4–7). A general reaction scheme (Scheme 1) resumes the family of compounds obtained. We describe here the
single crystal structures of compounds 1–5, on which we base our structural discussion. For compounds 6 and 7, the single crystal structures could not be determined as the single crystal quality was poor; yet, the chemical analyses confirm a chemical composition in analogy to the other five compounds.
Among the compounds, different structure types could be identified depending on the solvent present. For com-pounds 1–7, the core of the structure is essentially based on one central cobalt ion which is tetrahedrally coordi-nated by four phenolate entities, bridging pairwise to two lithium ions. The coordination spheres of the lithium cations are completed by coordinating solvent molecules, leading either to molecular entities or a coordination pol-ymer in case of 5. Figure 2 shows as an example of such a core structure the one of compound 1. In compound 3, the terminal ligands of one of the two Li-ions have been formally replaced by two water molecules, which act as bridging ligands between two [Li2Co(OPh)4] cores,
lead-ing thus to a dimer-type structure. Detailed structure descriptions for 1–5 with distances and angles are given in the Additional file 1: Text 2, while a resume is given in Table 6.
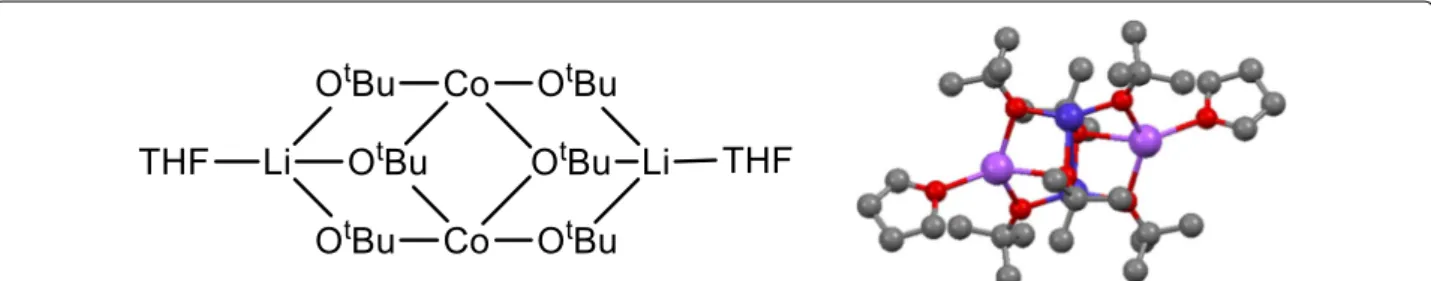
Compounds 8–12
For the compounds 8–12, the aim was to test ligands other than aryloxides, such as alkoxides, and to also mix aryloxides and alkoxides as ligands. The synthesis used is similar to the one for compound 1 (Scheme 2), but replacing the LiOPh with alkoxides or using a mix of both.
Since the precursor compounds 8, 10, 11 and 12 did not afford single crystals, other methods were used to approach their structure. In possible analogy to com-pound 8, the sodium comcom-pound [Na2Co2(OtBu)6(thf)2]
was described in the literature [60]. Since the sodium ions are coordinated by four ligands, similar to the pre-ferred coordination of Li+, and since Co2+ tends to a
tetrahedral coordination [61], we propose a similar struc-ture for the lithium compound 8 (Fig. 3). The TGA and NMR measurements confirm that there are two THF molecules per three OtBu ligands and the ICP
measure-ment gives a ratio of one lithium for one cobalt ion. The compounds 10–12 were also analyzed by TGA and NMR to determine the amount of ligand and sol-vent remaining in the solid state structure and the ratio between the ligand and the coordinating solvent
Fig. 1 Scheme of the exposure chamber bottom viewed from the
top
molecules. ICP measurements and argentometric titra-tions of chloride (Additional file 1: Table S3) were also performed to evaluate the ratio of lithium per cobalt ions and the amount of LiCl remaining in the material. The results are resumed in Table 2.
From the synthesis, we observed that three equivalents of ligand are required to form carbonate-free LiCoO2
from this precursor 10. The low amount of impurity of mainly Li2CO3 after combustion indicates that there
is no excess of unreacted lithium precursor. We also found one Li+ for one Co2+ ion in the complex as well
as two THF molecules. From this data we propose that the OiPr-compound possesses a structure similar to
the OtBu-precursor 8 (Fig. 4). Using the same method
for the compound 12 and based on the findings shown in Table 2, we can propose a similar structure as for 8 (Fig. 4). The extra methanol molecules are difficult to assess since both methanol and THF have almost the same boiling point. Finally, NMR measurements are not
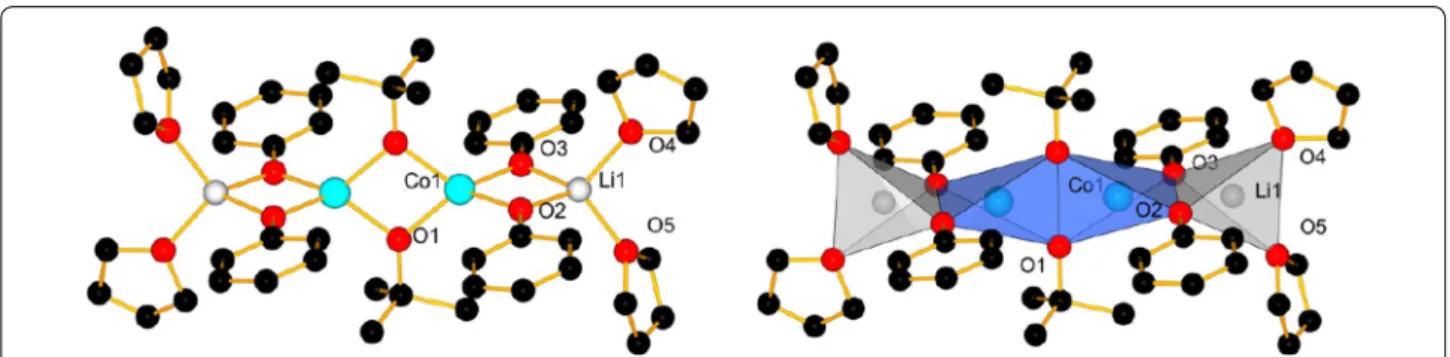
Fig. 2 Labelled view of the molecular structure of 1, H‑atoms are omitted for clarity (left); coordination polyhedra in 1 (right)
Scheme 2 General reaction equation for the synthesis of compound 8–12
Fig. 3 Proposed structure for 8 (left) based on the [Na2Co2(OtBu)6(thf )2] compound (right, dark blue Co, violet Na, red O, grey C; H‑atoms omitted
described in [60]
Table 2 Combined results from TGA, NMR, ICP and argentometric titration for compounds 8–12
Compound no—reagent Ligand eq. vs. Co eq. Solvent molecules per complex Free lithium (eq.) LiCl (eq.) 8—LiOtBu 3 4 (residual THF) 1 Li per Co 2 Li per Co
9—LiOtBu + LiOPh 1 + 2 (3) 4 1 Li per Co 2 Li per Co
10—LiOiPr 3 2 THF 1 Li per Co 2 Li per Co
11—LiOEt 6 4–5 THF 4 Li per Co 2 Li per Co
helpful since the broadening of the signals (due to the paramagnetic influence of the cobalt ion) hides most of the possible peak shifts.
The compound 11 is the only one which does not fol-low this rule of three ligands per Co2+ and requires six
ligands per Co2+ to form the desired oxide without
impu-rities of Co3O4. An open double heterocubane structure
is proposed, as it combines the minimum amount of ligands, the amount of free lithium for coordination, the amount of THF and the preferred coordination of lith-ium ions (4) and cobalt ions (4,6) as determined by TGA, NMR, ICP and argentometric titration (Fig. 4).
Compound 9 is an interesting mixed ligand compound as it forms molecules of [(thf)2Li(μ-OPh)2Co(μ-OtBu)]2
where the two OtBu groups act as bridging ligands
between two Co2+ ions. The OPh ligands bridge pairwise
between the cobalt and lithium ions, while two THF molecules complete the coordination of the lithium ions (Fig. 5). A detailed description with distances and angles is given in the Additional file 1: Table S1 and Text 2. The bond valence sums are >2 for both cobalt ions and >1 for both lithium ions, indicating sufficient good coordination of the metal ions by their ligands, as it is also the case for compounds 1–5 (Table 6).
Thermal decomposition to LiCoO2
Among all compounds, 2 and 3 are difficult to handle as they lose their solvent molecules very quickly. The com-pounds 4–7 are not well suited for the formation of oxide at low temperature because of their relatively high boil-ing point, high carbon content and molecular weight. The following investigations for the formation of LiCoO2
Fig. 4 Proposed structure of compound 10 (top), 11 (left bottom) and 12 (right bottom)
were thus limited to compounds containing THF and the less carbon containing compounds, hence 1 and 8 to 12.
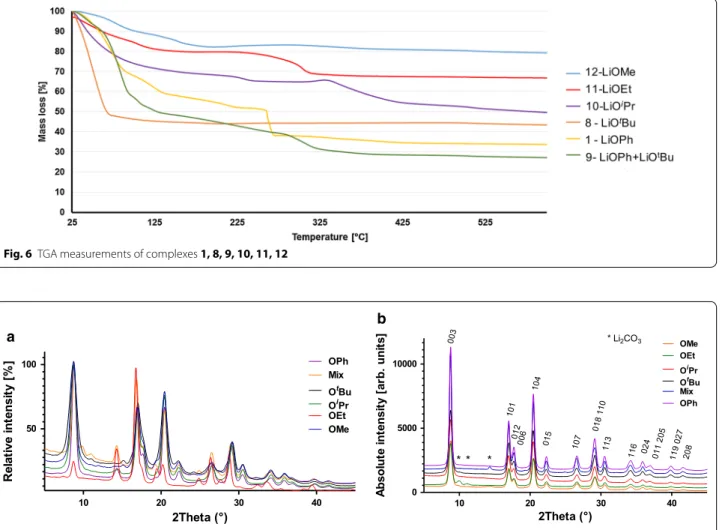
In order to use these compounds as precursors for the manufacturing of LiCoO2, TGA measurements under
oxygen atmosphere with open crucible were performed on the chosen compounds (Fig. 6). The general decom-position process of these complexes begins with the loss of the coordinated and residual non-coordinated solvent molecules before 120 °C (THF B.P. 66 °C, MeOH 65 °C). At higher temperature, between ca. 100 and 400 °C depending on the precursor, the combustion process occurs: it consists of an oxidation of the Co2+ to Co3+ and
of the ligand carbon backbone combustion. Above the temperature of 450 °C, the masses remain quasi constant (Fig. 6). The completed combustion temperature and the detail thermal measurement information are described in Additional file 1: Tables S4 and S5.
Based on the minimum temperature of decomposition of the complexes determined by TGA, combustion tests were performed at different temperatures. Heating to the
minimal temperature of decomposition of the precursors of 300 °C for 1 h lead to the formation of the HT-LCO phase with some byproducts (Li2CO3) (Fig. 7a). Since
Li2CO3 is highly soluble in water, it was removed after
rinsing. We believe that the formation of HT-LCO at such a low temperature is possible due to the preorgani-zation of metal ions within the heterobimetallic single source precursors. We decided nevertheless to increase the decomposition temperature by 50–100 °C compared to the decomposition temperature of the compounds in order to reduce the amount of byproducts, and for com-parison purposes, the temperature was set to 450 °C for 1 h for all compounds.
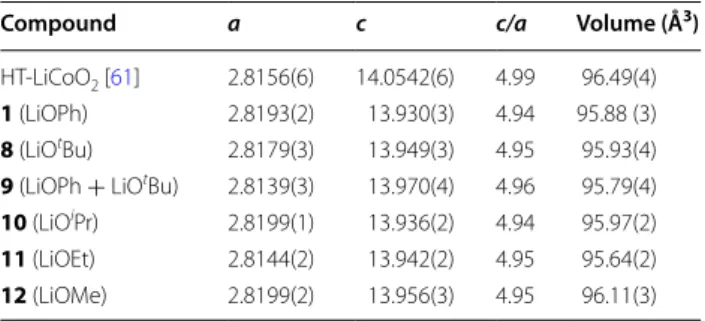
After indexation of the powder diffractograms obtained after combustion at 450 °C, all of the tested precursors (1, 8–12) afforded LiCoO2 with low amounts
of impurities that could not be detected by powder X-ray analysis after washing with water, hence less than 5% (Fig. 7). Heating to the minimal temperature of decom-position of the precursors of 300 °C for 1 h leads to the
Fig. 6 TGA measurements of complexes 1, 8, 9, 10, 11, 12
a b
formation of the HT-LCO phase with some byproducts (among which Li2CO3). A Rietveld refinement of the
dif-ferent diffractograms, taken on a Mo source, was per-formed to determine the exact phase of the oxide. The lattice cell parameters from the different precursors cor-respond to a slightly distorted HT-LCO, with the space group R-3 m. This small distortion of the unit cells arises from the fact that this material is composed of nanocrys-tallites which possess a more strain than standard micro-metric crystallites. The c/a ratio gives also an indication on the general cation ordering of the oxide phase. If the
c/a ratio is 4.899 or lower, it means that it is a
cation-dis-ordered rock salt structure, also called the LT-LCO with a spinel structure (Fd3 m). Since this ratio c/a is higher than this value in all cases, it indicates that the high temperature phase has been obtained for all precursors (Table 3).
Another method to identify LT and HT phases of LiCoO2
is to verify the peaks at 2 theta = 65–67° (λ = Cu-Kα1). The
HT-LCO has two split peaks of the (108) and (110) planes while the LT-LCO has one single peak of the (440) plane at 65° [13, 62]. As shown in Fig. 8 below, all the materials prepared with OtBu, OiPr, OMe and OPh show two split
peaks corresponding to the HT-LCO phase.
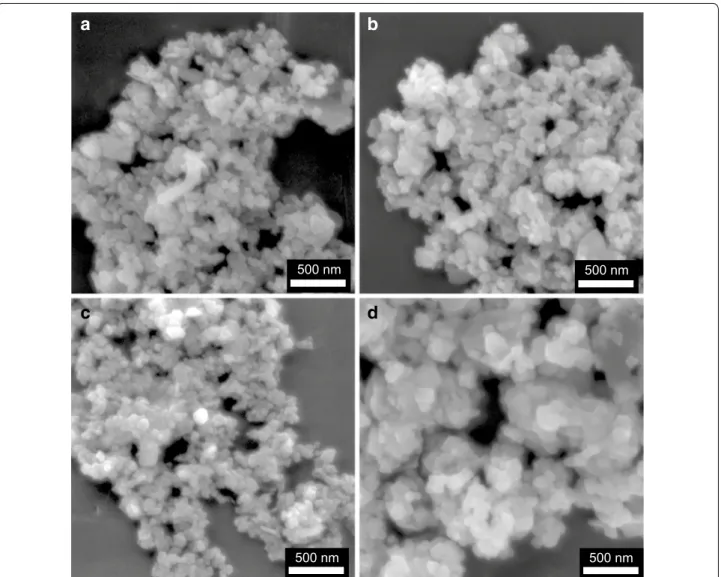
After thermal treatment at 450 °C, the morphologies of the materials prepared with different precursors were ana-lyzed using SEM (Fig. 9). All the materials show polyhedral shapes but the materials obtained from LiOiPr and LiOPh
precursors formed rhombohedral and triangle shapes. Since the detection limit in powder X-ray diffraction is 3–5%, Raman spectroscopy was used to complete the analysis. The HT-LCO possesses only two Raman active modes: A1g (Co–O stretching) ʋ1 at 595 cm−1 and Eg (O–
Co–O bending) ʋ2 at 485 cm−1, while LT-LCO has four
Raman active modes (A1g, Eg, 2 F2g) which are
respec-tively at ʋ = 590, 484, 605 and 449 cm−1 and are due to
the mixing of cations in the structure [63].
The Raman spectrum of our non-annealed nano-LCO obtained from compound 8 shows a contamination of the
HT-LCO with the LT phase which can be easily removed by annealing at 600 °C for 1 h. No significant improve-ment can be observed for a 700 °C annealing (Fig. 10). In order to avoid particle growth due to coalescence and ripening, the duration and temperature of annealing have to be minimized, hence we used the 600 °C annealed nanoparticles for the biological assays described later.
ICP measurements on the nano-LCO obtained from 8 and on commercial micron-sized LCO were carried out and the ratio between Li+ and Co3+ ions was calculated:
we found 0.96 ± 0.02 Li+ ions per Co3+ ion for the
nano-LCO (Additional file 1: Table S4). Thus the stoichiometry is a little bit lower than the optimal 1:1 stoichiometry ratio. This can be explained at least partly by the washing steps during which part of the Li+ can be washed away,
the mechanical stress induced by ultrasounds and the shear stress of the centrifuge and the annealing in which the Li+ and Co3+ ions can diffuse out of the oxide into
the crucible. The ICP measurements of the micro-LCO give a Li+ content of 1.01 ± 0.02 which is the optimal
ratio for the HT-LCO.
Morphologies and determination of the particle and crystallite sizes
The crystallite and particle sizes were assessed via the Scherrer equation (X-ray) and the BET equation (gas adsorption), respectively. The details are described in the Additional file 1: Equation S1 – S5.
Table 4 gives the summary of specific surface area, dif-ferent sizes of particles and crystallites obtained under identical combustion conditions (temperature, time, speed of heating/cooling and atmosphere composition) depending on the starting complexes.
Table 3 Cell parameters of the LiCoO2 formed using
differ-ent precursors and HT-LiCoO2 Ref. [61]
Compound a c c/a Volume (Å3) HT‑LiCoO2 [61] 2.8156(6) 14.0542(6) 4.99 96.49(4)
1 (LiOPh) 2.8193(2) 13.930(3) 4.94 95.88 (3)
8 (LiOtBu) 2.8179(3) 13.949(3) 4.95 95.93(4)
9 (LiOPh + LiOtBu) 2.8139(3) 13.970(4) 4.96 95.79(4)
10 (LiOiPr) 2.8199(1) 13.936(2) 4.94 95.97(2)
11 (LiOEt) 2.8144(2) 13.942(2) 4.95 95.64(2)
12 (LiOMe) 2.8199(2) 13.956(3) 4.95 96.11(3)
Fig. 8 XRD of LiCoO2 prepared with 8‑LiOtBu, 10‑LiOiPr, 12‑LiOMe
The morphologies of the particles were investigated by SEM images (Fig. 11). The shapes of the particles obtained from the different precursors are similar and submicron. It is also noted that the material always tends to form large aggregates due to its high surface area.
Electrochemistry and Li‑ion diffusion
Finally, in order to learn if the size of particles has a direct influence on the Li-ion diffusion, cyclic voltammetry of LiCoO2 electrodes was performed on two different
par-ticles sizes: 40 and 15 nm coming from the precursors 8 and 12, respectively after a prolonged ball milling of 1 h instead of 15 min.
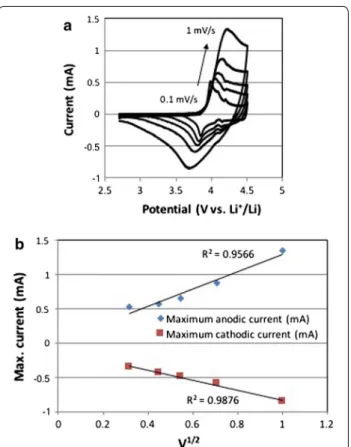
Figure 12a shows the cyclic voltammograms of LiCoO2 electrode prepared with LiOtBu
precur-sor at different scan rates between 0.1 and 1 mV/s.
When Li+ is extracted from LiCoO
2, Co3+ in LiCoO2
is oxidized and electron is released (LiCo3+O 2→Li1− xCo4+/3+O2 + xe− + xLi+). On the other hand,
oxi-dized Li1−xCoO2 is reduced and electron is uptaken
when Li+ is re-inserted into Li
1−xCoO2 (Li1−xCo4+/3+
O2 + xe− + xLi+→LiCo3+O2). Therefore, the current
increased where the redox reactions of Co3+/Co4+
occurred above 3.9 V for anodic peaks and between 3.6 and 3.9 V vs. Li+/Li for cathodic peaks. The CVs and the
maximum current peaks of the compound 12 are shown in Additional file 1: Figure S9.
The Li-ion diffusion coefficient can be determined from these cyclic voltrammograms by using the Randle–Sevcik equation. The Randles–Sevcik equation [63]:
(1) Ip = 2.69 × 10⁵ n3/2A D1/2Li C v1/2 500 nm 500 nm 500 nm 500 nm
a
b
c
d
with Ip the peak current; n the number of transfer elec-trons; A the surface area of the electrode; C the concen-tration of reactants; and v the scan rate.
The plot of the square root of the scan rate vs. the anodic or cathodic peaks gives the slopes which repre-sent the square root of the Li+ ion diffusion coefficient
value, DLi+ (Fig. 12b).
The Li+ ion diffusion coefficients (D
Li+) of our
nano-particles were 2.3 × 10⁻⁵ and 4.5 × 10⁻⁶ cm2 s−1 for
8-LiOtBu and 12-LiOMe, respectively while the one of
commercial HT-LCO was 2 × 10⁻⁷ cm2 s−1 (Table 5). The
values obtained from nanoparticles are 20–100 higher than the standard value for HT-LCO [64]. Thus the kinet-ics with Li+ ions are much faster in nanoscale LCO than
in micron-LCO. When we compare the values of diffu-sion coefficients of 15 and 40 nm of nano-LCO, the larger particle size of 40 nm has even higher diffusion coeffi-cient. It will be explained in the discussion part later.
Electrochemical properties
After DLi+ was determined, the battery properties of our
nanoscale LCO materials were investigated. The charge/ discharge current is expressed as a C-rate to evaluate battery capacities at various current values. A C-rate is a measure of the rate at which a battery is discharged rela-tive to its maximum capacity. The current density and C-rate are determined by the nominal specific capac-ity of 150 mAh/g. For example, the current densities are 150 and 7.5 mA/g at 1C (a battery is charged in 1 h) and C/20 (a battery is charged in 20 h), respectively. Figure 13
shows the discharge capacities of LiCoO2 electrodes
pre-pared by the precursors 1-LiOPh, 8-LiOtBu, 10-LiOiPr
and 12-LiOMe. Depending on the precursor used in the synthesis, the specific capacity varies. 10-LiOiPr and
1-LiOPh derived LiCoO2 electrodes obtained superior
capacities to the ones obtained with 8-LiOtBu
precur-sors. The mean specific capacity of LiCoO2 derived from
1-LiOPh was 210 mAh/g at C/20, which is 77% of the theoretical capacity of 272 mAh/g, while LiCoO2 from
the LiOtBu precursor had 124 mAh/g (46% of the
theo-retical value) at the same rate.
After cycling of charge/discharge at different cur-rent densities, we disassembled the batteries for all four samples and rinsed the LiCoO2 electrodes to verify their
structures. XRD in Fig. 14 shows that all the cycled LiCoO2 electrodes have two peaks at (108) and (110)
cor-responding to the HT-LCO phase, hence the structure is unchanged after cycling.
Table 4 The specific surface area, mean particle size and crystallite size of LiCoO2 prepared with different precursors
* The mean particle size was determined by the equation of d = K/(ρ×SBET), where K is the shape factor, ρ is the density of the material (5.05 g/cc). and SBET is the
specific surface area of the material
** Crystal size was determined using Scherrer equation d = Kλ/(B cosθ), where d is the mean crystallite size in volume-weight, λ is the wavelength of the X-rays, B is the width of a peak at a half maximum due to size effects assuming that there is no strain, K is a constant value of 0.89, and θ is the incident angle
*** Particle sizes were obtained after 1 h of ball milling
SSA (m2/g)
Annealed 1‑LiOPh 8‑LiOtBu 9‑(LiOPh + LiOtBu) 10‑LiOiPr 12‑LiOMe 11‑LiOEt
500 °C 9.46 (025) 16.50 (0.2) 9.62 (0.2) 11.50 (0.3) 19.70 (0.12) not measured 600 °C 2.59 (0.015) 12.50 (0.14) 0.95 (0.03) 3.65 (0.05) 8.00 (0.07) 0.95 (0.01) 700 °C 0.50 (0.02) 6.10 (0.17) 0.78 (0.02) 3.04 (0.05) 5.50 (0.05) 0.34 (0.02)
Particle size (P)* and crystal size(C)** (nm)
P(1) C(1) P(8) C(8) P(9) C(9) P(10) C(10) P(12) C(12) P(11) C(11)
500 °C 126 (2) 50 (2) 72 (1) 60 (2) 124 (2) 75 (2) 103 (2) 40 (1) 60 (1) 50 (4) Not measured Not measured 600 °C 459 (2) 45 (2) 95 (1), 40*** 45 (3) 1251 (26) 150 (3) 326 (3) 75 (1) 149 (1), 15*** 45 (1) 1251 (9) 110 (3) 700 °C 2376 (60) 90 (2) 195 (4) 55 (2) 1529 (26) 185 (1) 391 (4) 295 (1) 216 (1) 170 (2) 3494 (130) 285 (1)
Fig. 10 Raman spectra of the annealed nano‑LiCoO2 obtained from compound 8 at different temperatures and annealing steps (0x = 500 °C for 2 h, 1x = first annealing at 600 °C for 1 h and 2x = second annealing at 700 °C for 30 min)
The equilibrium charge/discharge curves of the LiCoO2
electrodes obtained from LiOPh, LiOtBu and LiOMe
pre-cursors were investigated as shown in Fig. 15. The mark-ers are measured when the current is not applied to the battery while the dashed lines are recorded when the current is applied. They show the plateau of equilibrium charge curves at 3.9 V and discharge at 3.8 V vs. Li+/Li.
The coulombic efficiency of the LiCoO2 electrodes from
LiOPh reached >95% with relatively low polarization between charge and discharge process (Fig. 15a). In case of the LiCoO2 electrode from LiOtBu (Fig. 15b), the
cou-lombic efficiency reached also >95% but both charge and discharge processes result in half of the capacities com-pared to these of the electrodes from LiOPh. Moreover, the potentials during charging with the applied current (dashed lines on the graphs) are higher in Fig. 15b com-pared to these in Fig. 15a, c.
The deep discharge process was evaluated to estimate how fast the battery can reach the maximum discharge capacity of the different LiCoO2 electrodes. Figure 16
exhibits that the LiCoO2 electrode from LiOPh precursor,
(a), can reach 99% of its maximum capacity (120 mAh/g) within 9 min (at 5.2 C) due to the fast kinetic reaction of Li+ ion insertion/extraction. Of course, this maximum
capacity remained at any lower current densities, show-ing the plateau on the right side in Fig. 16a. On the other hand, the electrode from LiOiPr precursor, (b), can be
discharged to 90% of its maximum capacity (122 mAh/g) at much lower current density of 0.44 C (about 26 min) than (a). (b) can reach 85% (104 mAh/g) of its maximum discharge capacity within 6 min (at 7 C). Thus, this deep discharge measurement supports that the discharge capacities at higher current densities (>C/2) are lower in LiCoO2 electrode with LiOPh than those in LCO with
500 nm 500 nm
500 nm 500 nm
a
b
c
d
LiOiPr (Fig. 16). Therefore, the kinetics of the electrode
(a) obtained from LiOiPr is an order of magnitude faster
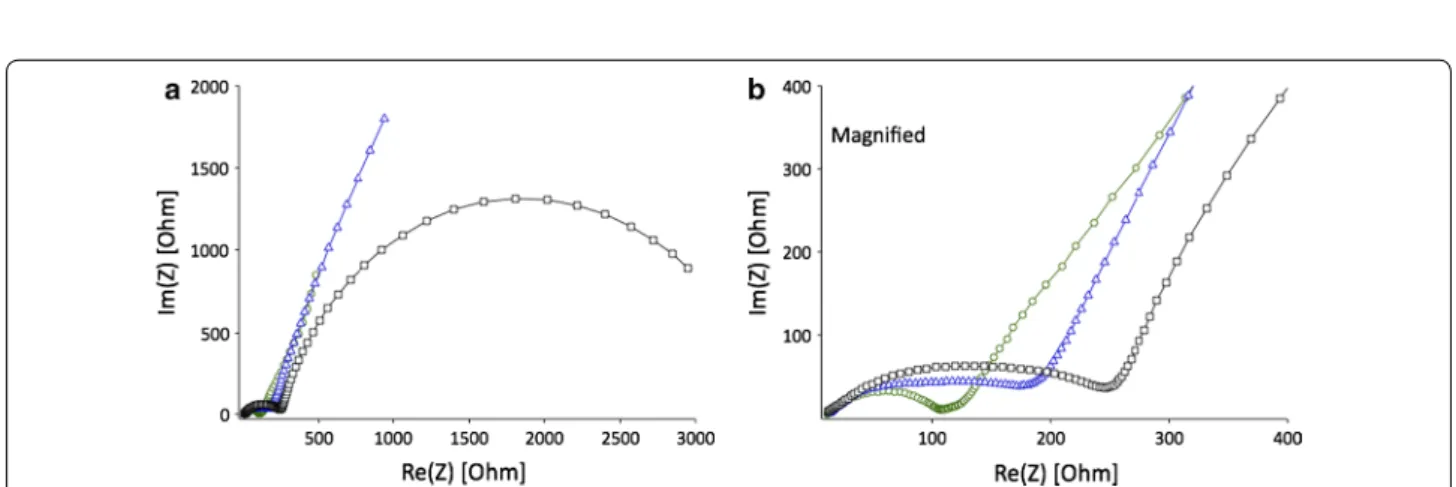
than (b) (obtained from LiOPh) at high current densities. The Nyquist plots presented for electrodes with differ-ent precursors were obtained in the frequency range of 100 kHz–0.01 Hz at 25 °C (Fig. 17). The EIS spectra of the electrodes with LiOPh and LiOMe precursors are similar in shape with one semicircle and Warburg branch, while the electrode obtained from LiOtBu precursor shows
hodographs with two semicircles without Warburg impedance. After fitting the EIS data, the equivalent cir-cuit models were proposed (Additional file 1: Figure S11). The ion transfer resistance and total impedance of elec-trodes with different precursors increase in the following sequence: LiOPh < LiOMe < LiOtBu, which is in good
agreement with the discharge capacities and equilibrium charge/discharge curves.
Hazard assessment of particles
Particle aerosolisation
Nanoparticles obtained from precursor 8, which was annealed at 600 °C for 1 h, were compared to a com-mercially obtained, micron-sized LiCoO2 sample. A dry
powder insufflator was used to aerosolise both materials for direct deposition onto the surface of the multicellular epithelial tissue barrier model. Initially, following aero-solisation, the deposition of the two particle types was characterised in terms of their mass deposition, particle size, as well as their distribution and morphology.
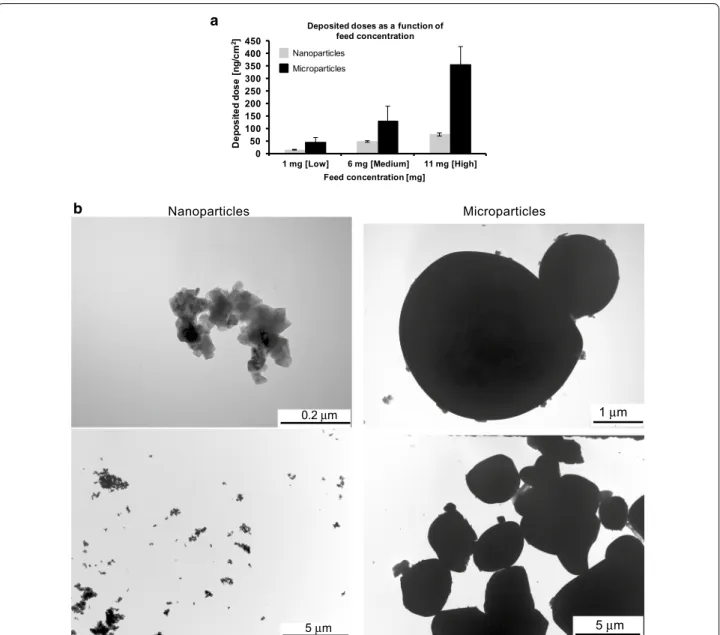
The cell-delivered dose was monitored using an inte-grated quartz crystal microbalance (QCM) and showed a dose-dependent deposition of the both samples, i.e. 0.81 ± 0.2, 0.55 ± 0.14 and 0.16 ± 0.05 µg for nanoparti-cles, and 3.92 ± 0.78, 1.46 ± 0.63 and 0.51 ± 0.18 µg for microparticles. It was, however, not possible to achieve the same range of deposited concentrations for both
Fig. 12 a Cyclic voltammograms of the 40 nm LiCoO2 particles from
compound 8 at different scan rates. b The maximum anodic and cathodic current peaks of LiCoO2 electrode vs. the square root of
sweep rate
Table 5 Size and Li-ion diffusion coefficient comparison between two precursors, 8 and 12, and HT-LCO Ref. [64]
Compounds/precursors Size DLi (cm2 s−1)
HT‑LCO [64] 11 μm 2 × 10⁻⁷
8—LiOtBu 40 nm 2.3 × 10⁻⁵
12—LiOMe 15 nm 4.5 × 10⁻⁶
Fig. 13 Discharge capacities of LiCoO2 electrode. LiCoO2 materials
were prepared by 8‑LiOtBu, 10‑LiOiPr, 12‑LiOMe and 1‑LiOPh
Fig. 14 XRD of LiCoO2 electrodes after cycling. LiCoO2 materials
were prepared with different precursors: 8‑LiOtBu (square), 10‑LiOiPr
(⋄), 12‑LiOMe (triangle) and 1‑LiOPh (circle) precursors; the aluminum peak stems from the current collector of the electrode
Fig. 15 Charge (filled markers) and discharge (empty markers) curves of LiCoO2 electrodes prepared with filled circle, open circle—LiOPh (a), filled
square, open square—LiOtBu (b), filled triangle, open triangle—LiOMe (c) precursors. Lines (‑) correspond to the potentials with applied current and
markers to the potentials without current (in equilibrium state)
Fig. 16 Deep discharge curves for electrodes obtained from: a LiOPh (filled circle, open circle) and b LiOiPr (filled triangle, open triangle) Right axes
indicate the state of discharge in percentage (empty markers)
Fig. 17 a Nyquist plots of coin cells consisting of LiCoO2 electrodes with different precursors: square—OtBu, triangle—OMe, circle—OPh. b Magni‑
nano- and micron-sized particles despite using the same initial feed concentration, as shown in Fig. 18a. Reason for this, apart from the different pulverisation methods, is that the microparticles can be considered to exhibit a higher density, and therefore greater tendency to agglom-erate/aggregate leading to a higher surface density com-pared to the limited agglomeration/aggregation shown by the nanoparticles.
By using TEM it was observed that the pulverized nanoparticles of LCO formed agglomerates/aggregates
ranging from nano-sized to micron-sized (ca. 0.05– 50 µm). This could possibly be attributed to the low surface charge of the material (i.e.≤ ±10 mV). The aver-age size of primary nanoparticles was estimated to be 64 ± 5 nm, as determined by the BET method, while the crystallite size was determined to be 60 ± 5 nm using the Scherrer equation. The micron-sized particles were noted to exhibit a size of 10–12 μm, as previously reported [16–21]. In terms of their morphology, nanoparticles were observed to show rhombohedral/tetrahedral shaped
0.2 µm 5 µm Microparticles Nanoparticles 1 µm 5 µm a b
Fig. 18 Deposition characterization of aerosolised nano‑sized and micron‑sized particles. a Average mass deposition (ng/cm2) of particles quanti‑
fied using a quartz crystal microbalance (QCM) following nebulisation of low (1 mg), medium (6 mg) and high (11 mg) particle doses using a dry powder insufflator. Data are presented as the mean ± standard error of the mean. b Transmission electron micrographs of aerosolized nano‑ (left) and microparticles (right), indicating, in a qualitative manner, the heterogeneity of the particle deposition for each particle‑size. Images also show a representative overview of the particle morphology following the aerosolisation process
patterns, whereas the commercial microparticles were found to be irregular in shape, with most showing round-ish shapes (Fig. 18b).
Cell death
After 24 h exposure, LiCoO2 nanoparticles showed
limited ability to cause cell death following their aero-solisation onto the in vitro multicellular epithelial tis-sue barrier model at each particle concentration tested (Fig. 19a). Both low and medium nanoparticle concen-trations showed similar effects, whilst the highest con-centration applied increased the level of cell death by 50% compared to the lower concentrations studied. This result can be attributed to an ‘overload’ scenario upon the cells at the highest concentration applied (Fig. 19b) [65]. It is important to note that although these values are sig-nificantly different from the negative control (p > 0.05) (i.e. cell culture media only), with the highest concentra-tion applied showing a maximum of <15% cell death in the in vitro co-culture system, the findings indicate that the nanoparticles are not causing complete destruction of the cellular system but do induce a limited cytotoxic
effect at these concentrations. Similar results were also evident following micron-sized LiCoO2 particle
expo-sures at each test concentration (Fig. 19a). In respect to these semi-quantitative results, it is also important to highlight that qualitative assessment, via confocal laser scanning microscopy, showed no morphological changes to the multicellular system following exposure to either particle type at the highest concentration applied for 24 h (Fig. 19b).
(Pro‑)inflammatory response
No significant (pro-)inflammatory response (i.e. either TNF-α and IL-8 release) was observed following nan-oparticle exposures across all concentrations tested (Fig. 20). Similar results were observed with the micron-sized particles in terms of the TNF-α response from the multicellular system after 24 h exposure. However, microparticle exposures did show a significant increase (p > 0.05) in terms of the IL-8 response from the co-cul-ture, in a concentration-dependent manner at this time point (Fig. 20).
a
b
Fig. 19 Percentage (%) cell death levels and morphological analysis of the multicellular model of the epithelial tissue barrier following 24 h
exposure to both LiCoO2 nano‑sized and micron‑sized particles. a Table shows quantification of the average % cell death levels of propidium iodide
stained cells at the three tested concentrations (low, medium and high), as analysed via one‑colour flow cytometry analysis. Asterisks indicates a statistically significant increase in the % level of cell death within the multicellular in vitro system compared to the negative control (i.e. cell culture medium only) (p > 0.05) (n = 3). b Confocal laser scanning microscopy images show F‑actin cytoskeleton (red) and the nuclei (blue) staining of the complete multicellular model following exposure to both particle sizes/types at the highest concentration tested after 24 h
Discussion
The general reaction of CoCl2 and LiOPh for the
genera-tion of the precursors 1–7 is based on the LiCl-elimina-tion and the formaLiCl-elimina-tion of a mixed phenoxide with always the same metal ion ratio of 2:1 for Li:Co, as found in the core [Li2Co(OPh)4] of the structures 1–7. The formation
of this type of compound is in our hands independent of the amount of LiOPh added (between 1 and 6 equiva-lents). The core is always made of a central Co2+ ion
which is surrounded in a (more or less distorted) tetra-hedral way by four phenoxide ligands. Two by two, these O-donors act each as μ-bridging ligands to one Li+ ion.
The coordination sphere of the latter is then completed by either mono- or bidentate donor molecules stemming from the solvent. These coordinated solvent molecules influence the arrangement of the complexes with respect to each other. For instance, 0-dimensional compounds are obtained with monodentate terminal ligands like THF and pyridine or bidentate terminal ligands like DME and TMEDA, whereas bridging ligands such as dioxane lead to polymeric arrangements. In the [Li2Co(OPh)4]
cores (Fig. 21) of all compounds 1–5, for which the sin-gle crystal structures could be determined to satisfaction, the Co–O distances are between 1.938(4) and 1.978(4) Å long, while the angles O1–Co–O2 and O3–Co–O4 are very similar with 86°(±1°). The O2–Co–O3 and O1–Co– O4 angles are however more sensitive to the environ-ment of the Li+ cations (see Table 6), respectively packing
effects, and vary between 112 and 127°.
The difference of composition between 1 and 2 origi-nates from the crystallization technique. Indeed, 1 is pre-pared at room temperature with the addition of heptane
for crystallization, while 2 is crystallized without any co-solvent at −24 °C. These two different methods give two different products: one thermodynamic compound 1 and one kinetic compound 2, which can be considered as solvates to each other [66].
In the structure of the compounds 1 to 7, an inherent stoichiometric ratio of two Li+ for one Co2+ exists, hence
excess of one equivalent Li+ with respect to the desired
LiCoO2. During the firing, this excess of Li+ in the
pre-cursor tends to form lithium carbonate either by reac-tion with the CO2 in air or with the byproducts of the
combustion. The carbonate can clearly be seen in pow-der X-ray diffractogram of the raw oxide. However, these impurities, as well as the main byproduct LiCl (formation of the precursors), can be easily washed away with water. Successful removal of LiCl was confirmed by powder X-ray diffraction as well as TEM/SEM.
For the compounds 8–12, except 11, the stoichiomet-ric ratio is 1:1 for Li+ to Co2+, thus there is no excess
Li+ and hence almost no formation of lithium carbonate
Fig. 20 (Pro‑)inflammatory response of the multicellular epithelial tissue barrier following 24 h exposure to nano‑sized and micron‑sized nanoparti‑
cles at the three different test concentrations. Graphs show the results for the specific (pro‑)inflammatory mediators chosen; tumor necrosis factor‑α (TNF‑α) and interleukin‑8 (IL‑8). Lipopolysaccharide ([100 µl of 1 µg/ml]) served as the positive assay control, whilst the negative control was cell culture medium only. Data is presented as the mean ± standard error of the mean. #indicates a statistically significant response (p > 0.05) compared
to the negative control
Fig. 21 Schematic representation with numbering of the
(Additional file 1). While we produced our nanoscale materials in quite pure form by this washing step, the analysis of the commercial HT-LiCoO2 shows that it
con-tains some Li2CO3 impurities, which is one of the
reac-tants of its synthesis.
The main physical/chemical differences in the final oxides obtained at 450 °C from 1 and 8–12 are the amount of impurities due to stoichiometric reasons and the size of the particles/crystallites obtained. Indeed, the LiOPh precursor 1 tends to form more impurities (car-bonates, XRD in Additional file 1: Fig. S7) and a larger crystallite size. The amount of impurity is mainly due to the incorrect stoichiometric ratio in the starting struc-ture of 2:1 for Li:Co, but also to a large amount of carbon atoms in the precursor. However, by decreasing the num-ber of carbon atoms using alkoxide and by balancing the ratio between Co and Li to 1:1, better results in terms of size and smaller amounts of byproducts can be achieved. As shown in the Table 4, sizes as low as 60 nm of HT-LCO can be obtained.
We observed different LCO morphologies from the single source precursors. This could be related to the for-mation of LCO nuclei, which likely depend on the initial structure of the complex precursor. Not only the core structure, but also the arrangement of the molecules with respect to each other may play a role in the formation of different nuclei.
The redox potentials indeed confirm that the obtained nano-LiCoO2 is in the HT-LCO phase. We also
recog-nized that the oxidation of Co3+ to Co4+ (corresponding
to Li+ extraction from Li
1−xCoO2) shows higher
cur-rent than the reduction of Co4+ to Co3+ (Li+ insertion
into Li1−xCoO2). The cyclic voltammograms (CV) of
both samples obtained from 12 and 8 show a HT-LCO CV profile with a low polarization and high potential, as expected from the X-ray diffraction pattern.
In terms of the Li+ diffusivity, hence the kinetic with
respect to Li+ ions, we found it to be much faster in
nanoscale LCO than in micron-LCO. In other words, the amount of Li+ ions available for electrochemistry is larger
in nanoscale LCO than that in micron-LCO due to the shorter path length of the Li+ ion diffusion. The values
obtained are >20 times higher than the standard value for HT-LCO [64]. In the best case measured in our hands, 77%, of all Li+ ions were extracted from and re-inserted
in the structure of nano-HT-LCO, while for the com-mercial material, only about 50% of Li+ ions (0 < x < 0.5,
Li1−xCoO2) can be used electrochemically in the
rhom-bohedral layered structure of LiCoO2. Further
de-lith-iation of commercial, micro-HT-LCO induces a phase transformation to the monoclinic system [17], resulting in irreversible capacity loss upon cycling. Therefore, the phase stability of LiCoO2 is important during lithiation
and de-lithiation in order to obtain high coulombic effi-ciency and longer cycleability of battery. This is what we could show for the nano-HT-LCO after battery cycling by analyzing the material by XRD. Hence, our LCO materi-als prepared by heterobimetallic single source precursors are stable upon cycling and provide fast electrochemi-cal reactions with Li+ ions due to nanosized particles.
Table 6 Comparison of compounds 1 to 5 and 9
1 2 3 4 5 9 Tetrahedral volume of Co (Å3) 3.332 3.384 3.344 3.364 3.339 3.229 Quadratic elongation 1.093 1.088 1.092 1.079 1.100 1.120 Angle variance (°2) 378.27 360.86 374.83 322.26 401.40 486.42 O1–Co (Å) 1.961 (6) 1.960 (7) 1.95 (1) 1.954 (3) 1.958 (4) 1.954 (4) 1.947 (3) 1.949 (3) O2–Co (Å) 1.948 (5) 1.957 (6) 1.93 (1) 1.963 (4) 1.955 (3) 1.962 (4) 1.960 (3) O3–Co (Å) 1.963 (5) 1.946 (6) 1.961 (8) 1.954 (3) 1.966 (3) 1.978 (4) 1.958 (4) O4–Co (Å) 1.972 (6) 1.960 (6) 1.966 (7) 1.952 (4) 1.961 (4) 1.938 (4) / Mean O–Co (Å) 1.961 1.956 1.952 1.956 1.960 1.958 1.953 O1–Co–O2 (°) 84.9 (2) 86.5 (3) 85.7 (1) 86.8 (2) 86.6 (2) 85.6 (2) 80.2 (1) O3–Co–O4 (°) 86.0 (2) 85.2 (3) 85.1 (4) 87.5 (1) 87.0 (2) 84.8 (2) 83.9 (2) O1–Co–O4 (°) 122.4 (2) 121.0 (3) 125.6 (4) 118.6 (1) 122.7 (2) 126.5 (2) 124.4 (2) O2–Co–O3 (°) 118.4 (2) 120.0 (3) 123.0 (4) 117.6 (2) 125.0 (1) 112.4 (2) 125.2 (1) Mean O–Co–O (°) 85.45 120.4 85.85120.5 85.4124.3 86.98120.98 85.2119.45 82.0124.8 BVS on Co 1.93 1.96 1.98 1.96 1.94 1.95 1.97 BVS on Li 1.17 1.14 1.131.14 1.131.07 1.191.17 1.131.14 1.191.25 1.18
The LCO materials prepared from various complexes showed different specific capacities. This difference may be related to several parameters such as the homogeneity of particle size, ball milling and the shape of LCO parti-cles. Also, when a particle size distribution is broad, the specific capacity can be less good than the one from the narrower size distributed particles. The large size differ-ence can lead to different Li+ diffusion kinetics. However,
the larger particles can be broken during ball milling and the size distribution becomes narrower, improving the kinetics of Li+ diffusion and finally the specific capacity.
The shape of LCO particle can also affect the diffusion of Li+ because Li+ diffuses in a specifically oriented layer of
the structure.
The smaller particle size provides higher diffusion kinetics with Li+ because the higher surface area of
nano-LiCoO2 provides more Li+ ions to be released and
uptaken into/from the electrolyte. In addition to the high surface area, there is another parameter governing the diffusion kinetics, which is the orientation of Li+
diffu-sion path in the lattice structure of LiCoO2. Li+ is located
in one layer of the LiCoO2 lattice cell, diffusing in one
preferred orientation. Thus, the length of Li+ diffusion
path in LiCoO2 also affects the diffusion kinetics. We
reported that the diffusion of Li+ is not only related to
the size of particle but also the shape of particle due to the preferred diffusion direction and its length in the lat-tice structure [67, 68]. In this regard, the higher diffusion coefficient of 40 nm (compound 8) is probably coming from the shorter diffusion path of Li+ in a single particle
although the compound 12 has a smaller size of 15 nm. We also found that LiCoO2 produced from LiOtBu has
a larger overpotential and higher resistance than the one obtained from LiOPh. On the other hand, the LiCoO2
electrode formed from LiOMe reached >120 mAh/g of charge capacity. However, the discharge capacity was 90 mAh/g with 70% of coulombic efficiency. These dif-ferences of equilibirum charge/discharge curves can be explained by different kinetics at equilibrium state.
The deep discharge measurement supports that the discharge capacities at higher current densities (>C/2) are lower in LiCoO2 electrode with LiOPh than those in
LCO with LiOiPr (Fig. 16). Therefore, the kinetics of the
electrode (a) obtained from LiOiPr is an order of
magni-tude faster than (b) (obtained from LiOPh) at high cur-rent densities.
The electrochemical properties of batteries are influ-enced by not only the active material but also the com-posite, consisting of carbon and the active material [69]. The structural morphology and the physicochemical properties of composite affect the electron transfer and
lithium ion diffusion in the electrode [64]. An ongoing follow-up study is hence the optimization of the elec-trode composites for each nanoscale HT-LCO material as a function of precursor.
In terms of the biological assessment, such studies had never been done on nanoscale LCO and are quite rare for battery materials in general. We found both nano- and micro-LCO to be relatively low toxic in the lung model which we used. The (pro-)inflammatory response upon exposure to nano-LCO was nil across all tested concen-trations, while it was dose-dependent for micro-LCO. Neither nanoparticles nor micro-LCO induce a cytotoxic effect at the tested concentrations which leads to more than 15% cell death. In terms of the surface charges of nano and microparticles, we estimate it is low since both particles rather stick together [70].
Conclusions
A series of 12 new precursors containing lithium and cobalt ions in ratios of 2:1 or 1:1 with different aryl- and alkoxide ligands have been prepared and characterized. Their thermal decomposition leads to the formation of nanoscale HT-LiCoO2 with the size of the so obtained
nanoparticles depending on the precursor. Also, pre-cursors with a 1:1 ratio of Li+ to Co2+ lead to quite
pure product, while the precursors with a 2:1 ratio gave Li2CO3 as byproduct. The use of our precursors allowed
lowering the production temperature and time for the generation of HT-LiCoO2 as a preorganisation of the
metal ions takes place in the starting material. The nano-materials of LiCoO2 showed a superior Li-ion diffusivity
by a factor of 20–100 compared to commercial LiCoO2,
depending on the precursor used to generate the cathode material. The electrochemical performance was varied depending on the precursors. LiCoO2 with LiOPh and
LiOiPr provided higher specific capacities while LiCoO
2
with LiOMe and LiOtBu obtained lower specific capaci-ties. Lithium ion diffusion coefficients of our nanoscale LiCoO2 were >10 times higher than the one of microscale
LiCoO2 due to the shorter path length of lithium ion
dif-fusion in nanomaterial of LiCoO2. This means that high
surface area of nanoscale LiCoO2 can release and take
Li+ ions much more than micron LiCoO
2 material at the
same condition.
To mimick conditions of recycling of batteries, nano-powders of LiCoO2 were tested on a lung cell model.
During the spraying of the powders, it was shown that the nanopowders tend to aggregate during the process due to a low zeta-potential. Nevertheless, they are slightly more toxic than the micron-scale material, while toxicity remained overall very low.