HAL Id: hal-00941801
https://hal.archives-ouvertes.fr/hal-00941801
Submitted on 4 Feb 2014
HAL is a multi-disciplinary open access
archive for the deposit and dissemination of
sci-entific research documents, whether they are
pub-lished or not. The documents may come from
teaching and research institutions in France or
abroad, or from public or private research centers.
L’archive ouverte pluridisciplinaire HAL, est
destinée au dépôt et à la diffusion de documents
scientifiques de niveau recherche, publiés ou non,
émanant des établissements d’enseignement et de
recherche français ou étrangers, des laboratoires
publics ou privés.
OBIA for combining LiDAR and multispectral data to
characterize forested areas and land cover in a tropical
region
S. Dupuy, G. Laine, T. Tormos
To cite this version:
S. Dupuy, G. Laine, T. Tormos. OBIA for combining LiDAR and multispectral data to characterize
forested areas and land cover in a tropical region. 4th International Conference on Geographic
Object-Based Image Analysis (GEOBIA), May 2012, Rio de Janeiro, Brazil. 7 p. �hal-00941801�
* Corresponding author.
OBIA for Combining LiDAR and multispectral data to ChARACTERIZE forested AREAS
AND land cover in TROPICAL REGION
S. Dupuya, *, G. Lainéa, T. Tormosb
a
CIRAD, UMR TETIS, Earth Observation and Geo-information for Environment and Land Management,
Montpellier, F-34398 France - stephane.dupuy@cirad.fr
b IRSTEA, UR MALY, Pole ONEMA/IRSTEA freshwater hydroecology, Lyon, F69336, France
-thierry.tormos@onema.fr
KEY WORDS: LiDAR, Multispectral data, DCM, Canopy horizontal heterogeneity, Tropical forest, Mayotte
ABSTRACT:
Prioritizing and designing forest restoration strategies requires an adequate survey to inform on the status (degraded or not) of forest types and the human disturbances over a territory. Very High Spatial Resolution (VHSR) remotely sensed data offers valuable information for performing such survey. We present in this study an OBIA methodology for mapping forest types at risk and land cover in a tropical context (Mayotte Island) combining LiDAR data (1 m pixel), VHSR multispectral images (Spot 5 XS 10 m pixel and orthophotos 0.5 m pixel) and ancillary data (existing thematic information). A Digital Canopy Model (DCM) was derived from LiDAR data and additional information was built from the DCM in order to better take into account the horizontal variability of canopy height: max and high Pass filters (3m x 3m kernel size) and Haralick variance texture image (51m x 51m kernel size). OBIA emerges as a suitable framework for exploiting multisource information during segmentation as well as during the classification process. A precise map (84% total accuracy) was obtained informing on (i) surfaces of forest types (defined according to their structure, i.e. canopy height of forest patches for specific type); (ii) degradation (identified in the heterogeneity of canopy height and presence of eroded areas) and (iii) human disturbances. Improvements can be made when discriminating forest types according to their composition (deciduous, evergreen or mixed), in particular by exploiting a more radiometrically homogenous VHSR multispectral image.
introduction 1.
Sustainable forest management requires fine-scale knowledge of their floristic composition and structure. Especially for tropical landscapes, which contain a high spatial heterogeneity and are often poorly accessible, it is highly recommended to make use of remotely sensed data to benefit from exhaustive mapping information (Chambers et al., 2007, Leckie, 1990). Most of mapping projects have thus been achieved using photo-interpretation of aerial photographs but this classification method is neither easily implemented nor reproducible on large territories (St-Onge et al., 2007). Other studies were attempted for performing classification of forest composition and structure using semi-automatic methods (per pixel or per objects) on Very High Spatial Resolution (VHSR) multi-spectral information (Asner et al., 2003), but deriving the composition and especially the structure based only on spectral information is quite challenging (Vepakomma et al., 2008). That is why some works take advantage of vegetation height information from LiDAR data in complement to multispectral information (Ke et al., 2010, Rottensteiner et al., 2005, Straatsma et al., 2008). Vegetation height can inform on canopy gaps which is often a good indicator of forest canopy heterogeneity that can be linked to forest stands or degradation status of these stands (Vincent et al., 2010). However, most of
the works use both sources in parallel, using one type at a time, without benefiting of the potential gain when combining both of them in the same classification (Bork et al., 2007). We propose in this paper an OBIA methodology designed for combining LiDAR and multispectral data in order to produce a land cover map dedicated for characterizing forest areas at risk in a tropical landscape context.
data and method 2.
Study area and classification scheme 2.1
The methodology was designed and implemented in Mayotte. Mayotte is an island of the Comoro Archipelago located at the entrance of the Mozambique Channel (Figure 1). The remaining areas of native forests of Mayotte are found primarily over the five forest reserves (5550 ha = 15% of the territory). However, forest complexes are more or less degraded, inside and outside reserves, because of direct (agro-forestry) and indirect (proliferation of an invasive species of liana) human disturbances. As a result, a precise survey dedicated to the status (degraded, potentially degraded and not degraded) of forest types inside and outside reserves is a key step to prioritize and define efficiently forest restoration strategies.
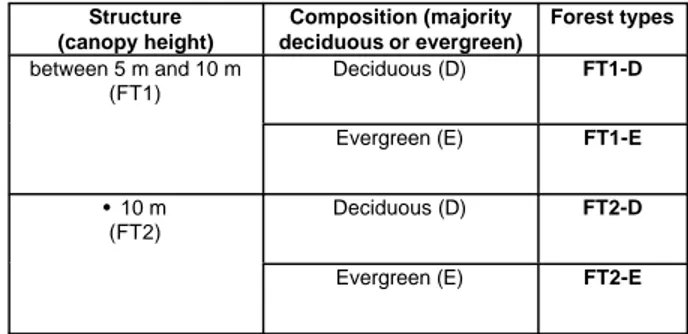
Figure 1: Location of Mayotte Island (375 km²) Field observations and measurements, conducted with scientists specialized on tropical forests, led to distinguish (excluding mangrove forest and tree plantation) four major forest types (see Table 1) according to: (i) the structure, i.e. the average height of the canopy (hc); and (ii) composition, dominance of deciduous or evergreen trees (Lainéet al., 2010).
As (Parkeret al., 2004), we also noted that most forest types
with a high heterogeneity of canopy height often correspond to degraded forested areas. The collapse of lianas and practices in
agro-forestry (clearing, burning…) leads to gaps in canopy. Based on this field information a specific classification scheme was designed for performing this survey (see Table 2). Such a classification scheme will allow managers to have a reliable spatial knowledge concerning (i) surfaces of different types of forest areas; (ii) the localization of degraded (eroded areas) or potentially degraded forested areas (according to the heterogeneity of the canopy) and (iii) human pressures (other land cover categories).
Structure (canopy height) Composition (majority deciduous or evergreen) Forest types between 5 m and 10 m (FT1) Deciduous (D) FT1-D
Evergreen (E) FT1-E
• 10 m (FT2)
Deciduous (D) FT2-D
Evergreen (E) FT2-E
Table 1. Definition of major forest types observed in Mayotte according to the structure and composition
Level 1 Level 2 Code Data source used in
classification Forested
areas
FT1-D not degraded : FT1 with low horizontal heterogeneity FT1-D-nd A+B FT1-D potentially degraded : FT1 with high horizontal heterogeneity FT1-D-pd A+B FT1-E not degraded: FT2 with low horizontal heterogeneity FT1-E-nd A FT1-E potentially degraded: FT2 with high horizontal heterogeneity FT1-E-pd A FT2-D not degraded : FT3 with low horizontal heterogeneity FT2-D-nd A+B FT2-D potentially degraded : FT3 with high horizontal heterogeneity FT2-D-pd A+B FT2-E not degraded: FT4 with low horizontal heterogeneity FT2-E-nd A FT2-E potentially degraded: FT4 with high horizontal heterogeneity FT2-E-pd A Forest plantation : plantation of acacia mangium, Adenanthera
pavonina,Calophyllum inophyllum, Samanea samanTerminalia catappa, ou T. superba
FP C
Mangrove Mg C
Collapsed forest area: collapse due to the high presence of lianas those results in a huge gap in the canopy.
Lia C
Eroded areas Bare soil on eroded area : badlands subject to active erosion Ero1 B + C Herbaceous on eroded area : grasses often crossed by the fire causing an
erosion
Ero2 B + C
Fern on eroded area : proliferation of dicranopteris linearis, which affects the leached soil making them unfit for the colonization by ligneous species
Ero3 B + C
Urban areas Built up area Urb1 C
Main road Roads C
Other artificial surface: green urban areas, sport and leisure facilities… Urb2 C
Mine, dump and construction site Urb3 C
Other land cover categories
Bare saline soil: bare soil in Mangrove forest called “tanne” tanne C Shrub cover: natural or agricultural vegetation with canopy height between 1.5
m and 5 m
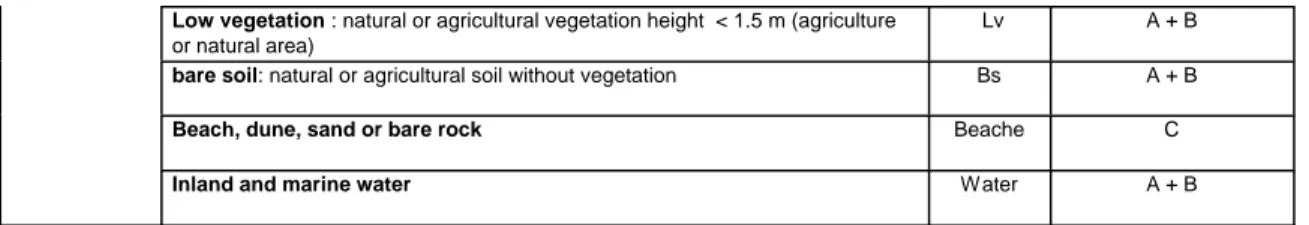
Low vegetation : natural or agricultural vegetation height < 1.5 m (agriculture or natural area)
Lv A + B
bare soil: natural or agricultural soil without vegetation Bs A + B
Beach, dune, sand or bare rock Beache C
Inland and marine water Water A + B
Table2. Classification scheme (A = LiDAR derived data; B = multispectral data; C = thematic data, see Table 1 for forest types) Dataset Spatial resolution Information Producer Acquisition date
LiDAR 1 m vertical information IGN October 2008
Orthophotos 0.5 m Spectral information in B, G, R, NIR
IGN November 2008
Spot 5 XS 10 m Spectral information in G, R, NIR, SWIR
Spot Image June 2005
Thematic vector data Metric precision forest plantation, mangrove, eroded area, collapsed forest stands with liana, built up area, main road, other artificial
surfaces, mine dump and construction site
Our team by photo-interpretation of the 3
different remotely sensed data and use of
regional topographic map
Between 2007 and 2008
Table 3. Dataset characteristics (DTM = digital terrain model; DSM = digital surface model; B = blue; G = green; R = red; NIR = near infra red; SWIR = short wave infra red; IGN = French Geographic Institute)
Dataset and pre-processing 2.2
Characteristics of remotely sensed data employed in this study are summarized in Table 3.
LiDAR data over the study area come from the Litto3D project (Sauret al., 2008) dedicated to produce a precise topographic
and bathymetric model of the entire French coast (including Mayotte). A Digital Surface model (DSM) and a Digital Terrain Model (DTM) built with a spatial resolution of 1m x 1m was produced by IGN (French Geographic Institute) using an adaptive triangulated irregular network algorithm (Axelsson, 2000, Véga et al., 2010) from the software
TerraScan (Terrasolid Ltd, Finland). We produced the Digital Height Model (DHM) from the difference between DSM and DTM (Naesset, 1997). We applied a 3m x 3m median filter on DHM for deriving the digital canopy model (DCM, see Figure 3) (Popescuet al., 2002). In order to better take into account
the spatial variation of the canopy height, we performed (i) two filtered images derived from the DCM using 3m x 3m kernel: Max and High Pass filters; and (ii) Haralick variance texture image (Haralicket al., 1973) computed for all direction using a
51 m x 51 m kernel size.
Two types of multispectral images (see Figure 2) were acquired on the study zone: orthophotos (0.5 m pixels) required for precisely delimiting small objects, and Spot 5 XS satellite images (10 m pixel) for better discriminating vegetation covers using both short wave and near infra red information (Muller, 1997). Orthophotos are orthorectified airborne images provided by IGN from the BD Ortho® (Paparoditis et al., 2006). 803 orthophotos (1km*1km each)
were acquired in November 2008 for covering the whole of island. One Spot 5 XS satellite image was acquired for covering the study zone in June 2005. It was not acquired at the same period of the other remotely sensed data because no satellite images were available among unclouded archive images. The satellite image was ortho-rectified based on
orthophotos using the LPS module of Erdas Imagine software. All multispectral images were re-sampled to the same resolution of the DCM using the cubic convolution interpolation algorithm.
In a previous study, conducted by our team with the administrative services of Mayotte, a vector map informing on - forest plantation, mangrove, eroded area, collapsed forest stand (linked to lianas), built up area, main road, mine, dump and construction site, other artificial surface, beaches and bare saline soil - was produced with a metric precision from both photo-interpretation of remotely-sensed data presented in this study and available regional topographic data. This map was used as ancillary data in addition to remotely sensed data.
OBIA procedure 2.3
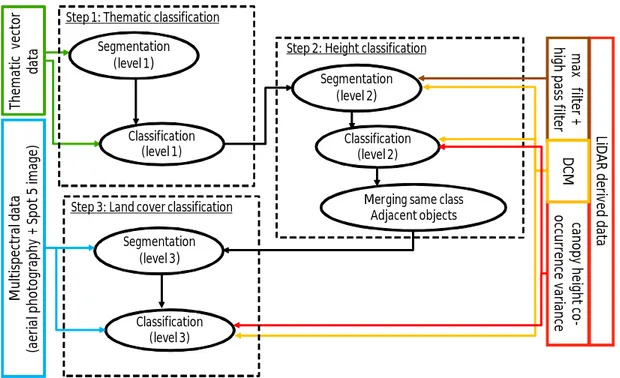
We propose an object-based procedure in three successive segmentation/classification levels implemented with the eCognition Developer 8 software using the multi-resolution segmentation algorithm (Baatz, 2000, Benz, 2004, Trimble, 2011) and membership functions classification method. The workflow of this procedure is presented in Figure 2. Segmentation parameters at each level are summarized in Table 4.
Level 1: Thematic classification
2.3.1
The first segmentation/classification step consists in masking and classifying the studied zone according to existing thematic data. Segmentation was based only on thematic vector data. The studied zone is thus segmented according to the limits of thematic data entities. Then, the resulting image objects are assigned – or not – to a thematic class using Boolean rules. Segmentation parameters at this level are presented in Table 4. The major aim of the following segmentation/classification levels is to classify non-thematic objects that may be water, bare soil, low vegetation or the different forested areas classes
(see Table 2).
Level 1 Level 2 Level 3 scale parameter 200 40 35 shape 0.9 0.7 0.1 compactness 0.5 0.4 0.5 spectral bands (weight) not used MNC (1) High pass filter (1) maxfilter (1) Spot 5 (1) aerial photo-graphy (2) Thematic vector data
used not used not used
Table 4: Segmentation, parameters for each OBIA level Level 2: Height classification
2.3.2
The second segmentation/classification step consists in classifying cover heights on non-thematic objects of level 1.
Within the boundaries of the first segmentation level, a second segmentation level was based on the DCM and the Max and High Pass filters. Parameters for segmentation (see Table 4) were empirically determined by visual interpretation especially focused on forest areas objects (se Figure 4). We obtained a quite good delineation between (i) the two forest stands observed in the field (forest area with low height canopy and high height canopy); and (ii) forest areas, shrub cover and low vegetation. The resulting image objects are first assigned according to 4 height classes (• 1.5 m; ]1.5 – 5m]; ]5 – 10m[; • 10 m) using Boolean rules based on DCM values. The two upper height classes correspond to forested areas. Each of them has been separated into two classes (high and low heterogeneity) according to the horizontal canopy heterogeneity as defined by the Haralick variance texture image derived from the DCM. Threshold between low and high heterogeneity was defined by expert visual interpretation. Finally, a merging of neighbouring objects of the same class is performed.
Segmentation (level 2)
Classification (level 2)
Merging same class Adjacent objects Step 2: Height classification
LiDAR derived data
canopy height co -occurrence variance max filter + high pass filter DCM Multispectral data (aerial photography + Spot 5 image) Thematic vector data Segmentation (level 1) Classification (level 1) Step 1: Thematic classification
Segmentation (level 3)
Classification (level 3) Step 3: Land cover classification
Figure 2: Workflow of OBIA procedure combining Lidar, muti-spectral and thematic data
Level 3: Land cover classification
2.3.3
The third segmentation/classification level aim is two-fold: (i) to classify the different forested types objects discriminated at level 2 according to their composition (deciduous or evergreen); and (ii) to classify the two lowest height class objects discriminated at level 2 and the eroded area objects extracted at level 1 following the land cover categories defined in Table 1. Only one segmentation level, based on limits built in level 2 and multispectral information, was required to satisfy this double aim. Parameters for segmentation (see Table 4) were empirically determined by visual interpretation. The resulting image objects were classified from multi-spectral information. For example, the “• 1.5 m height” class was divided into three classes: “inland and marine water”
characterized by low mean values in near-infrared information from Spot 5 XS image; “bare soil” defined by low mean values in green information from orthophotos; and “low vegetation” that is not “inland and marine water” and “bare soil”.
Map validation 2.4
Map validation was performed using a confusion matrix (Giles M, 2002). Our first aim was to assess the accuracy of all categories obtained with at least one source of remotely sensed data (see Table 1). However, as composition classes (deciduous or evergreen) were difficult to obtain over the whole island (see 3.1 for reasons), forested areas with the same structure and heterogeneity were regrouped before computing the matrix. Therefore, we got at least information about the
accuracy of forest types as defined by the heterogeneity of their structure and status.
Objects have been chosen as sampling units for control data and the confusion matrix is computed according to the object number (and not in pixels). Control data were derived from field measurements carried out in August and October 2009 and January 2010. Field measurements were acquired in accordance with a simple ecological stratification into 12 units (4 classes of temperature and 3 classes of precipitation). In total, 517 control data were selected: 188 for forested types, 130 for low vegetation, 96 for shrub cover, 93 for eroded areas and 10 for inland and marine water class. Usual statistics were extracted from the confusion matrix.
Result and discussion 3.
Map accuracy 3.1
A subset of the resulting map is proposed Figure 3. According to the confusion matrix, 84% of the control objects were correctly classified. This global accuracy is confirmed by the kappa index value of 80, which means that 80% of the objects would appear well classified according to any completely random validation process. Highly accurate results (•80%) were obtained for forest types (defined by the structure and heterogeneity), for shrub and low vegetation and fern eroded area classes. The poorest accuracy was for bare soil on eroded area (69%) and herbaceous on eroded area (58%) classes because of (i) confusion between these two classes due to their similar spectral behavior; and (ii) radiometric heterogeneity of data source used for the discrimination of these classes (orthophotos).
The radiometric heterogeneity, between the numerous orthophotos covering the whole island, was also the major difficulty in this study when characterizing forest types according to their composition (evergreen and deciduous), in addition to the high presence of shadow on orthophotos (located especially on relief zone). Although the Spot 5 satellite image comprises fewer shadows and is more homogenous in radiometry, it was not efficient because its spatial resolution is not sufficient for this discrimination. It would be interesting to acquire other satellite data (a more radiometrically homogenous image) with higher spatial resolution (QuickBird 0.5 m pixels or Pleiades 0.5 m pixels for example) at suitable acquisition period (October) for enhancing discrimination between evergreen and deciduous forest types.
Figure 3: Subset of images data and natural areas map (Hm = mean of Height and HH = Horizontal Heterogeneity)
Combining Lidar and Multispectral data in OBIA 3.2
This study demonstrates that OBIA is a suitable framework for combining multisource information, as observed by other studies (e.g., Durieux et al., 2008, Tormos et al., 2012). In this study, multisource information (especially LiDAR and Multispectral data) was combined in the delineation of the objects of interest (thanks to the image object hierarchy property of the multi-resolution segmentation algorithm) as well as in the classification process.
In the delineation of the objects of interest, LiDAR combined with multispectral data was necessary in order to correctly delineate the different degraded or non degraded forest types. LiDAR data for identifying forest types according to their structure (canopy height) and canopy degradation level (horizontal heterogeneity of canopy height) and multispectral data based on these limits for delineating objects according to the composition (see Figure 4).
Figure 4. Illustration of the complementarities of LiDAR and Multispectral data for delineating forest types according to
their structure and composition.
Conclusion 4.
Through this study it can be argued that OBIA is a suitable framework for exploiting multisource information, during segmentation as well as during the classification process. It allows a better mapping performance than parallel use of multisource data. LiDAR data was found particularly favourable for characterizing forest types in a tropical context, due to the information it provides on canopy height and their heterogeneity. Improvements must be made in the discrimination of forest types according to their composition (deciduous, evergreen or mixed), in particular by exploiting a more radiometrically homogenous very high spatial multispectral image (such as Pleiades or Quickbird images) acquired at a suitable period. The high radiometric variability, between the numerous orthophotos acquired for covering the whole island, was the great drawback for obtaining a reliable map of forest types that also include their composition. With these improvements, such mapping will allow managers to prioritize and define forest restoration strategies.
ACKNOWLEDGMENTS
The study was funded by the European Fund for Development. We thank our colleagues Jacques Tassin and Jean-Michel Sarrailh (CIRAD UPR BSEF) for their collaboration in this study. We also wish to thank the people of the “Direction de l’Agriculture de l’Alimentation et de la Forêt” and the “Conseil Général” of Mayotte, that allowed us to carry out this project.
REFERENCES
Asner, G.P. et Warner, A.S., 2003. Canopy shadow in
IKONOS satellite observations of tropical forests and savannas. Remote Sensing of Environment, 87(4), pp. 521-533. Axelsson, P., 2000. DEM generation from laser scanner data using adaptive TIN models. International Archives of
Photogrammetry and Remote Sensing, 33(B4/1; PART 4), pp.
111-118.
Baatz, M., Schäpe, A., 2000. Multiresolution Segmentation: an optimization approach for high quality multi-scale image segmentation. Journal of Photogrammetry and Remote
Sensing, 58(3-4), pp. 12–23.
Benz, U.C., Hofmann, P., Willhauck, G., Lingenfelder, I., Heynen, M., 2004. Multi-resolution, object-oriented fuzzy analysis of remote sensing data for GIS-ready information.
Isprs Journal of Photogrammetry and Remote Sensing,
58(3-4), pp. 239-258.
Bork, E.W. et Su, J.G., 2007. Integrating LIDAR data and multispectral imagery for enhanced classification of rangeland vegetation: A meta analysis. Remote Sensing of Environment, 111(1), pp. 11-24.
Chambers, J.Q., et al., 2007. Regional ecosystem structure and
function: ecological insights from remote sensing of tropical forests. Trends in Ecology & Evolution, 22(8), pp. 414-423. Durieux, L., et al., 2008. A method for monitoring building
construction in urban sprawl areas using object-based analysis of Spot 5 images and existing GIS data. Isprs Journal of
Photogrammetry and Remote Sensing, 63(4), pp. 399-408.
Giles M, F., 2002. Status of land cover classification accuracy assessment. Remote Sensing of Environment, 80(1), pp. 185-201.
Haralick, R.M., et al., 1973. Textural Features for Image
Classification. Systems, Man and Cybernetics, IEEE Transactions on, 3(6), pp. 610-621.
Ke, Y., et al., 2010. Synergistic use of QuickBird multispectral
imagery and LIDAR data for object-based forest species classification. Remote Sensing of Environment, 114(6), pp. 1141-1154.
Lainé, G., et al., 2010 Etude de la Typologie Forestière de
Mayotte, Final Report, Agrifor Consult - Cirad, Montpellier, France, pp. 220
Leckie, D.G., 1990. Advances in remote-sensing technologies for forest surveys and management. Canadian Journal of
Forest Research-Revue Canadienne De Recherche Forestiere,
20(4), pp. 464-483.
Muller, E., 1997. Mapping riparian vegetation along rivers: old concepts and new methods. Aquatic Botany, 58(3–4), pp. 411-437.
Naesset, E., 1997. Determination of mean tree height of forest stands using airborne laser scanner data. ISPRS Journal of
Paparoditis, N., et al., 2006. High-end aerial digital cameras
and their impact on the automation and quality of the production workflow. ISPRS Journal of Photogrammetry and
Remote Sensing, 60(6), pp. 400-412.
Parker, G.G. et Russ, M.E., 2004. The canopy surface and stand development: assessing forest canopy structure and complexity with near-surface altimetry. Forest Ecology and
Management, 189(1–3), pp. 307-315.
Popescu, S.C., et al., 2002. Estimating plot-level tree heights
with lidar: local filtering with a canopy-height based variable window size. Computers and Electronics in Agriculture, 37(1-3), pp. 71-95.
Rottensteiner, F., et al., 2005. Using the Dempster-Shafer
method for the fusion of LIDAR data and multi-spectral images for building detection. Information Fusion, 6(4), pp. 283-300. Saur, S., et al., 2008 Litto3D® V1.0 Spécifications techniques,
Institut Géographique National, pp. 14
St-Onge, B., et al., 2007. Mapping canopy height using a
combination of digital photogrammetry and airborne scanning laser altimetry. International Journal of Remote Sensing, 29(11), pp. 3343-3364.
Straatsma, M.W. et Baptist, M., 2008. Floodplain roughness parameterization using airborne laser scanning and spectral remote sensing. Remote Sensing of Environment, 112(3), pp. 1062-1080.
Tormos, T., et al., 2012. Object-based image analysis for
operational fine-scale regional mapping of land cover within river corridors from multispectral imagery and thematic data.
International Journal of Remote Sensing, 33(14), pp.
4603-4633.
Trimble, 2011. eCognition® Developer 8.64.1 User Guide.
Trimble Germany GmbH, Munich, Germany, pp.
Véga, C. et Durrieu, S., 2010. Extraction de parametres d'arbre a partir de modeles numeriques de canopee lidar. Revue
française de photogrammétrie et de télédétection, 191), pp.
62-71.
Vepakomma, U., et al., 2008. Spatially explicit characterization of boreal forest gap dynamics using multi-temporal lidar data. Remote Sensing of Environment, 112(5), pp. 2326-2340.
Vincent, G., et al., 2010. Détection des variations de structure
de peuplements en forêt dense tropicale humide par Lidar aéroporté (Small foot-print airborn LiDAR proves highly sensitive to changes in structure of moist tropical forest). Revue
Française de Photogrammétrie et Télédetection, 191(pp.