HAL Id: hal-02530668
https://hal.archives-ouvertes.fr/hal-02530668
Submitted on 16 Jun 2020
HAL is a multi-disciplinary open access
archive for the deposit and dissemination of
sci-entific research documents, whether they are
pub-lished or not. The documents may come from
teaching and research institutions in France or
abroad, or from public or private research centers.
L’archive ouverte pluridisciplinaire HAL, est
destinée au dépôt et à la diffusion de documents
scientifiques de niveau recherche, publiés ou non,
émanant des établissements d’enseignement et de
recherche français ou étrangers, des laboratoires
publics ou privés.
Atlantic cod in two populations of the Gulf of
Saint-Lawrence, Canada
Romain Lavaud, Yoann Thomas, Laure Pecquerie, Hugues P. Benoît, Thomas
Guyondet, Jonathan Flye-Sainte-Marie, Denis Chabot
To cite this version:
Romain Lavaud, Yoann Thomas, Laure Pecquerie, Hugues P. Benoît, Thomas Guyondet, et al..
Modeling the impact of hypoxia on the energy budget of Atlantic cod in two populations of the
Gulf of Saint-Lawrence, Canada. Journal of Sea Research (JSR), Elsevier, 2019, 143, pp.243-253.
�10.1016/j.seares.2018.07.001�. �hal-02530668�
Romain Lavaud
, Yoann Thomas
, Laure Pecquerie
, Hugues P. Benoît
, Thomas Guyondet
,
Jonathan Flye-Sainte-Marie
b, Denis Chabot
caGulf Region Center, Fisheries and Oceans Canada, Moncton, NB, Canada
bUBO, CNRS, Ifremer, IRD, Laboratoire des sciences de l'environnement marin (LEMAR), Plouzané, France cFisheries and Oceans Canada, Institut Maurice-Lamontagne, Mont-Joli, QC, Canada
A R T I C L E I N F O
Keywords: Hypoxia
Dynamic energy budget Atlantic cod Growth Temperature Gulf of Saint-Lawrence
A B S T R A C T
Like many marine species around the globe, several stocks of Atlantic cod (Gadus morhua) live in increasingly hypoxic waters. In the Gulf of Saint Lawrence (GSL) in Canada, the deep channels traversing the semi-enclosed sea exhibit year-round hypoxia, identified as one of the limiting factor for the recovery of GSL cod in its northern part. While many individuals in the northern GSL are known to venture in deeper, warmer, and more hypoxic waters of the Gulf channels, those in the southern GSL live in a shallower, colder, and more oxygenated en-vironment. In this study, we use the modeling framework of the Dynamic Energy Budget (DEB) theory to dis-entangle the effects of hypoxia, temperature and food on the life-history traits of these two populations of cod in the GSL. Following recent advances by Thomas et al. (2018, this issue) on the mechanisms for the effects of hypoxia within the context of DEB theory, we implemented a correction of ingestion depending on dissolved oxygen (DO) saturation. We successfully developed and validated a set of parameters for a GSL Atlantic cod DEB model. Using simulations of historical growth trajectories from 1990 until 2004 estimated from data collected throughfisheries research surveys, we found that temperature explained about half (48%) of the difference in length and 59% of the difference in mass between the two populations. The remaining proportion was attributed to exposure to hypoxia and food input. We also used our model to explore scenarios of duration, frequency, and intensity of hypoxia on cod's life-history traits, which showed that decreasing DO linearly reduces growth and reproduction while young cod seem to avoid impairing conditions resulting in limiting effects on developmental stages.
1. Introduction
Hypoxia in coastal marine ecosystems is a growing concern around the world, affecting a wide range of species (Zhang et al., 2010; Breitburg et al., 2018). It refers to low dissolved oxygen (DO) saturation levels. Hypoxic waters occur naturally in oxygen minimum zones, deep basins, upwelling areas of eastern boundary currents, and fjords (Helly and Levin, 2004). However, during the last century, the extent and severity of hypoxia has accelerated as a result of human activities (e.g. nutrient loading), and the number of areas suffering from human-caused coastal hypoxia has grown from 195 in the 1990s to over 500 in the 2000s (Diaz and Rosenberg, 2008;Breitburg et al., 2018). Hypoxic conditions in different systems vary across a wide range of temporal and spatial scales. Five broad categories of hypoxia can be defined, depending on their duration: permanent, persistent seasonal, both
stratified and vertically mixed, episodic, and diel (Kemp et al., 2009). Consequences of hypoxia on marine organisms can be observed directly at the individual level. Reduction of DO levels modifies beha-vior and physiological processes such as feeding, ventilation or endo-crine functions, leading to reduced growth, reproductive success, re-sistance to diseases, and increased mortality (see e.g. Wu, 2002; Rabalais et al., 2010;Claireaux and Chabot, 2016). At the population and community levels, such changes can result in the reduction of suitable habitat, altered migration, losses of biomass and species rich-ness, or even massive mortality (Rabalais et al., 2002;Vaquer-Sunyer and Duarte, 2008;Ekau et al., 2010).
Mechanistic modeling appears as a suitable tool to quantify the response of marine organisms to various stressors (Hartman and Brandt, 1995;Claireaux et al., 2000;Miller Neilan and Rose, 2014;Deutsch et al., 2015). Within the variety of possible modeling approaches, our
https://doi.org/10.1016/j.seares.2018.07.001
Received 31 January 2018; Received in revised form 1 June 2018; Accepted 2 July 2018
⁎Corresponding author.
E-mail address:romain.lavaud@dfo-mpo.gc.ca(R. Lavaud).
Available online 04 July 2018
work is based on Dynamic Energy Budget (DEB) theory, which has been particularly successful for integrating multi-stressor effects on species life-history traits (e.g.Freitas et al., 2010;Galic et al., 2017;Kooijman, 2017; Lavaud et al., 2017). DEB theory quantifies, at the individual level, energy uptake and use through metabolicfluxes, which modulate the dynamics of life-history traits: growth rate, development, re-production and mortality (Kooijman, 2010). The DEB model takes into account the complete life cycle, from the embryo to juvenile and adult stages and considers that mechanisms responsible for metabolic orga-nization are not specific and thus apply to all organisms (micro-or-ganism, plants, and animals). This offers a sufficiently general frame-work to explore geographical intraspecific differences or interspecific variability through the comparison of model parameters (Kooijman, 2017) given relatively simple environmental forcing.
A recent study byThomas et al. (2018, this issue) reviewed the ef-fects of hypoxia on several metabolic functions in marine organisms and explored potential mechanisms for these effects within the context of DEB theory. These authors studied Atlantic cod in particular, based on controlled experiments performed by Chabot and Dutil (1999), which showed that the main effect of hypoxia in controlled conditions could be applied to ingestion.
Atlantic cod (Gadus morhua) is an iconic species for North Atlantic fisheries, facing important challenges from its changing environment, the pressure of human activities and, in some populations, intense predation (Shelton et al., 2006;Swain and Benoît, 2015). The recovery of the stocks to a healthy state is a priority, which requires a better understanding of the environmental and ecological factors impacting cod populations. As in other regions, the two cod stocks found in the Gulf of Saint Lawrence (GSL) suffered from intense fishing activities until a first moratorium was declared in 1993. Recovery has been slowed in the northern GSL (nGSL) population, in part as a result of renewedfishing since the late 1990s. Meanwhile, the population in the southern GSL (sGSL) continues to decline despite a very low fishing mortality, as a result of an elevated rate of natural mortality among adults (Swain and Benoît, 2015). Cod from the GSL are well recognized for being among the slowest growing of Atlantic cod stocks (Brander, 1995; Campana et al., 1995), which contributes to their lower pro-ductivity. Among the hypotheses to explain this growth pattern, cold temperatures appear to be the predominant contributor (Neuheimer and Taggart, 2007), but cod from these stocks are also exposed to hy-poxia (D'Amours, 1993;Chabot and Dutil, 1999).
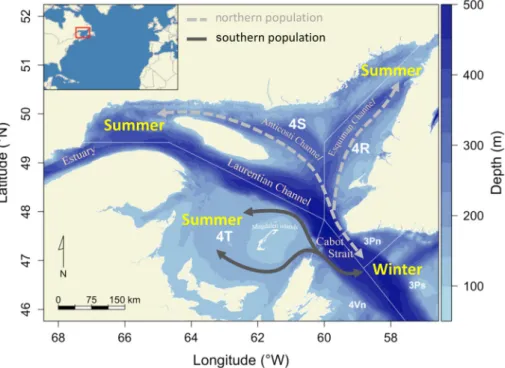
The GSL is a large (230,000 km2) semi-enclosed sea with an average depth of 152 m traversed by three deep troughs: the Laurentian, Esquiman and Anticosti channels (300–540 m,Fig. 1). Communication between the GSL and the Atlantic is through Belle Isle Strait in the northeast and the large Cabot Strait to the southeast. A mix of Labrador Current water (cold, rich in oxygen) and North Atlantic central water associated with the Gulf Stream (warmer, poor in oxygen) enters into the GSL through the mouth of the Laurentian Channel, south of New-foundland, and moves toward the head of the channels (Bugden, 1991; Gilbert and Pettigrew, 1997). Surface water is characterized by a large seasonal variation in temperature and low salinity caused by a high annual river runoff. Waters deeper than ~150 m are relatively warm (3–6 °C) and salty (> 33) and remain isolated from surface waters by a permanent halocline. In summer, vertical stratification is enhanced by the formation of a thermocline, the cold intermediate layer, from around 50 to 120 m (above the halocline). Above the halocline DO is high, close to full saturation, while waters at depth > ~150 m remain hypoxic in the channels, with minimum DO at about 250 m (Koutitonsky and Bugden, 1991;Gilbert et al., 2005). DO is generally between 30 and 60% saturation relative to air (% sat. hereafter) at depths > 200 m in the GSL, but decreases to 20–30% sat. at the head of the three main channels, reaching even 18–20% in parts of the Estuary, the most severely hypoxic area in the GSL (Fig. 2). The reduced pro-portion of oxygrich Labrador Current Water in the water mass en-tering the GSL in recent years is thought to aggravate oxygen depletion
that occurred over the last 70 years and led to the current situation (Gilbert et al., 2005).
Adults and large juveniles from both stocks are exposed to mild hypoxia (55–65% sat.) in winter when they aggregate in deep water (~6 °C) near Cabot Strait, mostly just outside the GSL in the Northwest Atlantic Fisheries Organization (NAFO) division 3Ps (Fig. 1). From spring to autumn, a large proportion of the nGSL cod population are found in the deep channels (NAFO divisions 3Pn, 4R, and 4S) and are exposed to more severe hypoxia (30–40% sat.) (Gilbert et al., 2007;Le Bris et al., 2013).Chabot (2004)calculated that up to 45% of the po-pulation in numbers and biomass were found at DO levels < 70% in July and August of 1995. Similarly,Fig. 3shows that 50% of thefish were caught at DO levels < 70% in August of 2004–2009. Cod in the sGSL do not face hypoxia at this time of the year, as the area (NAFO division 4T) is characterized by shallower banks that typically have DO levels > 70% sat.
Considering that chronic (sub-lethal) hypoxia in the laboratory was found to reduce food consumption, and in turn growth rate (Chabot and Dutil, 1999), hypoxia exposure during the feeding season could be a major determinant of growth rate for a large proportion of nGSL cod. Unlike the situation in the laboratory, however,fish movements from the shelves to the deep channels in the GSL do not only involve a change of DO, but also a change in temperature, as deep waters typi-cally are a few degrees warmer than the shelf waters. Temperature also exerts a strong influence on the growth rate of cod (Björnsson et al., 2007) and the model ofClaireaux et al. (2000)suggests that growth rate at 50% sat. and 6 °C may be better than at 100% sat. and 2 °C, assuming food is not limiting. Modeling is required to tease apart the effects of temperature and DO on individual life-history traits (i.e. growth, maturation, reproduction) in the two populations of the GSL, in order to accurately estimate the consequences on the growth and pro-duction of the stocks.
In this study, our objective was to further study the assumption that hypoxia mainly affects ingestion (Thomas et al., 2018, this issue) by using DEB theory to simulate the response of Atlantic cod in the GSL to contrasted DO conditions. Wefirst developed and validated a set of parameters for a GSL Atlantic cod DEB model. Then, we quantified the effect of DO saturation on the two populations from the GSL, based on historical growth trajectories. Finally, we used our model to explore scenarios of duration, frequency, and intensity of hypoxia on cod's life-history traits.
2. Material and methods
2.1. DEB model calibration and validation
DEB theory describes the rate at which an organism assimilates and utilizes energy and mass throughout its life cycle as a function of its state and its environment (i.e. food density and temperature) for maintenance, growth, maturation, and reproduction (Kooijman, 2010). In a standard DEB model, the energy budget of an individual is de-scribed by the dynamics of four state variables: the structural volume V (i.e. compounds requiring maintenance, in cm3), the reserve energy E (J), the cumulated energy allocated to maturity EH(J), and the re-production buffer ER(J). Energy from ingested food is assimilated into reserve through the assimilation ratepȦ (Table S3, eq. 4). Reserve en-ergy is utilized according to the mobilization rate pĊ (eq. 5). Afixed fraction (κ) of mobilized energy is allocated to the maintenance of structure (pṀ ; eq. 6) and its growth (pĠ; eq. 7) while the remaining fraction (1–κ) is allocated to the maintenance of the maturity level (ṗJ; eq. 8) and development in juveniles (pḢ ; eq. 9) or reproduction in adults (pṘ; eq. 10). Maintenance processes have priority over growth and development or reproduction. Stage transitions from embryo to juvenile (birth) and juvenile to adult (puberty) occur atfixed maturity levels: at EHb, the individual starts feeding; at EHp, allocation to maturity is redirected to reproduction. Temperature affects all rates in the same
way according to the Arrhenius relationship (Table S3, eq. 2;Kooijman, 2010).
In this study, we added four additional assumptions to the standard DEB model: (1) as for otherfish DEB models (Kooijman et al., 2011; Kooijman, 2014), we considered metabolic acceleration from birth to metamorphosis, accounting for the observed exponential growth during this period (Campana and Hurley, 1989;Otterlei et al., 1999;McCollum et al., 2006) and resulting in a permanent increase of assimilation and reserve mobilization rates (Kooijman, 2014), (2) afifth state variable, the energy allocated to egg production EGo(J), was included to control the gametogenesis and spawning (as formulated in Bernard et al., 2011), (3) the energy stored in the reproduction buffer, eggs, and, as a
last resort, structure can be used during extreme starvation to pay maintenance costs (Pecquerie et al., 2009; Table S3, eq. 15–19), and (4) food ingestion was impacted by the level of DO saturation as explained further inSection 2.2. All equations and model parameters are pre-sented in Supplementary material Supp. 1.
Parameters of the GSL cod DEB model were estimated through the AmP procedure (DEBtool package retrieved on 17/04/2017 from http://www.bio.vu.nl/thb/deb/deblab/add_my_pet/, see details in Supp.1 and inMarques et al., 2018). Although an entry for Atlantic cod exists in the AmP collection, preliminary trials showed that its appli-cation to GSL cod populations failed to accurately reproduce observed life-history traits in this area. Therefore, additional local data (from the
Fig. 1. Location of the northern and southern populations of Atlantic cod in the Gulf of Saint-Lawrence. The arrows indicate the schematic seasonal migration of each population. Also shown are the Northwest Atlantic Fisheries Organizationfishing subareas.
GSL and Newfoundland area) were included to estimate a new set of parameters (Fahay et al., 1999;Lambert and Dutil, 2000;Ouellet et al., 2001;Brown et al., 2003;Brander, 2005). Values of Root Mean Squared Error (RMSE) between data and predicted values were calculated to evaluate this set of parameter.
Two studies provided the validation datasets for the newly obtained set of parameters: a time series of length-at-age during 1970–1980 and 1980–1990 (Hanson and Chouinard, 1992) and a time series of total wet mass and gonadal wet mass for two size classes during 1992–1993 (Schwalme and Chouinard, 1999). Both datasets relate to sGSL cod. We used the environmental forcing (temperature, food, and DO) described in Section 2.3.2 for the sGSL population. Schwalme and Chouinard (1999)provided time series of seasonal stomach content mass, which were used as a proxy for food availability (seeSection 2.3.2for details). 2.2. Modeling metabolic response to hypoxia
According toThomas et al. (2018, this issue), the decrease in energy uptake related to hypoxia appears to be one of the most sensitive pro-cesses driving growth and reproduction. The effect of DO variations on Atlantic cod energetics was thus included into the DEB model as a correction factor (cDO) applied to the ingestion rate, which is consistent with the results ofChabot and Dutil (1999). The cDOwas defined as a function of ambient DO saturation experienced by the organism and was expressed as a Michaelis-Menten saturation function, modified to include a low critical DO threshold DOcritas follows:
=⎧ ⎨ ⎩ > ≤ − − + c t α DO t DO DO t DO ( ) , if ( ) 0 , if ( ) DO DO t DO DO t DO β crit crit ( ) ( ) crit crit (1) with DO(t) the ambient DO saturation at time t,α (−) and β (% sat.) two constants for which cDO= 1 at 100% sat., and DOcrit(% sat.) the DO saturation below which the correction factor is null (i.e. no ingestion). Thomas et al. (2018, this issue) estimated these parameters byfitting
the correction function on an experimental dataset of ingestion rates measured at various levels of dissolved oxygen (Supplementary mate-rial Supp. 2;Chabot and Dutil, 1999). Using the nonlinear (weighted) least-squares estimates function (nls) in the R software, they estimated the following parameter values: α = 1.43, β = 29.7% sat., and DOcrit= 31.7% sat. We draw attention to the fact the ingestion rate is also impacted by temperature through the Arrhenius correction factor, which identically affects every rate in the model according to DEB theory (Table S3, eq. 2;Kooijman, 2010).
2.3. Application to the cod populations in the Gulf of St-Lawrence 2.3.1. Cod data
The cod stocks in the GSL are monitored through annual Research Vessel (RV) surveys in August (nGSL) and September (sGSL). These surveys provide length and total wet mass at age data since 1990 in the nGSL and since 1971 in the sGSL. Stomach contents of a subsample of fish are available for 1993–2009 and 2015–2016 for nGSL cod (N = 21,908). For sGSL cod, stomach content data for this study were collected over several years since 1990 (1990–1995; 2000–2010; 2013; N = 16,871). Additional data for sGSL cod, notably with respect to stomach fullness, came from a physiological condition monitoring conducted annually since 1992 (typically monthly in April and June–October) and January surveys of cod overwintering grounds in 1994 and 1995 (N = 32,182). Cod were sampled at additional times of the year through“sentinel fisheries” in the nGSL: fishing vessels col-lecting data for DFO using protocols provided by DFO scientists. These data include length, wet mass, as well as stomach content for a sub-sample of thefish (1995–2009).
2.3.2. Environmental data
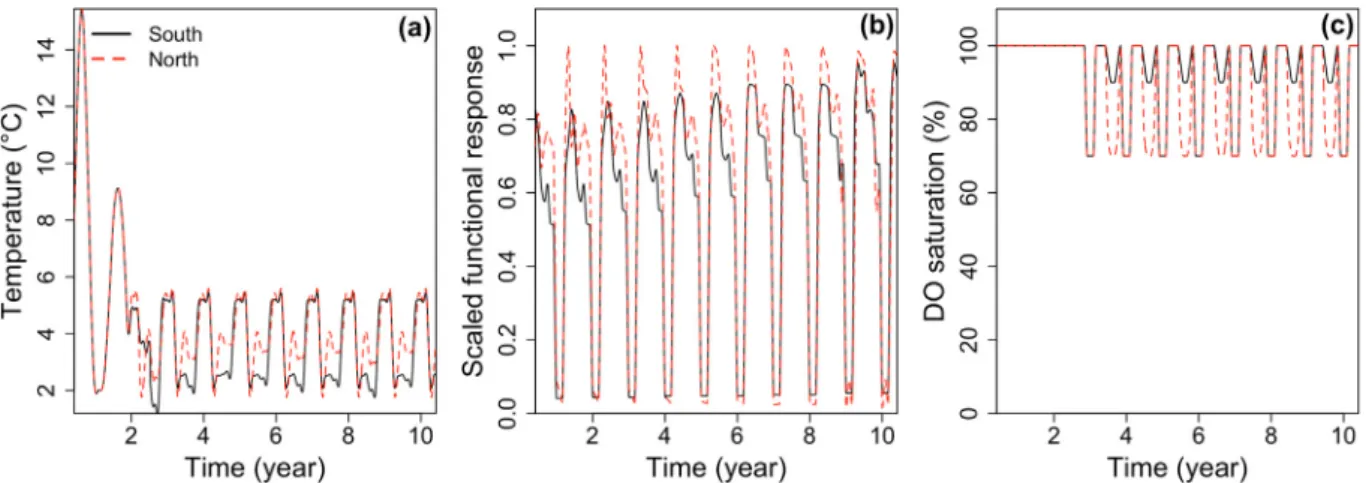
Monthly averaged environmental conditions were estimated from the same data sources as cod data for each of the two cod populations in the GSL and linearly interpolated to a daily time step (Fig. 4). 2.3.2.1. Temperature. Abundance-weighted mean monthly water temperatures were calculated for small (< 43 cm) and large individuals (> 43 cm) from data collected during the RV surveys, the physiological condition monitoring and the January surveys. Because a particularly cold period occurred from 1987 to 1991 (Swain, 1999), we calculated mean monthly temperatures during the spring–fall months of this period. For the nGSL we used the seasonal measurements provided byLe Bris et al. (2013). The average temperature difference between small and large individuals and between the whole study period and the cold period observed in the sGSL (c.a. 1 °C in both cases) was applied to temperature time series in the North.Benoît and Rail (2016)provided the inter-annual variability in late summer temperatures.
2.3.2.2. Food. DEB theory uses a hyperbolic functional response (f) to describe the feeding of an organism as a function of food availability. As no direct measurement of food availability were available, we relied on monthly length-specific mass of stomach contents from the RV surveys (sGSL population:Benoît and Rail, 2016, adjusted to account for empty stomachs; nGSL population: D. Chabot, unpublished data, see details in Supplementary material Supp. 3) and the physiological condition monitoring to represent seasonal feeding intensity. Mass of stomach contents were standardized between [0, 1] within each size classes ([0, 10] cm, [11, 20] cm, [21, 30] cm, etc.) each month of the year. These data were used to estimate the scaled functional response of the DEB model according to: f=SCstd
1
4, where f is the scaled functional response, and SCstd refers to the standardized mass of stomach content (the exponent ¼ being a calibration constant). Because stomach content data were obtained on a monthly basis and for certain years only, feeding frequency and inter-annual variability is not well estimated. The application of the calibration exponent allows
Fig. 3. Cumulative frequency distribution of Atlantic cod (strait lines), calcu-lated using the method ofPerry and Smith (1994)as a function of DO (black), temperature (blue) and depth (red), and cumulative frequency distribution of available habitat (dashed lines) as a function of DO, temperature and depth, using data from August depth-stratified random trawl surveys conducted in the nGSL from 2004 to 2009 (RV surveys). For instance, half of the cod population occupies waters colder than 2.8 °C, deeper than 142 m, and which DO level is below 68.5% sat. Courtesy of D. Gilbert (unpublished data). (For interpretation of the references to colour in thisfigure legend, the reader is referred to the web version of this article.)
buffering ingestion variability as a function of feeding frequency (Chabot et al., 2001) in particular during the months prior and after winter (when ingestion is limited;Benoît and Rail, 2016).
2.3.2.3. Oxygen. Annual profiles of DO saturation were built from measurements obtained during RV surveys and a set of near-bottom DO saturation data in the GSL (Fig. 2). In summer and early fall, a large proportion of nGSL cod are known to venture deep in the hypoxic channels that characterize the nGSL ecosystem (where DO saturation typically reaches 30%; Figs. 1 and 3). Because we model an average individual, mean DO saturation was set at 70% sat. from July to October; half of the individuals occupying waters with lower a DO saturation and the other half occupying waters with a higher DO saturation (Fig. 3). In contrast, sGSL cod do not face hypoxia in summer as they stay in the shallower waters of the Magdalen shallows. Both nGSL and sGSL cod face mild hypoxia in winter (~70% sat.).
During the first year of their development, young cod stay in shallow waters which warm up during summer (Tremblay and Sinclair, 1985; Swain and Kramer, 1995). Consequently, temperatures used in the model for larval to age-0 cod followed the general pattern of shallow waters in the GSL, described byGalbraith et al. (2012): 10 °C in June, 15 °C in August, and 5 °C in November. As these coastal waters remain normoxic, no reduction of the DO saturation was applied during thefirst two years of life. Environmental conditions experienced by age-1 cod were defined as an intermediate pattern between early and later life stages to ensure a smooth transition to deeper environment. 2.3.3. Simulation scenarios
To better understand the specific impact of temperature and DO level on energyfluxes, we ran three different scenarios:
- S1 scenario was a reference simulation for each population, i.e. with the specific environmental conditions available for each population (temperature and food). No DO effect was applied to the ingestion function as we assumed that stomach contents (that were used to construct the scaled functional response) already reflected the im-pact of DO conditions experienced by the individuals.
- In scenario S2, we tested the assumption that warmer temperatures (in nGSL) could outweigh the disadvantages of hypoxia, potentially resulting in a net increase in their energy uptake. The nGSL popu-lation was exposed to the temperature conditions experienced by sGSL cod (i.e. we compared S1 South with S2 North), while keeping food conditions and all other parameters identical to scenario S1. - In scenario S3, we aimed to quantify the costs of hypoxia in each
population. Because DO saturation affects feeding rate, observed stomach content data can under-estimate actual food availability (although giving an accurate estimate of energy uptake). Therefore,
we removed the effect of DO on energy uptake by multiplying the scaled functional response f by 1/cDO(Eq. (1))and measured the resulting gain in growth in both populations. Temperature condi-tions were the same as in scenario S1.
Each year from 1990 to 2004, simulations started with an embryo (0.42 cm) and lasted until age 10 years. Growth in length and total wet mass were simulated for nGSL and sGSL individuals. The accuracy of predictions was evaluated through the comparison of model results and observations from the yearly surveys using the RMSE as a measure of model goodness-of-fit (scenario S1). Differences in length and mass between nGSL and sGSL populations due to temperature were quanti-fied by calculating the mean differences between predictions for each population between scenarios S1 and S2. The quantification of hypoxia effects was calculated through the mean differences between predic-tions for each population between scenarios S1 and S3.
2.4. Exploring the effects of hypoxia on cod life-history traits
The actual foraging behavior of cod living in hypoxic waters and how it may vary in a changing environment remain uncertain. Therefore, we explored the sensitivity of several life-history traits to the duration, frequency, and intensity of exposure to hypoxia through ad-ditional scenarios. The reference scenario for the nGSL population (see previous section) was compared to three different durations of summer hypoxia, averaging 50, 100, and 200 days, combined with four in-tensities of DO saturation, reaching a minimum of 30, 50, 70, and 100% sat. For these comparisons, winter DO was maintained at the reference level, i.e. DO in the Laurentian Channel east of Cabot Strait (70% sat.). Diel vertical migrations of > 100 s of meters have been evidenced through data-storage tags (Le Bris et al., 2013). In order to reproduce these high-frequency variations in the environmental conditions, a last scenario simulating daily oscillations in DO saturation was added, with a single minimum level of 70% sat. (corresponding to the reference scenario).
For these simulations, we used a climatology of the monthly ob-servations of temperature and f, described inSection 2.3, i.e. the con-ditions each year were the same but we kept a seasonal variability. Simulations started with an embryo (0.42 cm) and lasted 15 years. The consequences of the different DO scenarios were evaluated by com-paring (1) the asymptotic length reached after 15 years of simulation, (2) the age at 40 cm, corresponding to the length at which young cod recruit to thefishery, (3) the reproductive investment expressed as a cumulated number of eggs produced over 15 years of simulation, and (4) the age at maturity (i.e. time to reach EHp). The energy investment into reproduction (EGo, J) was converted to a number of eggs produced using an average energy content of an egg of 1.9 J (Ouellet et al., 2001).
Fig. 4. Examples of time series of the environmental variables used in the DEB model. (a) Temperature, (b) scaled functional response, and (c) DO saturation taking into account the ontogenic effect and seasonal migratory history of the cod, as described in the methods section. Time starts at spawning in July.
3. Results
3.1. Validation of the DEB model
The set of parameters estimated for GSL cod was successfully ap-plied to the two validation datasets as predictions closely matched observations (Fig. 5). Length simulations over 10 years in sGSL cod reproduced very well the slower growth pattern observed during the 1980s compared to the 1970s (Fig. 5a). The total wet mass and gonad wet mass of two size classes of sGSL cod was also reasonably well re-produced over a 2-year period (Figs. 5b and c), although the model tended to under-estimate observed variability and the predicted sea-sonal pattern of gonad wet mass over-estimated observations in autumn (Fig. 5c).
3.2. Impact of temperature and hypoxia on the two GSL cod populations The average difference observed between the two populations each year amounted to 5.5% in length (Fig. 6a) and 12.7% in total wet mass (Fig. 6b). Under reference scenario (S1), the model accurately predicted 10 years of length at age and total wet mass at age of average in-dividuals born between 1990 and 2004. The RMSE of the model si-mulations of length and mass for nGSL individuals was 2.62 cm and 0.24 kg, respectively, and 3.39 cm and 0.21 kg for sGSL individuals (Fig. 7). A slight under-estimation of total wet mass was noted for small sGSL cod.
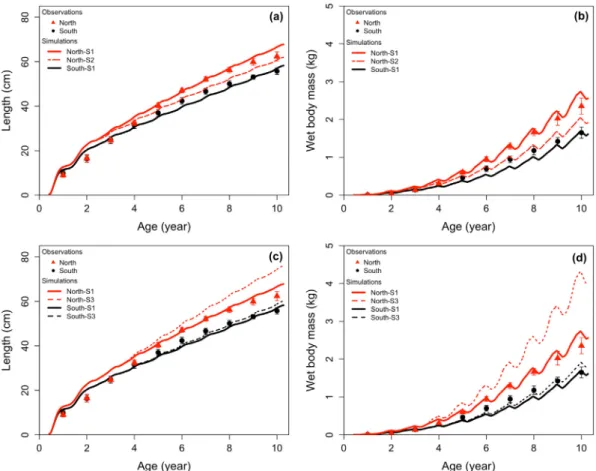
Scenario S2 aimed at determining if the faster growth rate observed in nGSL cod could be attributed to the warmer temperature of the area. Simulated length and total wet mass were reduced when applying sGSL temperatures but remained higher than the predictions and observa-tions for sGSL cod. Growth in length in the nGSL under scenario S2 was reduced by 7% on average compared to scenario S1 (Fig. 6a). Growth in total wet mass was reduced by 23.5% on average (Fig. 6b). By com-paring model predictions under scenario S1 and scenario S2, the dif-ference of temperature between nGSL and sGSL explained 48% of the difference in length and 58.5% of the difference in mass between the two populations.
Under scenario S3, testing for the effect of hypoxia on growth, there was little change to the predicted length (0.9%,Fig. 6c) and total wet mass (< 5%,Fig. 6d) for sGSL cod (RMSE of 3.15 cm and 0.19 kg, re-spectively) compared to the reference scenario. Conversely, drastic in-creases of both length and mass were observed in the simulation for nGSL cod (RMSE of 5.49 cm and 0.89 kg, respectively). When feeding rates were adjusted to remove the effect of hypoxia, growth in length increased 4% on average and growth in total wet mass increased by 18.5% on average for nGSL cod. The effect of hypoxia was two times lower for sGSL cod with an increase of 2% in length and 9% in mass on
average.
3.3. Impact of hypoxic conditions on cod life-history traits
Different scenarios of summer hypoxia exposure were simulated, and for each scenario the mean DO level for the year was calculated (Fig. 8). The reference scenario (blue star) corresponds to the realistic scenario, using the forcing variables for nGSL cod, with a mean yearly DO level of 83.2% sat. The scenario with daily fluctuations in DO corresponding to vertical migrations resulted in almost the same yearly DO level (81.6% sat.) and the same performance on all four response variables as in the reference scenario. The asymptotic length predicted in the different scenarios ranged from 89.5 cm, in the more extreme hypoxia scenario of 200 d of exposure to DO reaching 30 at its minimum, to 127.6 cm in the no-effect scenario (i.e. DO of 100% sat. all year long;Fig. 8a). The theoretical maximum length of actual cod in the nGSL was predicted at 116.2 cm. A similar pattern was observed when looking at the cumulated investment in reproduction (measured as a cumulated number of eggs; simulations running over 15 years), with 1.66 106eggs predicted in the extreme hypoxia scenario, 4.30 106eggs in the no-effect scenario and 3.45 106 eggs in the realistic scenario (Fig. 8c). The age at which a cod would reach 40 cm in the extreme hypoxia scenario was 7.4 years while it was estimated at 5.8 years in the no-effect scenario and 6 years in the realistic scenario (Fig. 8b). Finally, the age at maturity (i.e. puberty or the onset of allocation to gamete production in DEB theory) was reached after 4.6 years in the extreme hypoxia scenario and 4.1 years in the no-effect scenario and 4.2 years in the realistic scenario (Fig. 8d).
4. Discussion
In this study, we aimed to quantify the effects of reduced DO levels on the life-history traits of two Atlantic cod populations living in the GSL by developing a dedicated DEB model. We validated our set of parameters using empirical observations for sGSL and nGSL cod and successfully applied the model to the two populations. Our results confirmed that decreased DO levels can severely impact growth and reproductive processes depending on its intensity and duration. But despite being exposed to lower DO during the feeding season, nGSL cod showed higher growth performance than sGSL cod. Our simulations revealed that these patterns might be explained by a combination of higher temperature and food consumption.
4.1. A full life cycle energetic model for G. morhua
Using data from the wild, as opposed to controlled laboratory conditions, remains a challenge, as it requires a good knowledge of both
Fig. 5. Validation of the DEB model for sGSL cod. Time series of observed (points) and simulated (lines) growth in (a) length, (b) total wet mass, and (c) gonad wet mass. Data from (a)Hanson and Chouinard (1992)and (b and c)Schwalme and Chouinard (1999).
the biology and the physiology of the organism as well as the en-vironment they live in. Although the Atlantic cod is a species of interest for its historic importance and its economic value, understanding the causes of the differences in life-history traits between stocks or popu-lations is still limited (Brander, 2005), due to the complexity of the environments it occupies seasonally (physico-chemical properties of the water column, characterization and dynamics of food availability, etc.) and the inter-individual variability in behavior (migratory history, vertical movements, etc.) (Le Bris et al., 2013). The use of a DEB model to investigate and understand physical and physiological responses to environmental conditions in the two cod populations was of particular interest for the following reasons. In the past, most modeling studies focused exclusively on either juvenile or adult performances (Campana et al., 1995;Björnsson and Steinarsson, 2002;Björnsson et al., 2007; Holt and Jørgensen, 2014) or on larval growth (Hinrichsen et al., 2002;
Folkvord, 2005). Within the DEB framework, all life stages are ac-counted for, which leads to an integration of environmental effects on life-history traits through time. A developing juvenile experiencing low temperature or food conditions would take longer to reach maturity. Our exploratory results showed that current DO conditions do not im-pact development duration. However, more extreme scenarios pro-duced important delays in reaching age at maturity, which could have important implications for population dynamics (e.g.Hutchings, 2005). Being able to model the entire life cycle gives a broader set of life-history traits for which predictions can be made and compared to em-pirical observations allowing for more fulsome model validation. This also offers opportunities to scale such predictions up to the population level (Pethybridge et al., 2013; Saraiva et al., 2014; Le Goff et al., 2017). While in the present study the DEB model was used to simulate an average individual in each population of the GSL, effort should be
Fig. 6. Observed and simulated (a and c) length at age and (b and d) total wet mass at age. Dots and Triangles ( ± SD) correspond to observations for nGSL and sGSL cod, respectively and lines to the different scenarios: S1 corresponds to actual conditions, S2 to the scenario using the sGSL temperature profile for both populations (upper panels), and S3 to the scenario with removed effect of hypoxia on feeding rates (lower panels).
Fig. 7. Observed vs. simulated (a) length at age and (b) total wet mass at age. Each point corresponds to a year in the life of individuals born each year between 1990 and 2004 in the nGSL (red) and the sGSL (black) and modelled until age 10 years under sce-nario S1. (For interpretation of the references to colour in thisfigure legend, the reader is referred to the web version of this article.)
put toward modeling growth trajectories of a variety of individuals that occupy areas with different temperature and DO (Fig. 3;Le Bris et al., 2013).
The main result of this study is the successful modeling of length and total wet mass at age, in simulations starting each year from 1990 to 2004 with an embryo until age 10 years, for the two cod populations in the GSL (Fig. 7). The growth time series for the sGSL population goes further back to 1970 but only years from 1990 were included in this study in order to make comparable predictions for identical years in both populations (i.e. between 1990 and 2004); simulations for years 1970–1989 can be found in the Supplementary material (Supp. 4). Most of the discrepancies between model predictions and observations oc-curred at young (< 3 years) and older ages (> 8 years), in both popu-lations. Two hypotheses might explain this pattern: 1) an over-estimation of the stomach content mass used to reconstruct the functional response and 2) a size-specific mortality. Available data used to estimate stomach content mass were mostly for cod measuring be-tween 20 and 80 cm (Benoît and Rail, 2016; D. Chabot, unpublished data, see Supplementary material Supp. 3). The misrepresentation of small and large individuals in the samples might generate bias in the estimated stomach fullness and be responsible for the curved shape of the distribution of simulated vs. observed points in Fig. 7. Moreover, the availability of data for stomach content mass is uneven throughout the year, with higher numbers of sampled stomachs in summer months than in winter. Further improvement of predictions would require better biological sampling of inter-annual seasonal feeding activity, which would be a logistically challenging and expensive endeavor.
4.2. Multiple stressors explain growth patterns of cod in the GSL Variations in size-at-age can reflect both growth variability and size-selective mortality. Based on the back-calculated sizes-at-age and a
modified von Bertalanffy growth model,Sinclair et al. (2002)estimated that inter-annual changes in observed size-at-age from the 1970s to the mid-1990s were most strongly affected by variation in size-selective mortality, followed by a negative effect of population density and a weak positive effect of occupied temperature. Persistent small size-at-age in sGSL despite good conditions for growth and littlefishing after 1993 has been attributed to an evolutionary response to the size-se-lectivefishing that occurred prior to the 1993 moratorium (Swain et al., 2007). The difference in conclusions of this study and that ofSinclair et al. (2002)concerning the causes of size-at-age variation in sGSL is one that should be investigated further. The current DEB model does not account for possible evolutionary change in growth, though the outcomes of the evolutionary process could be accommodated by the model by varying key parameters such as the energy conductance υ̇ and the specific somatic maintenance rate p[ ̇ ]M . Furthermore, scaling the current DEB model up to the population level could allow evaluating the contributions of size-selective mortality and environmentally-driven growth variability to variation in size-at-age.
The cod population in nGSL has been reported to be more produc-tive than the population in the sGSL (Dutil and Brander, 2003). The growth data from RV surveys presented in our study reflect this pattern with nGSL cod growing on average 5.5% more in length and 12.7% more in total wet mass than sGSL cod (between 1990 and 2004). From this observation, it would seem that hypoxia may not have an effect on growth performance of cod, or that other factors overcome the negative impact of hypoxia on their energy budget (i.e. temperature and food). Despite the amount of data on this species in the GSL, it is still difficult to know precisely how much time cod spend in the different layers of the water column. Data from the RV surveys show that close to 50% of the nGSL population (in numbers) is captured at DO levels below 70% sat. in July and in August (Fig. 3), but only 20% is similarly exposed in October, when cod had likely started their winter migration out of the
Fig. 8. Life-history traits for theoretical DO trajectories. Left panels give the DO trajectories of the different scenarios, with a combination of intensity (100, 70, 50, 30% sat.), duration (50, 100, and 200 d), and frequency (continuous or oscillating). Panels on the right illustrate the simulated effect of these scenarios on (a) asymptotic length after 15 years, (b) age at 40 cm, (c) cumulated number of eggs produced, and (d) age at maturity.
tions which bring them in hypoxic waters and others seem to stay in normoxic areas. The model reaches here a limit, in its actual form, by simulating an average individual and further developments using in-dividual based modeling approaches could bring valuable information on these differential behaviors. The use of individual growth trajec-tories obtained from otolith measurements could be appropriate to take this step forward (Fablet et al., 2011;Pecquerie et al., 2012). A number of individuals could be modelled in order to take into account the di-versity of conditions experienced by cod in the GSL (Figs. 3 and 4).
Temperature plays a major role in the physiological performance of organisms (Pörtner et al., 2017) and is a crucial variable in DEB theory as it modulates all energy fluxes. Differences in temperature regime across the distribution area of Atlantic cod (e.g. between-stock differ-ences) are often considered to be responsible for the variability ob-served in life-history traits (Brander, 2005; Neuheimer and Taggart, 2007;Pörtner et al., 2017), though these studies have generally failed to account for seasonal variations in occupied temperature that result from seasonal temperature change and cod migrations. While some populations have been reported to experience frequent high tempera-tures (Murawski and Finn, 1988;Righton et al., 2010), the vast majority of cod from the GSL (> 95%) are found at temperatures between −0.5 and 8.5 °C (Fig. 4;Rose and Leggett, 1988). Other factors such as the local phenotypical adaptations to water hydrography (MacKenzie et al., 1996;Dutil et al., 1999) andfishery pressure (Olsen et al., 2007) likely contribute to this variability as well. At the scale of the GSL, temperature differences between the two populations are in the order of 1 °C during the summer (Galbraith et al., 2012;Benoît and Rail, 2016). According to the simulations run in scenario S2, this temperature dif-ference was responsible for 48% of the difference in length and of 58.5% of the difference in total wet mass between the populations. The remaining gap of growth between the two populations is therefore imputable to prey quality and/or abundance despite hypoxia. Indeed, stomach content mass data being the only indicator of energy input available, it was impossible to disentangle the impact of hypoxia on food consumption. We would need to have an estimate of the con-centration of prey in the environment to overcome this issue. Never-theless, based on the knowledge of the effect of hypoxia on ingestion rates (Chabot and Dutil, 1999) we could give an estimate of the amount of energy not assimilated due to hypoxia by reversing the correction of Thomas et al. (2018, this issue). The obtained predictions under sce-nario S3 show an important growth increase in the nGSL population if it did not face hypoxia in summer.
4.3. Effects of hypoxia on cod life-history traits
In the exploratory part of this study we investigated the effect of hypoxia on various life-history traits of cod in a range of scenarios in order to identify possible exposure thresholds. This approach is justified as limited information is available on the degree of exposure to hypoxia of cod in the GSL. It seems that both the duration and the intensity of exposure to reduced DO levels have a linear negative effect on the maximum length and the cumulated investment in reproduction based
biology of this species and the fact that larvae and juveniles tend to live in shallower and more oxygenated waters, they might not be as exposed to reduced DO levels as older juveniles and adults can be.
Chabot and Dutil (1999)brought evidence that almost all (97%) of the variability in growth observed between experimental treatments at different levels of hypoxia was explained by an effect of DO saturation on ingestion rate; we therefore modelled this process accordingly. The value of DO threshold, DOcrit= 31.7% sat., calculated byThomas et al. (2018, this issue) in the DO correction factor equation agrees well with the fact that the risk of mortality becomes significant at 28% sat. (Plante et al., 1998), although the lethal threshold (median lethal level after a 96 h exposure) has been estimated at 21% sat. (Plante et al., 1998). In nature, cod avoid levels < 30% sat. (D'Amours, 1993) prob-ably because they risk death below this DO level, but also because the potential energy gain is very limited. A recent study suggested that hypoxia might also reduce gastric evacuation time (Chabot et al., 2015). Their results indicate that at equal stomach content, the dura-tion of assimiladura-tion of nutrient through their passage in the gut is in-creased under hypoxia. As ingestion depends on the state of fullness of stomach, increased transit time results in a reduced quantity of food processed over time. In the context of DEB theory, this could be im-plemented through the application of a DO correction factor to the digestion process, which can be described as a simple Michaelis-Menten kinetics (Kooijman, 2010), or a correction of the conversion efficiency of food to assimilated energyκX. All these effects are obviously inter-related and factors that influence the amount of food eaten are likely to affect the assimilation efficiency and any factor that influences the rate of the digestive processes and assimilation is likely to have an influence upon the amount of food ingested (Wang et al., 2009). While laboratory experiments have already demonstrated a reduction of growth in cod exposed to hypoxia (Chabot and Dutil, 1999), no study on cod has yet demonstrated a negative effect of hypoxia on reproductive output, al-though this has been demonstrated for other species (e.g.Wu et al., 2003;Landry et al., 2007;Thomas et al., 2007). More data from both field monitoring and controlled experiments is warranted to answer this question.
4.4. Conclusions
This work constitutes afirst step in the development and application of a full life cycle DEB model for Atlantic cod. The integration of the effect of hypoxia as a third environmental variable is an important feature of the model for a species living under natural and human-in-duced pressures in a rapidly changing environment. More global ap-proaches investigating such effects on population dynamics and bio-geographical distribution should be pursued (Kearney et al., 2010). The application of our model to other cod stocks facing hypoxia, such as in the Baltic Sea (Brander, 1995;Neuenfeldt et al., 2009), would be in-teresting to compare the response of different populations to multiple stressors. The vast knowledge gathered through decades by fishery biologists, physiologists and managers on the biology and ecology of G. morhua should help adapting and applying this model to other stocks
throughout the distribution area of this species. Finally, exploring in-dividual growth trajectories should allow a better appreciation of the tradeoff faced by fishes venturing in hypoxic, yet warm and potentially prey-rich waters on life-history traits, especially in populations ex-hibiting inter-individual behavior variability (Le Bris et al., 2013). Acknowledgements
The authors want to thank Christian Jørgensen and Kenneth Rose for the valuable comments they made to improve the manuscript. This work was supported by the RECHAGLO International Research Group, co-funded by Ifremer and Fisheries and Oceans Canada and by LabexMer French project (ANR-10-LABX-19-01). RL salary was sup-ported by Fisheries and Oceans Canada through the NSERC Scientific Research fellowship 497065-2016. The authors are very thankful to Douglas P. Swain for sharing his deep knowledge of the Atlantic cod in the GSL.
Appendix A. Supplementary data
Supplementary data to this article can be found online athttps:// doi.org/10.1016/j.seares.2018.07.001.
References
Benoît, H.P., Rail, J.-F., 2016. Principal predators and consumption of juvenile and adult Atlantic Herring (Clupea harengus) in the Southern Gulf of St. Lawrence. In: Canadian Science Advisory Secretariat.
Bernard, I., de Kermoysan, G., Pouvreau, S., 2011. Effect of phytoplankton and tem-perature on the reproduction of the Pacific oyster Crassostrea gigas: investigation through DEB theory. J. Sea Res. 66 (4), 349–360.
Björnsson, B., Steinarsson, A., 2002. The food-unlimited growth rate of Atlantic cod (Gadus morhua). Can. J. Fish. Aquat. Sci. 59 (3), 494–502.
Björnsson, B., Steinarsson, A., Árnason, T., 2007. Growth model for Atlantic cod (Gadus morhua): effects of temperature and body weight on growth rate. Aquaculture 271 (1), 216–226.
Brander, K.M., 1995. The effect of temperature on growth of Atlantic cod (Gadus morhua L.). ICES J. Mar. Sci. 52 (1), 1–10.
Brander, K.M., 2005. Spawning and Life History Information for North Atlantic Cod Stocks. ICES Cooperative Research Report 274. pp. 152.
Breitburg, D., Levin, L.A., Oschlies, A., Grégoire, M., Chavez, F.P., Conley, D.J., Garçon, V., Gilbert, D., Gutiérrez, D., Isensee, K., Jacinto, G.S., 2018. Declining oxygen in the global ocean and coastal waters. Science 359 (6371), eaam7240.
Brown, J.A., Minkoff, G., Puvanendran, V., 2003. Larviculture of Atlantic cod (Gadus morhua): progress, protocols and problems. Aquaculture 227 (1), 357–372.
Bugden, G.L., 1991. Changes in the temperature-salinity characteristics of the deeper waters of the Gulf of St. Lawrence over the past several decades. In: The Gulf of St. Lawrence: Small Ocean or Big Estuary, pp. 139–147.
Campana, S.E., Hurley, P.C., 1989. An age-and temperature-mediated growth model for cod (Gadus morhua) and haddock (Melanogrammus aeglefinus) larvae in the Gulf of Maine. Can. J. Fish. Aquat. Sci. 46 (4), 603–613.
Campana, S.E., Mohn, R.K., Smith, S.J., Chouinard, G.A., 1995. Spatial implications of a temperature-based growth model for Atlantic cod (Gadus morhua) off the eastern coast of Canada. Can. J. Fish. Aquat. Sci. 52 (11), 2445–2456.
Chabot, D., 2004. Chronic non-lethal levels of hypoxia limit distribution and growth of Atlantic cod (Gadus morhua) in the Northern Gulf of St. Lawrence, Canada. In: Proceedings of the 7th International Symposium on Fish Physiology, Toxicology and Water Quality, Tallinn, Estonia, pp. 183–205.
Chabot, D., Dutil, J.-D., 1999. Reduced growth of Atlantic cod in non-lethal hypoxic conditions. J. Fish Biol. 55 (3), 472–491.
Chabot, D., Dutil, J.D., Couturier, C., 2001. Impact of chronic hypoxia on food ingestion, growth and condition of Atlantic cod, Gadus morhua. In: ICES Annual Science Conference 89th Statutory Meeting, Theme Session on Growth and Condition in Gadoid Stocks and Implications for Sustainable Management (V). ICES, Copenhagen, Denmark, pp. 1–17.
Chabot, D., Behrens, J.W., Andersen, N.G., 2015. Digesting in hypoxia: impact on gastric evacuation rate of Atlantic cod, Gadus morhua. In: ICES Annual Science Conference 2015, Copenhagen, Denmark.
Claireaux, G., Chabot, D., 2016. Responses byfishes to environmental hypoxia: integra-tion through Fry's concept of aerobic metabolic scope. J. Fish Biol. 88 (1), 232–251.
Claireaux, G., Webber, D.M., Lagardère, J.P., Kerr, S.R., 2000. Influence of water tem-perature and oxygenation on the aerobic metabolic scope of Atlantic cod (Gadus morhua). J. Sea Res. 44 (3–4), 257–265.
D'Amours, D., 1993. The distribution of cod (Gadus morhua) in relation to temperature and oxygen level in the Gulf of St. Lawrence. Fish. Oceanogr. 2 (1), 24–29.
Deutsch, C., Ferrel, A., Seibel, B., Pörtner, H.-O., Huey, R.B., 2015. Climate change tightens a metabolic constraint on marine habitats. Science 348 (6239), 1132–1135.
Diaz, R.J., Rosenberg, R., 2008. Spreading dead zones and consequences for marine
ecosystems. Science 321 (5891), 926–929.
Dutil, J.-D., Brander, K., 2003. Comparing productivity of North Atlantic cod (Gadus morhua) stocks and limits to growth production. Fish. Oceanogr. 12 (4–5), 502–512.
Dutil, J.-D., Castonguay, M., Gilbert, D., Gascon, D., 1999. Growth, condition, and en-vironmental relationships in Atlantic cod (Gadus morhua) in the northern Gulf of St. Lawrence and implications for management strategies in the Northwest Atlantic. Can. J. Fish. Aquat. Sci. 56 (10), 1818–1831.
Ekau, W., Auel, H., Pörtner, H.-O., Gilbert, D., 2010. Impacts of hypoxia on the structure and processes in pelagic communities (zooplankton, macro-invertebrates andfish). Biogeosciences 7 (5), 1669–1699.
Fablet, R., Pecquerie, L., De Pontual, H., Hoie, H., Millner, R., Mosegaard, H., Kooijman, S.A.L.M., 2011. Shedding light onfish otolith biomineralisation using a bioenergetic appraoch. PLos One 6, e27055.
Fahay, M.P., Berrien, P.L., Johnson, D.L., Morse, W.W., 1999. Essential Fish Habitat Source Document: Atlantic Cod, Gadus Morhua, Life History and Habitat Characteristics. NOAA Tech. Mem. NMFS-NE 124. pp. 41.
Folkvord, A., 2005. Comparison of size-at-age of larval Atlantic cod (Gadus morhua) from different populations based on size- and temperature-dependent growth models. Can. J. Fish. Aquat. Sci. 62 (5), 1037–1052.
Freitas, V., Cardoso, J.F.M.F., Lika, K., Peck, M.A., Campos, J., Kooijman, S.A.L.M., van der Veer, H.W., 2010. Temperature tolerance and energetics: a dynamic energy budget-based comparison of North Atlantic marine species. Philos. Trans. R. Soc. Lond. Ser. B Biol. Sci. 365 (1557), 3553–3565.
Galbraith, P.S., Larouche, P., Chassé, J., Petrie, B., 2012. Sea-surface temperature in re-lation to air temperature in the Gulf of St. Lawrence: Interdecadal variability and long-term trends. Satell. Oceanogr. Clim. Change 77, 10–20.
Galic, N., Grimm, V., Forbes, V.E., 2017. Impaired ecosystem process despite little effects on populations: modeling combined effects of warming and toxicants. Glob. Change Biol. 23, 2973–2989.
Gilbert, D., Pettigrew, B., 1997. Interannual variability (1948–1994) of the CIL core temperature in the Gulf of St. Lawrence. Can. J. Fish. Aquat. Sci. 54 (S1), 57–67.
Gilbert, D., Sundby, B., Gobeil, C., Mucci, A., Tremblay, G.-H., 2005. A seventy-two-year record of diminishing deep-water oxygen in the St. Lawrence estuary: the Northwest Atlantic connection. Limnol. Oceanogr. 50 (5), 1654–1666.
Gilbert, D., Chabot, D., Archambault, P., Rondeau, B., Herbert, S., 2007. Appauvrissement en oxygène dans les eaux profondes du Saint-Laurent marin; causes possibles et im-pacts écologiques. Nat. Can. 131, 67–75.
Hanson, J.M., Chouinard, G.A., 1992. Evidence that size-selective mortality affects growth of Atlantic cod (Gadus morhua L.) in the southern gulf of St Lawrence. J. Fish Biol. 41 (1), 31–41.
Hartman, K.J., Brandt, S.B., 1995. Comparative energetics and the development of bioenergetics models for sympatric estuarine piscivores. Can. J. Fish. Aquat. Sci. 52 (8), 1647–1666.
Helly, J.J., Levin, L.A., 2004. Global distribution of naturally occurring marine hypoxia on continental margins. Deep Sea Res. 51 (9), 1159–1168.
Hinrichsen, H.-H., Möllmann, C., Voss, R., Köster, F.W., Kornilovs, G., 2002. Biophysical modeling of larval Baltic cod (Gadus morhua) growth and survival. Can. J. Fish. Aquat. Sci. 59 (12), 1858–1873.
Holt, R.E., Jørgensen, C., 2014. Climate warming causes life-history evolution in a model for Atlantic cod (Gadus morhua). Conserv. Physiol. 2 (1), cou050.
Hutchings, J.A., 2005. Life history consequences of overexploitation to population re-covery in Northwest Atlantic cod (Gadus morhua). Can. J. Fish. Aquat. Sci. 62 (4), 824–832.
Kearney, M.R., Wintle, B.A., Porter, W.P., 2010. Correlative and mechanistic models of species distribution provide congruent forecasts under climate change. Conserv. Lett. 3 (3), 203–213.
Kemp, W.M., Testa, J.M., Conley, D.J., Gilbert, D., Hagy, J.D., 2009. Temporal responses of coastal hypoxia to nutrient loading and physical controls. Biogeosciences 6 (12), 2985–3008.
Kooijman, S.A.L.M., 2010. Dynamic Energy Budget Theory for Metabolic Organisation. Cambridge University Press, Cambridge.
Kooijman, S.A.L.M., 2014. Metabolic acceleration in animal ontogeny: an evolutionary perspective. J. Sea Res. 94, 128–137.
Kooijman, S.A.L.M., 2017. Models in stress research. Ecol. Complex. 34, 161–177.
Kooijman, S.A.L.M., Pecquerie, L., Augustine, S., Jusup, M., 2011. Scenarios for accel-eration infish development and the role of metamorphosis. J. Sea Res. 66 (4), 419–423.
Koutitonsky, V.G., Bugden, G.L., 1991. The physical oceanography of the Gulf of St. Lawrence: a review with emphasis on the synoptic variability of the motion. Can. Fish. Aquat. Sci. 113, 57–90.
Lambert, Y., Dutil, J.D., 2000. Energetic consequences of reproduction in Atlantic cod (Gadus morhua) in relation to spawning level of somatic energy reserves. Can. J. Fish. Aquat. Sci. 57 (4), 815–825.
Landry, C.A., Steele, S.L., Manning, S., Cheek, A.O., 2007. Long term hypoxia suppresses reproductive capacity in the estuarinefish, Fundulus grandis. Comp. Biochem. Physiol. 148 (2), 317–323.
Lavaud, R., La Peyre, M.K., Casas, S.M., Bacher, C., La Peyre, J.F., 2017. Integrating the effects of salinity on the physiology of the eastern oyster, Crassostrea virginica, in the northern Gulf of Mexico through a dynamic energy budget model. Ecol. Model. 363, 221–233.
Le Bris, A., Fréchet, A., Galbraith, P.S., Wroblewski, J.S., 2013. Evidence for alternative migratory behaviours in the northern gulf of St Lawrence population of Atlantic cod (Gadus morhua L.). ICES J. Mar. Sci. 70 (4), 793–804.
Le Goff, C., Lavaud, R., Cugier, P., Jean, F., Flye-Sainte-Marie, J., Foucher, E., Desroy, N., Fifas, S., Foveau, A., 2017. A coupled biophysical model for the distribution of the great scallop Pecten maximus in the English Channel. J. Mar. Syst. 167, 55–67.
Norwegian ecosystem-based management plan for the Barents Sea. ICES J. Mar. Sci. 64 (4), 599–602.
Otterlei, E., Nyhammer, G., Folkvord, A., Stefansson, S.O., 1999. Temperature- and size-dependent growth of larval and early juvenile Atlantic cod (Gadus morhua): a com-parative study of Norwegian coastal cod and Northeast Arctic cod. Can. J. Fish. Aquat. Sci. 56 (11), 2099–2111.
Ouellet, P., Lambert, Y., Bérubé, I., 2001. Cod egg characteristics and viability in relation to low temperature and maternal nutritional condition. ICES J. Mar. Sci. 58 (3), 672–686.
Pecquerie, L., Petitgas, P., Kooijman, S.A.L.M., 2009. Modelingfish growth and re-production in the context of the dynamic energy budget theory to predict environ-mental impact on anchovy spawning duration. J. Sea Res. 62 (2), 93–105.
Pecquerie, L., Fablet, R., De Pontual, H., Bonhommeau, S., Alunno-Bruscia, M., Petitgas, P., Kooijman, S.A.L.M., 2012. Reconstructing individual food and growth histories from biogenic carbonates. Mar. Ecol. Prog. Ser. 447, 151–164.
Perry, R.I., Smith, S.J., 1994. Identifying habitat associations of marinefishes using survey data: an application to the Northwest Atlantic. Can. J. Fish. Aquat. Sci. 51, 589–602.
Pethybridge, H., Roos, D., Loizeau, V., Pecquerie, L., Bacher, C., 2013. Responses of European anchovy vital rates and population growth to environmentalfluctuations: an individual-based modeling approach. Ecol. Model. 250, 370–383.
Plante, S., Chabot, D., Dutil, J.D., 1998. Hypoxia tolerance in Atlantic cod. J. Fish Biol. 53 (6), 1342–1356.
Pörtner, H.-O., Bock, C., Mark, F.C., 2017. Oxygen- and capacity-limited thermal toler-ance: bridging ecology and physiology. J. Exp. Biol. 220 (15), 2685.
Rabalais, N.N., Turner, R.E., Wiseman Jr., W.J., 2002. Gulf of Mexico hypoxia, aka“the dead zone.”. Annu. Rev. Ecol. Syst. 33 (1), 235–263.
Rabalais, N.N., Díaz, R.J., Levin, L.A., Turner, R.E., Gilbert, D., Zhang, J., 2010. Dynamics and distribution of natural and human-caused hypoxia. Biogeosciences 7 (2), 585–619.
Righton, D.A., Andersen, K.H., Neat, F., Thorsteinsson, V., Steingrund, P., Svedäng, H., Michalsen, K., Hinrichsen, H.-H., Bendall, V., Neuenfeldt, S., Wright, P., Jonsson, P., Huse, G., van der Kooij, J., Mosegaard, H., Hüssy, K., Metcalfe, J., 2010. Thermal
519, 165–182.
Swain, D.P., Kramer, D.L., 1995. Annual variation in temperature selection by Atlantic cod Gadus morhua in the southern gulf of St. Lawrence, Canada, and its relation to population size. Mar. Ecol. Prog. Ser. 116, 11–23.
Swain, D.P., Sinclair, A.F., Hanson, J.M., 2007. Evolutionary response to size-specific mortality in an exploitedfish population. Proc. R. Soc. Lond. B Biol. Sci. 274 (1613), 1015–1022.
Thomas, P., Rahman, M.S., Khan, I.A., Kummer, J.A., 2007. Widespread endocrine dis-ruption and reproductive impairment in an estuarinefish population exposed to seasonal hypoxia. Proc. R. Soc. Lond. B Biol. Sci. 274 (1626), 2693–2701.
Thomas, Y., Flye-Sainte-Marie, J., Chabot, D., Aguirre-Velarde, A., Marques, G., Pecquerie, L., 2018. Effects of hypoxia on metabolic functions in marine organisms: observed patterns and modelling assumptions within the context of dynamic energy budget (DEB) theory.
Tremblay, M.J., Sinclair, M., 1985. Gulf of St. Lawrence Cod, Age-Specific Geographic Distributions and Environmental Occurrences from 1971 to 1981. Department of Fisheries and Oceans, Fisheries Research Branch, Scotia-Fundy Region, Halifax Fisheries Research Laboratory.
Vaquer-Sunyer, R., Duarte, C.M., 2008. Thresholds of hypoxia for marine biodiversity. Proc. Natl. Acad. Sci. 105 (40), 15452–15457.
Wang, T., Lefevre, S., Thanh Huong, D.T., van Cong, N., Bayley, M., 2009. The effects of hypoxia on growth and digestion. Fish Physiol. 27, 361–396.
Wu, R.S.S., 2002. Hypoxia: from molecular responses to ecosystem responses. Mar. Pollut. Bull. 45 (1), 35–45.
Wu, R.S.S., Zhou, B.S., Randall, D.J., Woo, N.Y.S., Lam, P.K.S., 2003. Aquatic hypoxia is an endocrine disruptor and impairsfish reproduction. Environ. Sci. Technol. 37 (6), 1137–1141.
Zhang, J., Gilbert, D., Gooday, A.J., Levin, L., Naqvi, S.W.A., Middelburg, J.J., Scranton, M., Ekau, W., Peña, A., Dewitte, B., Oguz, T., Monteiro, P.M.S., Urban, E., Rabalais, N.N., Ittekkot, V., Kemp, W.M., Ulloa, O., Elmgren, R., Escobar-Briones, E., van der Plas, A.K., 2010. Natural and human-induced hypoxia and consequences for coastal areas: synthesis and future development. Biogeosciences 7, 1443–1467.