HAL Id: hal-00772194
https://hal.archives-ouvertes.fr/hal-00772194
Submitted on 25 Jan 2021
HAL is a multi-disciplinary open access
archive for the deposit and dissemination of
sci-entific research documents, whether they are
pub-lished or not. The documents may come from
teaching and research institutions in France or
abroad, or from public or private research centers.
L’archive ouverte pluridisciplinaire HAL, est
destinée au dépôt et à la diffusion de documents
scientifiques de niveau recherche, publiés ou non,
émanant des établissements d’enseignement et de
recherche français ou étrangers, des laboratoires
publics ou privés.
Influence of the North Atlantic SST on the atmospheric
circulation
Arnaud Czaja, Claude Frankignoul
To cite this version:
Arnaud Czaja, Claude Frankignoul. Influence of the North Atlantic SST on the atmospheric
cir-culation.
Geophysical Research Letters, American Geophysical Union, 1999, 26, pp.2969-2972.
�10.1029/1999GL900613�. �hal-00772194�
Influence of the North Atlantic SST on the atmospheric
circulation
Arnaud Czaja and Claude Frankignoul
Laboratoire d'oc•anographie Dynamique et de Climatologie (LODYC), Paris, France
Abstract. Using the monthly COADS dataset and NMC- NCAR archives we show that significant anomalies of the at- mospheric circulation are related to previous SST anomalies in the North Atlantic. A signal over the northwest Labrador Sea in late spring is associated with the dominant mode of SST variability during the preceeding winter. It is more clearly seen in the mid-troposhere than at sea level and ap- pears to be related to the anomalous surface heat exchanges that slowly damp the SST anomalies. In addition, a NAO- like signal in early winter is associated with SST anomalies
east of Newfoundland and in the eastern subtropical North Atlantic during the preceeding summer.
1. Introduction
On the monthly timescale, air-sea interactions in the North Atlantic primarily reflect the stochastic forcing of the oceanic mixed-layer by the atmosphere, resulting in large-
scale sea surface temperature (SST) anomalies [Frankig-
noul, 1985]. After they have been generated, the latter
are damped by the turbulent surface heat flux, thereby in-
fluencing the atmospheric
boundary layer [Frankignoul
et
al., 1998]. However,
the impact of the North Atlantic SST
anomalies on the observed tropospheric flow has not been documented, although wintertime SST anomalies may have
a small predictive skill for the winter [Ratcliffe and Mur-
ray, 1970] or summer
[Colman,
1997]
climatology
of North-
ern Europe. In general, sensitivity studies with atmospheric general circulation models show that prescribed North At-
lantic SST anomalies have some influence on the wintertime
circulation, but the nature of the interaction is still contro-
versial [e.g, Kushnir and Held, 1996]. Recently,
by using an
ensemble of simulations forced by the global SST and sea-ice
distribution during 1948-1993,
Davies et al. [1997], Venzke
et al. [1998] and Rodwell
et al. [1999],
found that a signif-
icant predictability of the North Atlantic Oscillation - like mode of variability in their model was associated with SST
anomalies in the North Atlantic. Further investigations of the observational records are thus needed to fill the gap with these modeling studies.
a 5 ø x 5 ø grid [Cayan, 1992] were considered
between
20N
and 60N, except in the northwest where the data density is
poor. Geopotential
height at 500 mb (hereafter Z500) ob-
tained from the former NMC, and sea level pressure (here-
after SLP) and 700 mb temperature (hereafter
T700) ob-
tained from NCAR were considered between 20N to 70N
and 100W to 10E. At each grid-point, a third-order poly- nomial was removed by least-squares fit from each anomaly time series, thereby removing the strong trends displayed in
the analysis period.
3. Lead-lag analysis between SST and
tropospheric variables
As reviewed in Frankignoul [1985], the stochastic cli-
mate model gives a good representation of extratropical SST anomalies and provides statistical signatures of their inter- action with the atmosphere. The lagged covariance between SST and atmospheric anomahes is particularly reveahng, as it peaks when SST lags by a few weeks and decays at longer lag with the SST anomaly decay time. Because the atmo- spheric forcing is basically white, the covariance is neghgible when SST leads by more than the atmospheric decorrelation
time if the SST anomahes have no back interaction on the
atmosphere. Otherwise, there is a covariance which again decreases with increasing lead time as the SST anomaly. If the atmosphere acts as a negative (positive) feedback, the
covariance
changes
(keeps
the same) sign between
negative
and positive
lags [Frankignoul
et al., 1998].
To emphasize large-scale patterns of covariabihty, we used a maximum covariance analysis based on a singular value decomposition of the covariance matrix between SST
and atmospheric
(ATM) anomalies
(hereafter
SVD). To give
similar weight to each month and thus increase the effec- tive number of degrees of freedom, we first normalized the anomalies in each month by their standard deviation aver-
aged over the domain. This removes
the seasonal
cycle of
variance, but for display we go back to dimensional fields.
At each lag r (positive
when SST leads), the anomalies
are
decomposed into
2. Data
Monthly anomalies from the mean seasonal cycle were
used in the North Atlantic sector between January 1952
and December 1992. SST and turbulent surface heat flux
(sensible
plus latent) derived from the COADS dataset on
Copyright 1999 by the American Geophysical Union.
Paper number 1999GL900613. 0094-8276/99/1999GL 900613 $05.00
SST(x,t)
=
kATM(x,
t + r) = E vk(x'
r)zk(t
+ r, r)
(2)
kwhere the time series s• and z• have maximum covariance
for each k, under the constraint that the spatial patterns u•
and v• form sets of orthonormal
vectors [Bretherton et al.,
1992]. As evidence
of an oceanic
influence
turned out to be
strongest
when using the late winter (February-March-April,
2970 CZAJA AND FRANKIGNOUL: OCEANIC INFLUENCE ON THE ATMOSPHERIC CIRCULATION
SST FMA / Z500 JFM (LAG -1, SL 0 %, SCF 85 %) SST FMA / Z500 FMA (LAG 0, SL 0 %, SCF 73 %)
SST FMA / Z500 MAM (LAG 1, SL 36 %, SCF 48 %)
i
•"'-•'
' '
SST MAM / Z500 MJJ (LAG 2, SL 16 %, SCF 58 %)
SST FMA / Z500 MJJ (LAG 3, SL 1%, SCF 66 %) SST JFM / Z500 MJJ (LAG 4, SL 1 %, SCF 64 %)
(K) 0.5 0.4 0.3 0.2 0.1 0 -0.1 -0.2 -0.3 • -0.4 ' -0..5
Plate 1. SVD of Z500 (contour
5 m, negative
values
are dashed)
and winter SST anomalies
(color
scale
in K). The months
used
to define the lags, the significance level (SL) and the squared covariance fraction (SCF) explained by the mode are indicated. The
Z500 patterns have been extended westward and eastward by linear regression.
hereafter FMA) and late summer (July-August-September, hereafter JAS) SST anomalies, we only discuss these two
cases. Note that we work with monthly anomalies, not sea-
sonal ones. Only the first mode (k = 1) is considered, as
the next ones are increasingly sensitive to sampling fluctu-
ations. Scaled homogeneous covariance maps for SST and heterogeneous covariance ones for ATM, i.e, the projection
of both fields on the (normalized) time series s•(t, r) pre-
serve linear relations between them and are used for dis- play. For each lag, statistical significance of the squared
covariance
< s•(t, •')z•(t + •', •') >2 is assessed
with a Monte
Carlo approach, randomly permuting the years but not the
months of the ATM sequence, with a minimum separation of 2 yr between SST and ATM anomalies (100 realizations).
The estimated significance level is the percentage of ran- domized squared covariances for the first mode that exceeds the squared covariance being tested.
During winter, the largest squared covariances are found at lags < 0, reflecting the SST anomaly response to the
stochastic
atmospheric
forcing. The Z500-pattern (Plate 1)
SST FMA / HEAT FLUX JFM (LAG -1, SL 0 %, SCF 83 %)
SST FMA / HEAT FLUX MJJ (LAG 3, SL 0 %, SCF 71%)
SST MAM / HEAT FLUX MJJ (LAG 2, SL 0 %, SCF 61%)
./
SST JFM / HEAT FLUX MJJ (LAG 4, SL 0 %, SCF 63 %)
(K) 0.5 0.4 0.3 0.2 0.1 0 -0.1 -0.2 -0.3
Plate 2. As in Plate 1 but for the surface
turbulent
heat flux (positive
upward,
contour
3 Wm -2) instead
of Z500. Lag 0 and 1
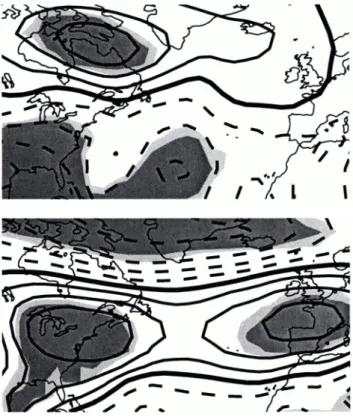
Figure 1. Correlation maps of Z500 with the SVD time series
of SST at lag 4 (contour 0.1, negative contours dashed) for winter (top) and summer SST. The dark and light shading denotes re-
spectively where the correlation is significant at the 5% and 10% level, as deduced from Monte Carlo simulations.
is similar to the Western Atlantic pattern of Wallace and
Gutzler [1981], which primarily generates
SST fluctuations
via turbulent heat exchanges (Plate 2). The SST tripole
pattern is almost identical to the first empirical orthogonal
function of SST in late winter (hereafter SST1), persisting
for more than 3 months. Similar patterns are found at lag i because of the small persistence of the atmosphere, but the squared covariance is much smaller and not significant. When the ocean leads by more than one month, however, the
squared covariance increases again and becomes significant
until lag 6 when significance is lost. The SST pattern is sim- ilar to that when the atmosphere leads, but not the Z500 one which now has a center of action west of the Labrador Sea. Anomalous anticyclonic circulation above the Labrador Sea in late spring - early summer is thus associated with SST1
at the end of the previous winter (warmer subtropical gyre, colder subpolar gyre). The relation is robust and the as-
sociated
squared
covariance
fraction about 60 % (Plate 1).
Although the mode only represents a small fraction of the
total Z500 variance (e.g., 14 % at lag 3), it locally explains
a substantial
fraction (75 % above the Labrador sea). Local
significance of the Z500 pattern can be estimated by com-
paring the heterogeneous correlation maps for Z500 with that of the Monte Carlo simulations. It is high above the Labrador Sea and the western subtropic, as illustrated in
Figure I (top). A significant signal with a similar pattern
of the same sign is also found in the lagged SVD with T700, suggesting that the tropospheric perturbation is equivalent
barotropic (not shown). Although the pattern is also seen
with SLP, statistical significance is lost.
The lagged SVD with the surface heat flux (Plate 2)
suggests that the anomalous tropospheric circulation may be driven in part by the heat exchanges associated with the SST anomaly. Indeed, the turbulent heat flux anomaly changes sign between positive and negative lags while keep- ing roughly the same pattern, so that it acts as a nega- tive feedback on the SST anomaly which then anomalously
heats or cools the atmosphere. At lag 2, a 0.406 ' SST
anomaly is associated
with a 6 Wm -2 heat flux anomaly
2 months later. Since the SST anomaly decreases by a
factor x/• in 2 months, the negative feedback
is of order
6/(0.4/x/•) _ 20 Wm-2K -z, which
agrees
with Frankig-
noul et al. [1998]. Using a similar reasoning,
the associated
Z500 perturbation would be _ 40 mK -•. However these
values may be overestimated since they are based on maxi- mized covariances. Furthermore, if the relation between SST and surface heat flux in lead and lag conditions is consistent with the stochastic model, that with Z500 is somewhat dif- ferent. The stochastic model predicts that a SST influence
should be most easily detectable at lag 2, as lag i (but not lag 2) is obscured by the persistence of Z500 (i.e. lag 1 reflects both the forcing of and response to SST). However,
SST ASO / Z500 OND (LAG 2, SL 23 %, SCF 46 %)
SST JAS / Z500 OND (LAG 3, SL 1 %, SCF 64 %)
% ß
.
SST JJA / Z500 OND (LAG 4, SL 0 %, SCF 68 %)
-0.5-0.4-0.3-0.2-0.1 0.1 0.2 0.3 0.4 0.5
2972 CZAJA AND FRANKIGNOUL: OCEANIC INFLUENCE ON THE ATMOSPHERIC CIRCULATION
the squared covariance peaks at lag 3 and 4, suggesting more complex dynamics, as discussed below.
When considering the late summer SST anomalies, the largest squared covariances between SST and Z500 are also found at lags _• 0, but the turbulent heat flux plays a lesser
role in generating
the summer SST anomalies
(not shown).
A strong evidence of an oceanic influence on the atmosphere
is again found at lag _• 2 (Plate 3). A dipolaf tropospheric
anomaly reminiscent
of the positive (negative) phase of the
North Atlantic Oscillation (hereafter NAO) is associated
in
early winter with a cooler (warmer) SST in the northeast
Atlantic and a warmer (colder) SST east of New Foundland
during the preceeding summer. A similar and equally signif- icant anomaly is found in SLP and T700 where it is shifted
slightly westward (not shown). The squared covariance is highly significant between lag 3 and 6, decaying thereafter. As in the previous case, the mode represents about 60 % of
the squared covariance, but it explains a larger fraction of
the total variance (25 % of Z500 at lag 3). As shown
in Fig.
i (bottom), both the low and high pressure
bands of the
Z500 patterns in Plate 3 are locally significant. Although we found a sign reversal of the heat flux pattern between
lag-1 and i (not shown), the signal is less clear at larger
lags and the negative heat flux feedback seems to only play a small role in the summer case. Note that these results
differ from the modelling one of Rodwell
et al. [1999], who
associated a NAO-like response to SST1 instead of the SST
pattern in Plate 3. Also, they were only considering the atmospheric response in winter (DJF).
4. Discussion
Our analysis reveals statistically significant lagged re- lationships between large-scale SST and subsequent mid-
tropospheric anomalies in the North Atlantic sector during two different seasons. In both cases, we find that the tro- pospheric signal is maximum when the SST leads the atmo- sphere by 3 to 5 months, whereas a simple stochastic climate model would predict that the maximum is found at lag 2.
Colman [1997] similarly found a gap in predictive
skill at a
lead time of 2 months. The prevalence of longer lags than predicted may result from the seasonal dependence of the atmospheric response to a given SST anomaly pattern. As the latter persists for several months, it underlies a chang- ing atmospheric background flow which may be insensitive to a SST pattern at the time when it has generated it, but strongly respond when the tropospheric flow has changed. Alternatively, the shift towards longer lags could be due to the influence of other regions which were not included in our analysis but could play an important role via telecon-
nections. By extending the correlations in Fig.1 to the global
SST field, we found that SST anomalies in the tropical At-
lantic (but not the tropical Pacific) were also associated with
the SST patterns in Plate i to 3. As the atmosphere is more persistent in the tropics, the lag 2 covariances may also be
perturbed by a small influence of the forcing patterns. In
late spring, the anomalous tropospheric circulation over the western Labrador Sea might also be related to sea ice extent anomalies. A more extended analysis aiming at understand- ing the respective role of the low and high latitudes in the SST influence revealed here is underway, using the NCEP reanalysis.
Acknowledgments. We thank D. Cayan, Scripps Insti-
tution of Oceanography, for kindly providing the heat flux and SST data, and the referees for their useful comments. This re- search was supported in part by EEC Grant ENV4-CT98-0714.
References
Bretherton, C. S., and C. S. Smith, and J. M. Wallace, An inter- comparison of methods for finding coupled patterns in climate data, J. Climate, 5, 541-560, 1992.
Cayan, D., Latent and sensible heat flux anomalies over the Northern oceans: driving the sea surface temperature, J. Phys. Oceanogr., 22, 859-881, 1992.
Colman, A., Prediction of summer central England temperature from preceding North Atlantic winter sea surface temperature, Int. J. Clim., 17, 1285-1300, 1997.
Davies, J. R., and D. P. Rowell, and C. K. Folland, North At- lantic and European seasonal predictability using an ensemble of multidecadal AGCM simulations, Int. J. Clim., 17, 1263- 1284, 1997.
Frankignoul, C., Sea surface temperature anomalies, planetary waves and air-sea feedbacks in the middle latitude, Rev. of Geophys., 23, 357-390, 1985.
Frankignoul, C. and A. Czaja and B. L'H•v•der, Air-sea feed- back in the North Atlantic and surface boundary conditions for ocean models, J. Climate, 11, 2310-2324, 1998.
Kushnir, Y. and I. Held, Equilibrium atmospheric responses to North Atlantic SST anomalies, J. Climate, 9, 1208-1220, 1996. Ratcliffe, R. A., and R. Murray, New lag associations between North Atlantic sea temperature and european pressure applied to long-range weather forecasting, Quart. J. Roy. Meteor. Soc., 96, 226-246, 1970.
Rodwell, M. J., D. P. Rowell, and C. K. Folland, Oceanic forcing of the wintertime North Atlantic Oscillation and Europeean climate, Nature, 398, 320-323, 1999.
Wallace, J. M., and D. S. Gutzler, Teleconnections in the geopo- tential height field during the Northern hemisphere winter, Monthly Weather Rev., 109, 784-812, 1981.
A. Czaja and C. Frankignoul Laboratoire d'oc•anographie Dy-
namique et de Climatologie (LODYC, T15), 4 Place Jussieu 75 005 Paris, France. (e-mail acz@lodyc.jussieu.fr)
(Received April 15, 1999; revised June 16, 1999; accepted June 18, 1999.)