HAL Id: ird-00269172
https://hal.ird.fr/ird-00269172
Submitted on 15 Apr 2008
HAL is a multi-disciplinary open access archive for the deposit and dissemination of sci-entific research documents, whether they are pub-lished or not. The documents may come from teaching and research institutions in France or
L’archive ouverte pluridisciplinaire HAL, est destinée au dépôt et à la diffusion de documents scientifiques de niveau recherche, publiés ou non, émanant des établissements d’enseignement et de recherche français ou étrangers, des laboratoires
ecological trap for tropical tuna species
Jean-Pierre Hallier, Daniel Gaertner
To cite this version:
Jean-Pierre Hallier, Daniel Gaertner. Drifting fish aggregation devices could act as an ecological trap for tropical tuna species. Marine Ecology Progress Series, Inter Research, 2008, 353, pp.255-264. �10.3354/meps07180�. �ird-00269172�
Vol. 353: 255–264, 2008 doi: 10.3354/meps07180
MARINE ECOLOGY PROGRESS SERIES
Mar Ecol Prog Ser
Published January 17
Drifting fish aggregation devices could act as an ecological trap for tropical tuna species
Jean-Pierre Hallier1, Daniel Gaertner2,*
1Institut de Recherche pour le Développement (IRD) and Regional Tuna Tagging Project–Indian Ocean (RTTP‐IO), c/o Indian Ocean Tuna Commission (IOTC), PO Box 1011, Victoria, Seychelles 2Institut de Recherche pour le Développement (IRD), UR 109, Centre de Recherche Halieutique Méditerranéenne et Tropicale, BP 171, 34203 Sète Cedex, France __________________________________________________________________________________ ABSTRACT: Purse seine fishing on fish aggregating devices (FADs) has expanded considerably during the last 15 yr in tropical tuna purse seine fisheries, and FADs currently account for about 70% of their reported tuna catches. The scientific community has expressed concern over the consequences of this fishing practice in terms of yield per recruit and suspected detrimental effects on FADassociated tunas. To explore possible detrimental effects, we compared stomach fullness, fish plumpness, growth rate, and migration behaviour between free school and drifting FAD‐associated tunas for skipjack tuna Katsuwonus pelamis and yellowfin tuna Thunnus albacares caught in the Atlantic and Indian Oceans. Significant differences in fish plumpness and individual growth rates were found, suggesting that individuals associated with drifting FADs were less healthy than those in free schools. Since stomach fullness indicated that tunas associated with FADs eat less than those in free schools, the difference in growth rate and condition could be the consequence of altered feeding patterns. For each species, significant changes in migratory direction and displacement rates were observed in the presence of drifting FADs. These findings support the hypothesis that FADs act as a super‐stimulus, misleading tunas to make inappropriate habitat selection. However, further studies are required to investigate the long‐term effect of FADs on the entire life cycle of tunas.
KEY WORDS: Ecological trap ∙ Tropical tunas ∙ Fish aggregating devices ∙ FADs ∙ Purse seiners ∙ Stomach fullness ∙ Health indicator ∙ Migratory pattern
___________________________________________________________________________ INTRODUCTION
Tropical tuna species are attracted to drifting objects at sea. Fishermen use this behaviour to their advantage by seeding numerous man‐made drifting objects, known as artificial fish aggregating devices (FADs). In both the Atlantic and Indian oceans, approximately 75% of skipjack tuna Katsuwonus pelamis, 35% of yellowfin tuna Thunnus albacares, and 85% of bigeye tuna T. obesus catches reported by purse seine fisheries are made in the vicinity of FADs (Fonteneau et al. 2000a). Skipjack in the catch are mainly adults, whereas yellowfin and bigeye are mainly juveniles (<100 cm fork length, FL). Catches of yellowfin and bigeye tuna in the Indian and Atlantic oceans are presently close to or above the maximum sustainable yield. Capturing large proportions of young fish decreases the yield per recruit, thus, these catches of juveniles are a threat to the viability of the tuna populations.This situation is partially acknowledged by tuna agencies and tuna fishing companies and a moratorium on drifting FAD fishing in the Atlantic Ocean has been established. Fonteneau et al. (2000a) proposed that the behavioural tendency of tuna to associate with FADs may have additional effects on tuna populations and fisheries, such as loss of genetic quality, negative interaction between the offshore industrial fisheries using
drifting FADs and the artisanal ones using anchored FADs, and that FADs may function as an ecological trap. The term ‘ecological trap’ describes a situation in which population growth is reduced as a consequence of individuals making a sudden maladaptive habitat choice (Gates & Gysel 1978, Schlaepfer et al. 2002). Such a situation arises when an environment change decouples behavioural cues from habitat quality, thereby misleading the individuals in such a way that they settle in poor habitats (i.e. low in quality for reproduction and survival) over other available and normally preferred ones (Battin 2004, Robertson & Hutto 2006).
Regarding tropical tuna, the sudden increase in drifting FAD fishing operations in the late 1980s may represent a case of ecological trap. This hypothesis was first discussed by Marsac et al. (2000), who distinguished three components: (1) the aggregation of fish under FADs is a fast, strong and long‐lasting process; (2) the large number of drifting FADs in the equatorial zone can alter the natural movements of this fraction of the stocks; (3) subsequently, drifting FADs negatively affect growth and natural mortality of small tuna associated with FADs.
With the aim of exploring the negative effect of drifting FADs on growth and natural movements of tunas, this study is organised as follows. First, it compares different ecological indicators: (1) stomach fullness; (2) plumpness of the fish; (3) individual growth rate; (4) migratory direction and displacement rate between fish exposed to FADs and fish caught in free schools. Then, it examines how the influence of FADs on biological aspects and behavioural choices of tropical tunas could be related to the concept of the ecological trap. MATERIALS AND METHODS
Data. Depending upon the indicator of interest, different data sets were used. Stomach and
morphometric data were collected from fresh fish on board commercial purse seiners during 11 cruises (4 in the Atlantic Ocean and 7 in the Indian Ocean). For each fish caught, the fishing mode (drifting FAD or free school) was recorded. Stomach fullness was classified as either with or without food, on a total of 543 stomachs (80.5% from the Indian Ocean). For the biometric study, only yellowfin and skipjack data collected in the Indian Ocean had sufficiently large sample sizes for a statistical analysis. FL was measured to the nearest 0.5 cm using a caliper. Thorax girth was measured to the nearest mm, just behind the pectoral fins (i.e. the point where the fish height is greatest) by using a measuring tape.
To compare growth rates and migratory patterns between drifting FAD‐ and free school‐caught tuna, we used tagging data collected by the International Commission for the Conservation of the Atlantic Tuna (ICCAT). We selected a subset of records in which release and recapture were made using surface fishing gear (purse seine or baitboat) and in which the fishing mode at recapture was reported. Tagging data thought to incorporate inaccurate date and location of release and recovery were omitted. Sample sizes and ranges of FL by species for the different data sets used are represented in Table 1. Methods. Stomach fullness: Tuna caught by purse seine may regurgitate part or all of their stomach
contents, but there are no obvious reasons why this loss would be different between FAD‐ and free schoolcaught tunas. To compare the proportions of empty stomachs between FAD‐ and free school‐ caught fishes we used the conventional Z‐statistic test for independent samples.
Plumpness: The underlying hypothesis is that tuna associated with drifting FADs will find less food in
their vicinity and consequently will be slimmer than tuna living in free schools (i.e. un‐associated with FADs). As growth of skipjack is known to vary by fishing areas in the Atlantic Ocean (Bard & Antoine 1986), the effect of the area on the slimness of the fish was considered. The 3 Eastern Indian Ocean areas selected (East Somalia, North‐West Seychelles and the Mozambique channel) were originally stratified on the basis of the tuna species composition and tuna size distributions. However, this effect was not considered for yellowfin owing to the small sample size in some areas.
Table 1. Thunnus albacares and Katsuwonus pelamis. Median and interquartile range for the fork length (cm), and sample size (n) for tuna used in the different indicators analyses. FAD = Fish aggregating devices; Free = free school.
___________________________________________________________________________________
Fishing Yellowfin Skipjack
Indicator Modes Median (IQ range) n Median (IQ range) n
___________________________________________________________________________________
Thorax girth FAD 81 (49.5 to 100.5) 69 52 (47.5 to 58) 115 Free 133 (120 to 142) 69 65 (62 to 67) 168
Growth rate FAD 47 (45.3 to 49) 66 56 (51 to 58) 272 Free 45 (44 to 49.5) 10 59 (56.8 to 60) 52
Migratory direction FAD 47 (42.3 to 50) 167 51 (44 to 58) 519 and displacement Free 47 (45 to 51) 13 60 (57.8 to 61) 52 ___________________________________________________________________________________
A linear relationship was assumed between the dependent variable thorax girth (TG) and the explanatory variables: FL, fishing mode, observer at sea, and area. No transformation was planned a
priori, but a first screening of the residual values corresponding to the most complete model depicted a strong heteroscedasticity. Thus, FL and TG were log‐transformed before model selection. The model specification can be described as follows: O A FM X Y =
β
0+β
1 +β
2 +β
3 +β
4 where Y = log(TG); X = log(FL); FM = the fishing mode: free school = 0 or FAD = 1; A = the location: East Somalia, North‐West Seychelles and Mozambique channel: 1, 2, 3, respectively; and O = the observer aboard: 1, 2,…k (k varying from 3 to 4 according to the data set).In this study, FM, A and O were treated as categorical variables and were set up in such a way that all levels were contrasted with a reference level to ensure that the design matrix was of full rank. The reference levels were: free school, East Somalia area, and the first observer’s name according to alphabetic order, respectively.
The objective in model building was to reach a trade‐off between the extremes of underfitting and overfitting the model to the data. In this context, Akaike’s Information Criterion adjusted for small sample size (AICc) was used to select the best model. Outliers and influential observations were identified by usual methods such as studentized residuals and Cook’s distance diagnostics.
Growth rate: It is uncertain how much time tuna typically associate with a FAD, or stay within the
influence area of a network of drifting FADs (for the sake of simplicity we assumed a similar effect for a tuna staying under the same FAD for a long time or visiting several FADs over the same period of time). Based on observations of residence time of tropical tuna around anchored FADs (Ohta et al. 2001, Itano et al. 2004) or aggregated at seamounts (Holland et al. 1999, Klimley et al. 2003), only tuna for which time at liberty was larger than 5 d were considered suitable for the purpose of the analysis (even if it was unclear whether residency under drifting FADs can be considered the same as under anchored FADs or at seamounts). To minimize measurement errors, unrealistic growth rates (i.e. difference in length between release and recapture divided by time at liberty) shorter or larger in absolute value than 0.9 cm d–1 were also omitted. In addition, to remove the possible area effect on growth rate for skipjack, only tagging data for skipjack released and recaptured between Latitude 10°N and Latitude 10° S were used. In contrast, given the lack of evidence of a similar area effect on the growth of yellowfin, we used the entire yellowfin tagging data set without spatial constraints.
Because the data may be skewed, we were more interested in the difference in medians than in means. However with medians, we did not have a useful way of calculating SE, which is needed to compute a traditional t‐statistic when comparing two samples. One alternative was to use randomization methods (Manly 1997). The rationale for the permutation test is based on a conceptual notion of exchangeability among the observations under the null hypothesis. So, we randomly redistributed all the observed growth rates into two groups according to the size of the original groups, and calculated the difference in medians. Repeating this 4999 times (i.e. a number commonly used in permutation test) gave the empirical sampling distribution of differences between medians when the null hypothesis was true. The p‐value is the proportion of times the randomly generated differences exceeded the observed difference in medians of the original groups. Migratory direction and displacement rate: To exclude directional changes during migration due to seasonal effects, only tuna released and recaptured in summer 2002 were included in the analyses of the angular direction and the displacement rate. To ascertain whether drifting FAD fishing operations may influence the migratory direction of tuna, we used circular statistics. Circular distributions are commonly summarized as locations on a unit circle or as angles over a 360° or 2π radians range (Fisher 1993). The angular migratory direction of each individual was derived from tagging positions at release and at recapture using conventional trigonometric equations with true north as the zero‐direction (azimuth) and a clockwise sense of rotation. For each fishing mode, we used vector addition of individual vectors to calculate the mean direction (
θ
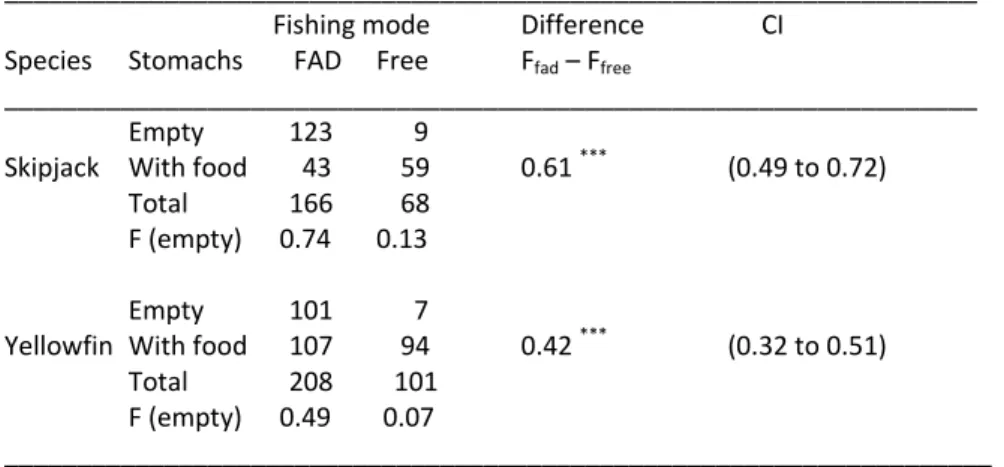
) and the mean resultant length (R) (Fisher 1993, p. 30–32).Rao’s spacing test of uniformity was used to test whether the angular migrations differed significantly from randomness because it has greater power to detect departures from uniform distributions of data with multiple modes and wide angular dispersion than Rayleigh’s test or Watson’s U2 test (Bergin 1991). Instead of testing separately whether mean directions and then dispersions were the same for the two focus groups, we adopted a more general test of homogeneity based on Fisher’s Wr statistic (Fisher 1993, p. 122–123). Then, the observed value Wr was compared with the empirical sampling distribution of values obtained by randomly reordering the data. The second variable used to characterize the migratory pattern of tropical tuna was the displacement by day at liberty. To account for the curvature of the earth, the net displacement was performed as the great‐circle distance (namely, the orthodromic distance) between the geographic coordinates of release and recapture. Once again, the difference in median displacement rate between the two groups of fish was assessed by a randomization method1. RESULTS Stomach fullness The effect of the fishing mode on stomach fullness is summarized in Table 2. In general, there was a significantly higher percentage of empty stomachs in tuna associated with FADs (p < 0.001). For skipjack, 74% of stomachs from tuna caught under FADs were empty, against 13% for those caught in free schools. For yellowfin, the percentages of empty stomachs were 49 and 7% for FAD‐ and free school‐ caught, respectively. A similar trend was observed for bigeye tuna Thunnus obesus, but is not presented in this study due to the small sample size. Skipjack stomachs appeared to always contain less food than yellowfin stomachs.
1
Statistical analyses were conducted with S-Plus (v.7.0) and, for circular data, with the circstats20 library (from U. Lund at California
Polytechnic State University: http/statweb. calpoly.edu/ulund/)
Table 2. Thunnus albacares and Katsuwonus pelamis. Comparison of stomach fullness by species and by fishing mode. Values are no. of stomachs either empty or with food; F. (empty): fraction of empty stomachs; FAD: Fish Aggregating Device, Free: free school; Difference: F (empty)fad – F (empty)free ; CI: 95% confidence intervals. ***: p<0.001.
___________________________________________________________________
Fishing mode Difference CI
Species Stomachs FAD Free Ffad – Ffree
___________________________________________________________________
Empty 123 9
Skipjack With food 43 59 0.61 *** (0.49 to 0.72)
Total 166 68
F (empty) 0.74 0.13
Empty 101 7
Yellowfin With food 107 94 0.42 *** (0.32 to 0.51)
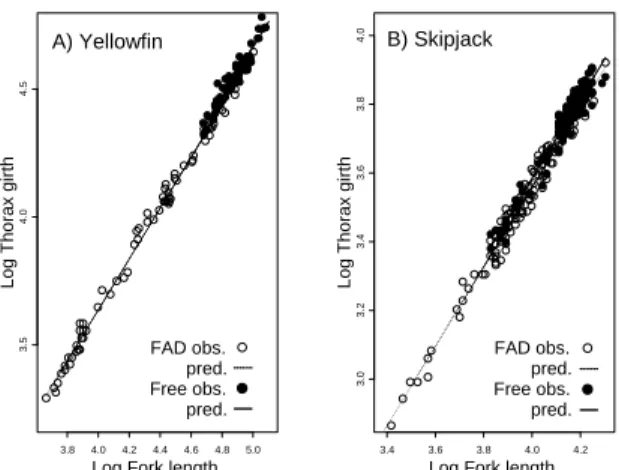
Total 208 101 F (empty) 0.49 0.07 ____________________________________________________________________ Plumpness For yellowfin, the smallest AICc statistic (indicating best fit) was reached for the model composed of the effects of: fishing mode (FM), FL (X), and observer (O), (i.e. FM + X + O), (Table 3; from this model FM = –0.032, t = 4.270). FM was negative for all the candidate models, suggesting that FAD‐caught yellowfin were slimmer than those caught in free schools (Fig. 1a). Table 3 Thunnus albacares and Katsuwonus pelamis. Model selection for relationship between thorax girth and fork length (X = Log FL), the fishing mode (FM), area (A) and observer (O) by species (yellowfin 138 and skipjack 238 observations, respectively). Additional information gives no. of parameters (Par), Akaike Information criterion (AICc), and parameter estimates for FM, for its interaction with Log (FL) (FM:X) and corresponding standard errors (SE). na: not available.
_____________________________________________________________________________ Species Model Par AICc FM SE(FM) FM:X SE(FM:X) _____________________________________________________________________________ FM+X+O 5 ‐583.60 ‐0.032 0.008 0.000 na Yellowfin FM*X+O 6 ‐581.55 ‐0.132 0.169 0.021 0.035 FM+X 3 ‐500.98 ‐0.006 0.010 0.000 na FM+X+A+O 7 ‐1207.03 ‐0.026 0.005 0.000 na FM*X+A+O 8 ‐1205.32 ‐0.099 0.118 0.018 0.029
Skipjack FM+X+O 6 ‐1204.12 ‐0.030 0.005 0.000 na
FM+X*A+O 9 ‐1204.05 ‐0.025 0.005 0.000 na FM*X+A*X+O 10 ‐1202.86 ‐0.146 0.126 0.029 0.031 _____________________________________________________________________________ For skipjack, the best fitting model was: Y = FM +X + A + O; where A is the effect of location (Table 3; from this model FM = –0.026; t = 5.144). This provides strong evidence that FAD‐caught skipjack were significantly thinner than those caught in free schools (Fig. 1b).
3.8 4.0 4.2 4.4 4.6 4.8 5.0 3. 5 4 .0 4. 5
Log Thorax girth
Log Fork length FAD obs. pred. Free obs. pred. A) Yellowfin 3.4 3.6 3.8 4.0 4.2 3. 0 3 .2 3. 4 3 .6 3. 8 4 .0
Log Thorax girth
Log Fork length FAD obs. pred. Free obs. pred. B) Skipjack Figure 1. Thunnus albacares and Katsuwonus pelamis. Relationship between observed values fork length and thorax girth for (A) yellowfin and (B) skipjack recaptured in free school or under fish aggregating devices (FAD) in the Indian Ocean. Fitted values: solid line, free school; dashed line, FADs.
Growth rate
In the Atlantic Ocean, released and recaptured yellowfin associated with FADs exhibited a lower growth rate than those in free schools; a difference of 0.03 cm d–1 of liberty (Fig. 2). However, the difference was negative and as large as 0.03 only for 15.6% of the 4999 randomizations. Consequently, this test was not significant at the usual significance levels. Because the sample size was moderate, it would be beneficial to repeat this analysis on a larger data set. Released and recaptured skipjack associated with FADs grew more slowly (a difference of 0.042 cm d–1 of liberty) than un‐associated skipjack (Fig. 2). Therefore, for skipjack the null hypothesis that the growth rates and fishing modes are unrelated can be confidently rejected (p < 0.001). As for yellowfin, the length distributions of skipjack associated with FADs and skipjack in free schools were comparable (Table 1), so a difference in growth rate cannot be explained by a difference in the size of the fish.
Free FADs Free FADs
-0.2 0.0 0 .2 0.4 0 .6 0.8
Growth / Days at sea
Yellowfin Skipjack
Figure 2. Thunnus albacares and Katsuwonus pelamis. Parallel boxplots of growth rates estimated from tagging data for yellowfin and skipjack recaptured in free schools or under FADs in the Atlantic Ocean. Bold line: median; box: 25 and 75 percentiles; whiskers: smallest and largest observation.
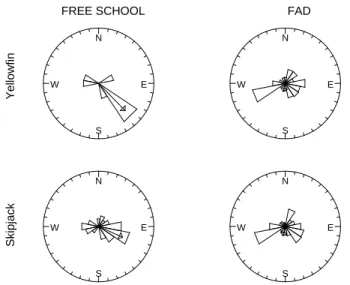
Yellowfin showed different migratory directional preferences dependent on the fishing mode (Fig. 3). The mean directions (
θ
) were 193.8° and 135.7° for FADs and free schools, respectively (Table 4). Rdecreased from 0.69 for free schools to 0.16 for FADs. Similar results were found for skipjack (Fig. 3); individuals associated with FADs exhibited a low individual concentration but also a modal angular direction oriented at SSW (193.2°). Skipjack recaptured in free schools showed a mean direction of 114° and also exhibited a more concentrated modal course (Table 4). Although the apparent migratory direction of fish associated with FADs was scattered, the null hypothesis of uniformity was rejected for all of the 4 circular distributions considered (Rao’s statistic, Table 4).
Table 4. Thunnus albacares and Katsuwonus pelamis. Mean angle direction (
θ
), mean vector length (R), sample size (n), Rao's spacing test of uniformity (i.e., test of randomness) and Fisher’s Wr (i.e., test of homogeneity) estimated from tagging data for yellowfin and skipjack recaptured in free schools or under FADs in the Atlantic Ocean. **p<0.01, ***p<0.001_________________________________________________________________________ Species Fishing
θ
(°) R n Rao’s U Wrmode _________________________________________________________________________ Yellowfin FADs 193.81 0.155 167 266.61 *** 9.91 ** Free 135.74 0.689 13 220.73 *** Skipjack FADs 193.19 0.176 519 266.01 *** 26.61 *** Free 114.08 0.477 52 225.62 *** _________________________________________________________________________ Concerning the comparison of the orientation patterns of the 2 groups of yellowfin, the probability of obtaining a value of Fisher’s statistic of homogeneity as large as 9.91 is 0.007. This would generally be regarded as strong evidence against the null hypothesis. For skipjack, the distributions of angular measurements also differed significantly between the two groups (observed Wr = 26.61; p < 0.001). E N W S E N W S E N W S E N W S Skipjack Yellowfin
FREE SCHOOL FAD
Figure 3. Thunnus albacares and Katsuwonus pelamis. Rose diagrams of the migratory direction of yellowfin (upper) and skipjack (lower) recaptured in free schools (left) or under FADs (right) in the Atlantic Ocean. The arrow gives the mean direction of the sample and is drawn according to the mean vector length relative to the radius of the circle = 1.
Recaptured yellowfin associated with FADs moved significantly farther than those recaptured in free schools (median = 13.192 nautical miles [n mile] d–1 of liberty, compared with 2.882 n mile d–1, respectively; p < 0.001). The displacement rate was also significantly larger (p < 0.001) for skipjack recaptured under FADs (14.872 n mile d–1) than for those in free schools (4.64 n mile d–1). For each species, the null hypothesis of absence of FAD effect on the displacement rate was not supported by the data. DISCUSSION AND CONCLUSIONS Effect of the FADs The large proportion of empty stomachs in tuna associated with FADs is generally more pronounced for skipjack than for yellowfin and bigeye. This has been observed by several authors (Ménard et al. 2000, Potier et al. 2001) and is reinforced by the present study. However, it can be argued that the comparison of FAD‐ and free school‐caught tuna is biased. There are two possible reasons for this: (1) differences in fishing time and (2) size differences in fish caught from FADs or free schools.
(1) Differences in fishing time. Most FAD sets occur early in the morning (Hallier & Parajua 1999), while in contrast, free school sets occur throughout daylight hours. Small tuna, which congregate around FADs, feed mostly during daylight hours and consequently the proportion of empty stomachs for small tuna is high in the FAD early morning catch. In contrast, most tuna caught from free schools later in the day will have had more time to feed, so their stomachs will be fuller. Nevertheless, in the present study, when only sets occurring after 11:00 h are selected, there are still more empty stomachs in tuna from FADs than from free schools. For both species combined, 63.9% of stomachs sampled from FADs before 11:00 h were empty, only 44.9% were empty after 11:00 h. For free schools, these proportions were 15.6 and 6.7%, respectively.
(2) Size differences. FAD‐caught tuna are commonly smaller than those caught in free schools. However, for both species combined, 71.8% of the stomachs examined for small fish (<60 cm) caught under FADs were empty compared to 35.2% for larger fish (≥60 cm). For free school‐caught tuna, these percentages were 20 and 6.7%, respectively. Two particular conclusions follow from this: (1) food intake by tuna associated with FADs, regardless of size and the time of day, is always lower than the food intake of tuna from free schools, and (2) food intake increases between morning and afternoon caught tunas and between small and large tuna when associated with FADs. TG reflects the overall condition or plumpness of fish and can be used as a fish health indicator. Thus, differences in thorax girth suggest that individuals associated with FADs were not as healthy as those in free schools. Declines in condition may reflect low energy reserves and could be the consequence of altered feeding patterns as inferred from the analysis of stomach fullness. This assumption is also consistent with the findings concerning the adverse impact of FADs on the individual growth rates, although further investigation is required for yellowfin.
The possibility of slimmer tuna on drifting FADs has already been tested from biometric data collected in the Atlantic Ocean on frozen tuna unloaded in Abidjan (Cote d’Ivoire), in a study related to escape gaps for juvenile tuna in purse seine nets (Gaertner et al. 1999). However, there was no evidence of a morphometric difference between free school‐ or FAD‐caught tuna. From the same dataset, Marsac et al. (2000) analyzed the width (height of the body) versus the FL in an area north of 5° N. They found that skipjacks from FADs were slimmer than those from free schools. Nevertheless, this result has not been demonstrated for the other areas of the Eastern Atlantic Ocean. The frozen state of the fish may be responsible of this lack of evidence. It should be noted that the Japanese tuna industry recognizes that skipjack caught on FADs have less fat than those from free schools. For example, in the preparation of
the katsuwobushi (shaven dried tuna) in Japan, FAD caught skipjack tuna is preferred. It is believed the lower fat content increases the shelf life of the final product (T. Nishida pers. comm.). The results of this study support the hypothesis that the attraction and the retention of tuna around drifting FADs affects them negatively in terms of growth and condition. It is likely that tuna remaining in the vicinity of FADs will have less chance to find food than those roaming freely, and this situation will increase competition for food among individuals associated with FADs (Bromhead et al. 2000). It is then justified to suspect other detrimental effects such as higher natural mortality and disruptions to their natural migrations.
One weakness of this study is that conventional tagging data do not provide detailed information on the migratory behaviour of the fish during its liberty. That is to say, the individual migrations are likely to be more complex than directed movements with straight trajectories, and that the residence time under a network of drifting FADs is still unknown. However, even with these limitations in mind, the results clearly showed that individuals tagged and released under similar conditions exhibited different movement behavior according to the fishing mode at recapture. If the migratory behaviour of each species appears to be heavily influenced by the presence of drifting FADs, it seems logical to assume that the expected changes will present some similarities in terms of migration patterns, and they do. Looking at un‐associated fish, the migratory directions differed significantly between yellowfin and skipjack (observed Wr = 11.26, p = 0.002). By contrast, for both species recaptured under FADs there was no indication of species preference in angular direction (observed Wr = 7.09, p = 0.065). Concerning the displacement per day of liberty, once again there was a significant difference between the 2 species for un‐associated fish (difference = 1.758 n mile d–1; p = 0.006) but tuna associated with FADs moved at comparable distances whatever the species considered (difference in median distance = 1.680 n mile d–1; p = 0.159). These results imply that the influence of FADs is strong enough to remove the normally observed discrepancies on the migratory patterns of yellowfin and skipjack.
Implementation of FADs and the concept of ecological trap
Previous investigations on ecological trap have concentrated on maladaptive behaviours affecting terrestrial taxa: birds (Dwernychuk & Boag 1972, Mundy 1983, Donovan & Thompson 2001, Woodward et al. 2001, among others), insects (Haynes et al. 1986, Kriska et al. 1998), and reptiles (Fritts 1982, Bjorndal et al. 1994, Witherington 1997, Kolbe & Janzen 2002). All these studies focus on animal behaviour leading to negative effects following a sudden environment change caused by anthropogenic effects. However, there is little evidence for demonstrating the existence of an ecological trap in fishery studies because preference for habitat and individual choices are difficult to detect within most fisheries data.
The behaviour of gathering around floating drifting objects at sea has probably been selected through evolution among tropical tuna and other species. Among the hypotheses raised to explain this behaviour, the ‘indicator‐FAD’ and the ‘meeting point’ hypotheses seem more credible. The ‘indicator‐ FAD’ hypothesis suggests that natural floating objects are often indicators of productive areas, either because most natural objects (e.g. logs) originate in areas with additional terrigenous inputs and remain within these rich bodies of water, or because they aggregate in rich frontal (convergence) zones where subduction of one water body under another causes floating objects to collect (Hall 1992). Accordingly, tuna associated with these objects will increase their probability in finding rich feeding zones. The ‘meeting point’ hypothesis considers that tuna make use of floating objects to increase the encounter rate between isolated individuals, or small schools, and other schools (Fréon & Misund 1999). Under this hypothesis, the natural tuna environment is considered to be a few widespread floating objects in food‐ poor areas and a high density of floating objects in food‐rich areas. Tuna associated with floating objects in food‐poor areas will tend to leave them to search for better feeding grounds but, owing to the scarcity
of floating objects in these poor zones, the probability of encountering other natural floating objects will be low. With time, most of these fish will reach good feeding grounds where they may encounter natural floating objects. According to this scenario, tunas should not suffer from the association with floating objects, as they should benefit from the food‐rich environment and from increasing their encounter rate with conspecifics.
Whatever the hypothesis considered, the increasing use of drifting FADs by purse seine fisheries in the world oceans since the late 1980s has dramatically modified these natural conditions. In this altered environment, tunas leaving a FAD have a high probability of encountering other FADs. Consequently, they can be trapped by FADs in a poor quality habitat. Purse seine fishermen do not base the seeding of their FADs on the richness of the waters, but on the existence of well‐defined current structures which give them a well predicted trend in the dispersion of their FADs.
In the Atlantic Ocean, one consequence of the implementation of drifting FADs at the end of the eighties has been the westward extension of the tuna surface fishery as far as longitude 30°W, probably due to the westward drift pattern of FADs (Ariz et al. 1999). Although some caution is needed due to the tagging data used, ours results are in agreement with a westward change in migration pattern (Fig. 3) and with a substantial increase in displacement rate (by approximately a factor of 4). As a consequence, FADs may function as ecological traps by attracting tuna into riskier habitats. Previous studies on the displacement of tuna have described their attraction to certain points at sea: such as to anchored FADs and seamounts in Hawaii (Itano & Holland 2000), to FADs and islands in the Western Pacific (Kleiber & Hampton 1994), and to baitboats in Senegal (Fonteneau & Diouf 1994, Hallier & Delgado de Molina 2000). The results indicate that tuna have a certain fidelity to different routes and structures Klimley & Holloway (1999). As observed by Klimley et al. (2003, p. 688): ‘an allegiance of tuna to one school, a predilection for returning to the site of tagging, and precise timing when visiting sites, are consistent with tuna having migratory pathways consisting of ‘waypoints’ that are visited with temporal regularity’. This behaviour, coupled with the attraction of tuna to floating objects, could explain that once lured and trapped in a dense network of drifting or anchored FADs, tuna may spend too much time near FADs to the detriment of their food intake. With time, this attraction process should lead to a decrease in the number of free schools made up of small tuna of mixed species (i.e.with most small tuna attracted to FADs, fewer will remain available to form free schools). In fact, such asituation has been described by Fonteneau et al. (2000b) in the Gulf of Guinea, where the percentage of mixed species free schools decreased from 48% in 1981 to 23% in 1999 (these two time periods are representative of a before and after use of FADs in this area).
These findings suggest that the implementation of FADs in the surface tuna fishery led to an increase in the attraction of tuna to a habitat in the absence of a change in the suitability of the habitat. Such a situation corresponds to one of the 3 conditions giving rise to an ecological trap, as reported by Robertson & Hutto (2006, p. 1076): ‘an ecological trap will arise if the settlement cues normally used by an individual change in intensity, type, or number such that the habitat becomes more attractive while habitat suitability remains unchanged (the settlement cues have changed, but not the ultimate factors)’. No information is available on the residence time under FADs necessary to generate a significant impact on the ecological indicators analyzed in this study, but tracking of sonic tagged tuna has shown a strong tendency for tuna to remain for lengthy periods with the FADs where they were tagged (Cayré 1991, Holland et al. 1999, Dagorn et al. 2000, Otha et al. 2001). Hallier & Delgado de Molina (2000) have shown that once tuna are associated with a floating structure (in the case of these authors: a baitboat), they tend to remain with this structure; if they leave it, they will preferably join a similar one (96% of fish tagged and recaptured in a school associated with a baitboat came from the same school or from schools associated with other baitboats). These results suggest that associated tuna will tend to favour association behaviour instead of joining a free school.
Our study revealed that tropical tuna exposed to drifting FADs exhibit changes not only in their growth and their condition but also in their apparent migratory pattern. For this reason, one can assume that these cumulative responses impaired the fitness of individuals associated with FADs. Despite our limited sampling design, the patterns found suggest that tuna may be trapped into a maladaptive behavior al strategy caused by the massive use of drifting FADs in the tropical ocean. In this context, drifting FADs might be described as a sort of super‐normal stimulus, able to draw away individuals from higher quality habitat to areas of poorer quality habitat.
Nevertheless, even if it appears that there is a negative relationship between a fitness component and the behavioural choice, caution is required before inferring that the existence of an ecological trap will result in a long‐term population decline (Robertson & Hutto 2006). The entire life cycle of tuna must be taken into account, because the novel habitat could have compensating effects on the survival and reproduction of the different age classes. Although we cannot demonstrate that the life cycle of tuna has become compromised after the massive use of drifting FADs, it is sensible to assume that if individual growth is stunted, age at first maturity will be delayed and natural mortality will increase. Future investigations of the effects of FADs could include further comparative analyses on reproduction, size at‐ maturity, and mortality.
The management implications of an ecological trap due to the use of FADs should be analysed in the light of the status of the stock. Any modification to habitat attractiveness caused by anthropogenic effects can lead to rapid population decline for stock fully‐ or overexploited (part of an already depleted stock will be lured in areas less favourable for growth, survival and reproduction). Conversely, in a situation of moderate fishing intensity, it can be assumed that a proportion of the fish attracted to areas of low quality habitat will be compensated for by the fish choosing areas of high quality habitat (once the preferred habitat is filled up, the remaining individuals are forced to settle in the inferior habitat; Battin 2004). Any sound management of tropical tuna stock should not ignore this issue. Acknowledgements. This study has benefited from the scientists, technicians and observers who participated in the collection of data at sea (thorax girth and stomach fullness): M. Potier, A. S. Asine, R. Sabatier, F. X. Bard, J. Bourjea, P. Dewals, and O. Maury. Our thanks also go to the captains and crews of the following purse seiners and to their corresponding boat owners: ‘Torre Giulia’, ‘Harmattan’, ‘Gueriden’, ‘Kersaint’, ‘Tallenduic’, ‘Avel Vad’, and ‘Avel Vor’. Data collection complied with the current laws of the different countries in which they were collected and with the international guidelines concerning the use of animals in research and/or the sampling of endangered species. Although most of the tagging operations were realized by one of us (J.P.H.), we completed the tagging data with the ICCAT tagging database. We are indebted to all the scientists involved in tagging programs under this agency, as well as to P. Kebe and C. Palma in charge of the data processing at the ICCAT secretariat.
LITERATURE CITED
Ariz J, Delgado A, Fonteneau A, Gonzalez Costas F, Pallares P (1999) Logs and tunas in the Eastern Tropical Atlantic. A review of present knowledge and uncertainties. In: Scott MD, Bayliff WH, Lennert‐ Cody CE, Schaefer KM (eds) Proceedings of the International Workshop on Fishing for Tunas Associated with Floating Objects, La Jolla, CA, February 11–13, 1992. Inter‐Am. Trop. Tuna Comm. Spec. Rep. 11:21–65
Bard FX, Antoine L (1986) Croissance du listao (Katsuwonus pelamis) dans l’Atlantique est. In: Symons PEK, Miyake PM, Sakagawa GT (eds) Proc. ICCAT Conf. Int. Skipjack Year Prog, ICCAT, Madrid, p 301– 308
Battin J (2004) When good animals love bad habitats: ecological traps and the conservation of animal populations. Conserv. Biol. 18:1482–1491
Bergin TM (1991) A comparison of goodness‐of‐fit tests for analysis of nest orientation in western kingbirds (Tyrannus verticalis). Condor 93:164–171
Bjorndal KA, Bolton AB, Lagueux CJ (1994) Ingestion of marine debris by juvenile sea turtles in coastal Florida habitats. Mar. Pollut. Bull. 28:154–158
Bromhead D, Foster J, Attard R, Findlay J, Kalish J (2000) A review of the impact of fish aggregating devices (FADs) on tuna fisheries. In: Anonymous. Final report to Fisheries Resources Research Fund. Australian Bureau of Rural Sciences, Canberra
Cayré P (1991) Behaviour of yellowfin tuna (Thunnus albacares) and skipjack tuna (Katsuwonus pelamis) around fish aggregating device (FADs) in the Comoros Islands as determined by ultrasonic tagging. Aquat. Living Resour. 4:1–12
Dagorn L, Josse E, Bach P (2000) Individual differences in horizontal movements of yellowfin tuna (Thunnus albacares) in nearshore areas in French Polynesia, determined using ultrasonic telemetry. Aquat. Living Resour. 13: 192–202
Donovan TM, Thompson FR III (2001) Modeling the ecological trap hypothesis: a habitat and demographic analysis for migrant songbirds. Ecol. Appl. 11:871–882
Dwernychuk LW, Boag DA (1972) Ducks nesting in association with gulls—an ecological trap? Can. J. Zool. 50: 559–563
Fisher NI (1993) Statistical analysis of circular data. Cambridge University Press, Cambridge
Fonteneau A, Diouf T (1994) An efficient way of bait‐fishing for tunas recently developed in Senegal. Aquat. Living Resour. 7:139–151
Fonteneau A, Pallares P, Pianet R (2000a) A worldwide review of purse seine fisheries on FADs. In: Le Gall JY, Cayré P, Taquet M (eds) Pêche thonière et dispositifs de concentration de poissons. Actes Colloques‐IFREMER 28:15–35
Fonteneau A, Ariz J, Gaertner D, Nordstrom V, Pallares P (2000b) Observed changes in the species composition of tuna schools in the Gulf of Guinea between 1981 and 1999, in relation with the fish aggregating device fishery. Aquat. Living Resour. 13:253–257
Fréon P, Misund OA (1999) Dynamics of pelagic fish distribution and behaviour: effects on fisheries and stock assessment. Blackwell Science, Oxford
Fritts TH (1982) Plastic bags in the intestinal tracts of leatherback marine turtles. Herpetol. Rev. 13:72–73 Gaertner D, Dewals P, Marsac F (1999) Relations biométriques utilisables dans les études sur l’échappement des juvéniles de thonidés tropicaux dans les sennes. ICCAT Coll. Vol. Sci. Pap. 49:323– 332
Gates JE, Gysel LW (1978) Avian nest dispersion and fledging success in field–forest ecotones. Ecology 59:871–883
Hall MA (1992) The association of tunas with floating objects and dolphins in the Eastern Pacific Ocean. VII. Some hypotheses on the mechanisms governing the association of tunas with floating objects and dolphins. Background document for the International Workshop on the Ecology and Fisheries for Tunas Associated with Floating Objects, February 11–13, 1992, La Jolla, CA
Hallier JP, Delgado de Molina A (2000) Baitboat as a tuna aggregating device. Le canneur: un dispositif de concentration des thons. In: Le Gall JY, Cayré P, Taquet M (eds) Pêche thonière et dispositifs de concentration de poissons. Actes Colloques‐IFREMER 28:553–578
Hallier JP, Parajua JI (1999) Review of tuna fisheries on floating objects in the Indian Ocean. In: Scott MD, Bayliff WH, Lennert‐Cody CE, Schaefer KM (eds) Proc Int Workshop on Fishing for Tunas Associated with Floating Objects, La Jolla, CA, February 11–13, 1992. Inter‐Am. Trop. Tuna Comm. Spec. Rep. 11:195–221
Haynes KF, Li WG, Baker TC (1986) Control of pink bollworm moth (Lepidoptera: Gelechiidae) with insecticides and pheromones (attracticide): lethal and sublethal effects. J. Econ. Entomol. 79:1466– 1471
Holland KN, Kleiber P, Kajiura SM (1999) Different residence times of yellowfin tuna, Thunnus albacares, and bigeye tuna, Thunnus obesus, found in mixed aggregations over a seamount. Fish. Bull. US 97:392–395
Itano DG, Holland KN (2000) Movement and vulnerability of bigeye (Thunnus obesus) and yellowfin tuna (Thunnus albacares) in relation to FADs and natural aggregation points. Aquat. Living Resour. 13:213– 223
Itano DG, Holland KN, Dagorn L, Grubbs D, Papastamatiou Y (2004) Monitoring movement patterns, residence times and feeding ecology of tuna, billfish and oceanic sharks within a network anchored FADs. Secretariat of the Pacific Community. 17th Meeting of the Standing Committee on Tuna and Billfish. Working paper, SCTB 17, BIO‐2. Available at: http://www.spc.int/oceanfish/Html/SCTB/SCTB17/BIO‐ 2.pdf
Kleiber P, Hampton J (1994) Modeling effects of FADs and islands on movement of skipjack tuna (Katsuwonus pelamis): estimating parameters from tagging data. Can. J. Fish. Aquat. Sci. 51:2642– 2653
Klimley AP, Holloway CF (1999) School fidelity and homing synchronicity of yellowfin tuna, Thunnus
albacares. Mar. Biol. 133:307–317 Klimley AP, Jorgensen SJ, Muhlia‐Melo A, Beavers SC (2003) The occurrence of yellowfin tuna (Thunnus albacares) at Espiritu Santo Seamount in the Gulf of California. Fish. Bull. US 101:684–692 Kolbe JJ, Janzen FL (2002) Impact of nest‐site selection on nest success and nest temperature in natural and disturbed habitats. Ecology 83:269–281 Kriska G, Horvath G, Andrikovies S (1998) Why do mayflies lay their eggs en masse on dry asphalt roads? Water imitating polarized light reflected from asphalt attracts Ephemeroptera. J. Exp. Biol. 201:2273– 2286 Manly BFJ (1997) Randomization, bootstrap and Monte Carlo methods in biology, 2nd edn. Chapman & Hall, London Marsac F, Fonteneau A, Ménard F (2000) Drifting FADs used in tuna fisheries: an ecological trap? In: Le Gall JY, Cayré P, Taquet M (eds) Pêche thonière et dispositifs de concentration de poissons. Actes Colloques‐IFREMER 28:537–552
Ménard F, Fonteneau A, Gaertner D, Nordstom V, Stéquert B, Marchal E (2000) Exploitation of small tunas by purse seine fishery with Fish Aggregating Devices and their feeding ecology in an Eastern Tropical Atlantic ecosystem. ICES J. Mar. Sci. 57:525–530
Mundy PJ (1983) The conservation of the Cape Griffon vulture of southern Africa. In: Wilbur SR, Jackson JA (eds) Vulture biology and management. University of California Press, Los Angeles, CA, p 57–74 Ohta I, Kakuma S, Kanashiro K (2001) Aggregating behavior of yellowfin and bigeye tuna tagged with
coded ultrasonic transmitters around FADs in Okinawa, Japan.In: Sibert JR, Nielsen J (eds) Electronic tagging and tracking in marine fisheries. Kluwer Academic, Dordrecht, p 131–145
Potier M, Sabatié R, Menard F, Marsac F (2001) Preliminary results of tuna diet studies in the West Equatorial Indian Ocean. IOTC Proc. 4:273–278
Robertson BA, Hutto RL (2006) A framework for understanding ecological traps and an evaluation of existing evidence. Ecology 87:1075–1085
Schlaepfer MA, Runge MC, Sherman PW (2002) Ecological and evolutionary traps. Trends Ecol Evol 17:474–480
Witherington BE (1997) The problem of photopollution for sea turtles and other nocturnal animals. In: Clemmons JR, Buchholz R (eds) Behavioral approaches to conservation in the wild. Cambridge University Press, Cambridge, p 303–328
Woodward AA, Fink AD, Thompson FR III (2001) Edge effects and ecological traps: effects on shrubland birds in Missouri. J. Wildl. Manag. 65:668–675