HAL Id: hal-03033012
https://hal.archives-ouvertes.fr/hal-03033012
Submitted on 1 Dec 2020HAL is a multi-disciplinary open access
archive for the deposit and dissemination of sci-entific research documents, whether they are pub-lished or not. The documents may come from teaching and research institutions in France or abroad, or from public or private research centers.
L’archive ouverte pluridisciplinaire HAL, est destinée au dépôt et à la diffusion de documents scientifiques de niveau recherche, publiés ou non, émanant des établissements d’enseignement et de recherche français ou étrangers, des laboratoires publics ou privés.
Hydraulic management of coastal freshwater marsh to
conciliate local water needs and fish passage
Leo Guiot de la Larochere, Ludovic Cassan, David Dorchies, Pierre Sagnes,
Gilles Belaud
To cite this version:
Leo Guiot de la Larochere, Ludovic Cassan, David Dorchies, Pierre Sagnes, Gilles Belaud. Hydraulic management of coastal freshwater marsh to conciliate local water needs and fish passage. Journal of Ecohydraulics, 2020, pp.0. �10.1080/24705357.2020.1792364�. �hal-03033012�
OATAO is an open access repository that collects the work of Toulouse
researchers and makes it freely available over the web where possible
Any correspondence concerning this service should be sent
to the repository administrator:
tech-oatao@listes-diff.inp-toulouse.fr
This is an author’s version published in:
http://oatao.univ-toulouse.fr/26783
To cite this version:
Guiot de la Larochere, L�o and Cassan, Ludovic and
Dorchies, David and Sagnes, Pierre and Belaud, Gilles
Hydraulic management of coastal freshwater marsh to
conciliate local water needs and fish passage. (2020) Journal
of Ecohydraulics.
Official URL:
https://doi.org/10.1080/24705357.2020.1792364
Open Archive Toulouse Archive Ouverte
Hydraulic management of coastal freshwater marsh to conciliate local water needs and fish passage
L. Guiota and L. Cassana and D. Dorchiesb and P. Sagnesc,d and G. Belaude aInstitut de M´ecanique des Fluides de Toulouse (IMFT), Universite´ de Toulouse, CNRS,
Toulouse, France; bUMR G-eau, Univ. Montpellier, AgroParisTech, Cirad, Institut Agro,
INRAE, IRD, 365 rue Jean-Fran¸cois Breton, 34196 Montpellier, France; cOffice fran¸cais de la
biodiversit´e (OFB), Direction de la recherche et de l´appui scientifique, Toulouse, France;
dEcohydraulics team, OFB-IMFT-PPRIME, France; eUMR G-eau, Univ. Montpellier,
AgroParisTech, Cirad, Institut Agro, INRAE, IRD, 2 place Pierre Viala, 34060 Montpellier Cedex 1, France
ARTICLE HISTORY Compiled July 10, 2020 ABSTRACT
Water control structures, used to regulate water levels and flow exchange in coastal marshes, act as barriers during fish migration between the ocean and brackish or freshwater ecosystems. Usual fish pass solutions may be unsuitable for obstacles sub-ject to significant water level variations such as tidal range. This study proposes new solutions that were developed, implemented and evaluated on a marsh controlled by a series of hydraulic structures. These solutions were based on soft physical mod-ifications (passive management) of the control gates, and on adaptations of their operation rules (active management). To evaluate the impacts of these adaptations, a hydraulic model of the marsh was built. It solves the one-dimensional Saint-Venant equations and appropriate gate equations. The model was used to identify manage-ment rules of control structures in a way to improve fish migration without signifi-cantly affecting the initial hydraulic management of the marsh (i.e. targeted seasonal water levels). It was also showed that fish passability of upstream structures could be improved by managing downstream ones. It was concluded that the combination of active and passive management of water control structures could largely increase the passability of these obstacles during glass eel migration, while limiting seawater intrusion in the marsh and maintaining water levels into a range compatible with marsh management needs.
KEYWORDS
Ecological continuity; Sluice gate; Tide gate; Open-channel control; Water management
1. Introduction
In many coastal areas, open marshes have been controlled for centuries in order to in-crease land-use for agriculture, pasture, and to contribute to flood prevention. This has led to the channelization of the marshes and a flow control based on hydraulic struc-tures, such as sluice gates and weirs in order to maintain water levels around targeted values, to regulate seawater inflows, and to control wetland drainage. In addition,
cific hydraulic structures have been designed to operate automatically (thanks to the hydrostatic pressure) in response to the tide, to prevent salt intrusion and tidal flood issues (Giannico and Souder 2005). However, these coastal hydraulic structures cre-ate physical barriers and, sometimes, subsequent flow conditions which constrain fish passage: sluice gates impose large flow velocities by contracting the flow, tide gates are physical barriers at high tide (Doehring et al. 2011; Wright et al. 2014), while weirs create water falls (Amaral et al. 2016). Therefore, all these structures may have an effect on fish migration either by stopping individuals and preventing them from reaching suitable habitats to spawn or to grow, or by adding a delay in their migra-tion time (Ovidio and Philippart 2002). This delay may result in fish arriving in these habitats under unfavourable environmental conditions. These ecological consequences participate in the decline of some fish populations or species, such as the European eel (Anguilla anguilla) (Feunteun 2002; Bult and Dekker 2007)
Since 1980, this species has lost around 90 % of its population (Feunteun 2002), making it a severely endangered specie according to IUCN. During the past decades, various technical solutions have been developed to restore fish passage, such as fish ladders (Larinier 2002; Katopodis and Williams 2012), fish lifts (Travade and Lar-inier 2002) or rock ramps (Katopodis et al. 2001). Some authors also proposed soft modifications (i.e. that do not require an important upgrading of the structures), like placing blocks in a culvert (Franklin and Bartels 2012; Newbold et al. 2014), installing a bristle or studded ramp on a weir (Kerr et al. 2015; Vowles et al. 2017), or making permanent openings in an existing structure (Boys et al. 2012). Moreover, considering that gates can be actuated based on different rules, management of movable control structures could integrate criteria to improve fish passage (Mouton et al. 2011, 2012).
In a regulated open channel network, there are usually several hydraulic structures, implying a cumulative effect on fish migration processes (Lucas et al. 2009) and a fragmentation of habitats in the concerned water bodies. Therefore, restoring fish connectivity supposes to act on all (or nearly all) the structures acting as barriers in order to achieve a significant increase in connectivity at the network level. The issue of prioritization of barrier removal was studied in river contexts (Mouton et al. 2007; O’Hanley 2011; Shaw et al. 2016), e.g. by mixing economic and ecological criteria, but, to our knowledge, no comparable methodology is available in the context of coastal networks characterized by strong seawater influence on both water level and salinity, which should be considered when designing solutions to improve fish passage (Franklin and Hodges 2015; Roman and Garvin 1995).
In addition, fish passage solutions adapted to river environments may not be ade-quate for coastal networks, due to highly fluctuating flow conditions due to tide and/or variations of river flow. For example at low tide, a high water level difference between the upstream and the downstream parts of an obstacle may induce harsh flow con-ditions in the basins of a pool-type fishpass. At high tide, for the same fishpass, the downstream basin(s) would be submerged, making its entrance unattractive for fish. In a regulatory context that imposes effective solutions for restoring ecological con-tinuity in some freshwater bodies, which is currently the case in France, managers have therefore to propose innovative solutions that could be adapted to the particular context of marshes.
In this context, the originality of this study is to consider a series of hydraulic structures, and their cumulative effects on fish passage continuity, in a coastal open-channel network. The goal is to explore and design low-cost solutions to improve this continuity through management operations, while keeping the original purpose of the infrastructure.
More specifically, we intend to show that (i) soft modifications of one control struc-ture (e.g. small alterations such as adding blocks to a tide gate) could improve fish passage both locally and at a larger spatial scale in the marsh, (ii) management strate-gies could be designed to improve fish passage continuity based on soft modifications of structures and the adaptation of existing rules for gate opening, (iii) these strategies can be explored and optimized using a specific hydrodynamic model that solves the Saint-Venant equations, including models of the structures.
For this purpose, we selected a marsh on the French Altantic Coast comprising a channelised river and some tributaries, where water levels are controlled by hydraulic structures (sluice gates, flap gates) originally installed for agricultural uses (irrigation and drainage). A numerical model was developed and calibrated in order to simulate different management scenarios, and to identify new options to increase fish passage while taking into account hydraulic interactions between structures.
This article is structured as follows. The first section describes the study area, the targeted fish species and the measurements used to calibrate the model. The second section presents the modeling approach and the criteria used to compare diverse management strategies. The results section analyzes different options for the design and operation of control structures. Finally, the discussion section presents the effects of the interaction between structures in a tidal environment, and pathways to improve fish passage continuity by adapting these structures.
2. Ecological and management context 2.1. Study area and targeted species
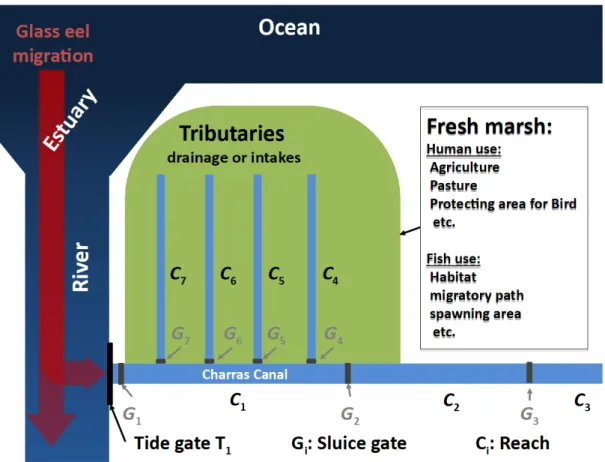
The freshwater marsh of Charras, on the French Atlantic Ocean coast, serves as case study in which we consider the passage continuity during European eel (Anguilla anguilla) migration. Charras marsh (Figure 1) is connected to the Charente river estuary (45◦53’30.2”N, 1◦00’11.8”), 5 kilometers from the Atlantic Ocean, and drains a watershed of around 300 km2. The marsh is largely influenced by tidal movements, with a maximal water level amplitude of 5 m. Therefore tide gates have been placed at the confluence between the Charente river and the Charras Canal, the main drain of the marsh. This drain, a former tributary river of Charente River, was channelized between the Middle-Ages and the early nineteenth century.
This marsh (as many others on the French Atlantic coast) represents a suitable habitat for the European eel during its growth period. This species is a catadromous fish that migrates into freshwater to grow and mature after being spawned at sea. The access to suitable fresh water growth habitats is a key factor for the species survival. During the period of their recruitment in French estuaries (mainly between February and April), eels are at a life-stage called glass eel. At this stage, individuals are unpigmented and less than 10 cm in length. It is a transitional stage between the leptocephal larval stage and the pigmented juvenile elver stage. According to McCleave (1980), elvers have a burst swimming capacity of 0.6 m/s. Consequently, flow velocities nearly equal to or higher than 0.6 m/s, often encountered at the level of water control structures (e.g. under sluice gates), may theoretically be impossible to cross by glass eels and elvers. Therefore, all the structures located in the marsh can be suspected to create barriers during young eel migration from the ocean to the marsh habitats.
Currently the most usual solution for glass eel passage at physical obstacles consists of climbing ramps (Porcher 2002). Their efficiency mainly depends on the type of
substrate used (Watz et al. 2019), the water temperature (Linton et al. 2007), the hydraulic conditions on the ramp, and the attraction flow rate (Piper et al. 2012). Unfortunately, such devices concentrate glass eels in small areas and out of the water, which facilitates illegal fishing. Moreover, it seems that, when the air temperature is low, glass eels do not use these ramps (pers. obs.). All these reasons make climbing ramps not well adapted for environments such as Charras fresh marsh, so other types of solutions are necessary to be studied.
2.2. Hydraulic context and infrastructures
Figure 1. Charras network schematic map and examples of marsh water uses. G4, G5,G6, and G7 gates are coupled to flap gate to prevent salt water intrusion in tributaries.
The Charras canal is approximately 20 kilometers long. To avoid sea water intrusion in the marsh, a side hinged tide gate (T1) has been installed at the mouth of Charras
marsh (Fig. 1). Water levels are controlled by sluice gates: Charras gate (G1) at the
mouth of the channel, Suze gate (G2) 7 kilometers upstream, and Portefache gate (G3)
15 kilometers upstream from the mouth. Four tributaries are connected to Charras canal. The connections are controlled by sluice gates coupled to flap gates (G4, G5,
G6, and G7).
The canal and its tributaries have trapezoidal cross sections; their characteristics are given in Table 1, while those of the gates are given in Table 2. When Charras tide gate (T1) is open, it does not control the flow. However, when glass eels arrive (i.e. on
rising tide), the tide gate T1 is supposed to close. Therefore, to improve fish passage, since 2010, a minimum opening of 20 cm has been imposed through the presence of
three wooden blocks in order to prevent complete gate closure during high tide. The efficiency of such a soft adaptation has already been documented for estuaries (Boys and Williams 2012; Mouton et al. 2011), with a clear improvement regarding fish migration processes and subsequent local fish assemblages.
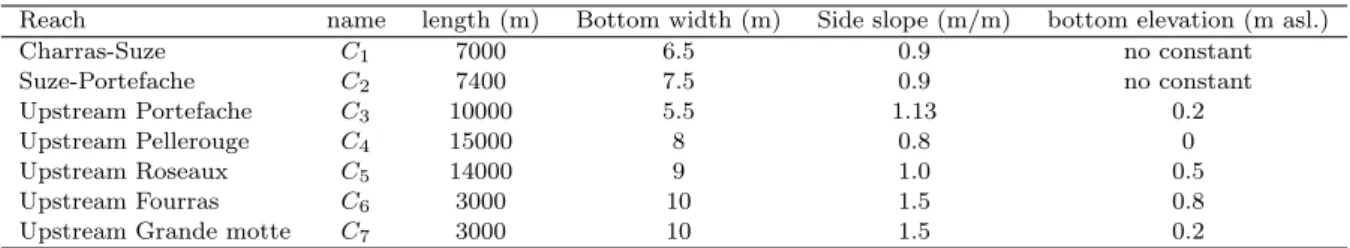
Reach name length (m) Bottom width (m) Side slope (m/m) bottom elevation (m asl.)
Charras-Suze C1 7000 6.5 0.9 no constant Suze-Portefache C2 7400 7.5 0.9 no constant Upstream Portefache C3 10000 5.5 1.13 0.2 Upstream Pellerouge C4 15000 8 0.8 0 Upstream Roseaux C5 14000 9 1.0 0.5 Upstream Fourras C6 3000 10 1.5 0.8
Upstream Grande motte C7 3000 10 1.5 0.2
Table 1. Characteristics of the main canal and tributaries of the marsh. For C1and C2 reaches bathymetry measurements, see figure 7. All elevations are above sea level (asl) and are related to the French geodetic system (NGF-IGN1969).
Structure Name Gate width (m) Sill elevation (m) Gate height (m)
Charras sluice gate (*2) G1 2.2 -0.5 4.5
Suze sluice gate G2 6.5 -0.5 4
Portefache sluice gate G3 5.5 0.18 6
Pelle rouge sluice gate G4 1.5 0.59 3.403
Roseaux sluice gate G5 1.5 0.95 3.042
Fouras sluice gate G6 1.2 0.78 1.18
Grande motte sluice gate G7 1.2 0.83 4.5
Table 2. Characteristics of sluice gates. The gate heights are given because of possible overflow.
Like tide gate T1, flap gates coupled to G4, G5, G6, and G7 sluice gates have been
equipped for a few years with blocks to improve glass eel passage. These blocks impose a minimum opening of 20 cm at each flap gate. Thanks to the blocks at T1, gate G1
(located 10 m upstream) is passable by eel during high tide, when water flows in the upstream direction. Glass eel passage has been verified through fishing operations and comparisons of individual densities downstream tide gate T1, and upstream sluice gate
G1 (Rigaud et al. 2014). However, the next structure encountered by eels, gate G2,
may be a barrier to migration as, at water flows downstream, i.e. with a direction opposite the migrating eels. In order to be, at least, passable by a significant number of glass eels, flow velocity at gate G2 has to be below their 0.6 m/s swimming limit.
Sluice gates usually induce a head-loss from a few centimeters to a few tenths of centimeters. Applying Bernoulli’s theorem, one can calculate the velocity in the jet under the gate, following:
Vw=
p
2g ∆H (1)
with g acceleration due to gravity, ∆H head difference (which is almost equal to water level difference) between upstream and downstream sides of the gate. Following equation (1), making the gates passable by glass eels (i.e. a flow velocity < 0.6 m/s) requires ∆H value lower than 2 cm, which is a real challenge for marsh managers.
2.3. Water Management Objectives
Hydraulic structures have two purposes in the studied area. The first objective is to drain high rainfall in order to avoid flooding during winter, and the second one
is to keep water level around target values for agricultural needs during summer. These two different objectives, at different times of the year, imply the following water management plan:
• During the period of high rainfall events (usually between December and Febru-ary), hydraulic structures are used to facilitate drainage. Sluice gates are fully open.
• During wet periods (usually between March and May), hydraulic structure are managed to drain periodic rainfall events. The goal is to drain the water volume in excess while keeping enough water volume storage for the drier periods, ex-pected in spring and summer. In this case, water levels are kept around target values (Table 3). At sluice gates, the water level control is performed by under gate flows, whereas water is flowing over the top of the weirs.
• During dry periods (usually between May and September), there are few rain events, and the marsh is used for water storage. In this case, sluice gates are closed in order to maintain high water levels (Table 3).
• During autumn, first rainfalls occur, usually between October and December. Sluice gates are maintained closed until the marsh is fully filled.
During all these periods, tide gates are not operated manually, they automatically move with the tide to limit seawater intrusion.
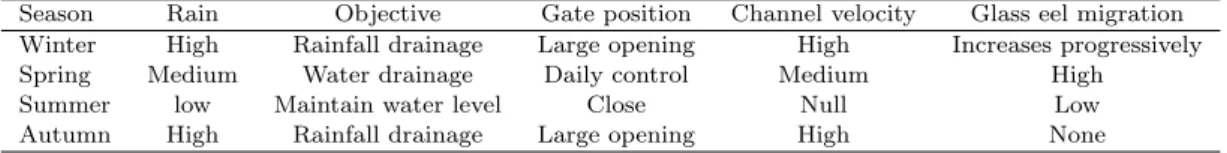
Table 4 summarizes this annual cycle of management operations and indicates the most favorable periods for glass eel migrations.
Reach Level target (m)
Summer Winter
C1 2.15 - 2.20 1.90 - 2.00 C2 2.25 - 2.30 2.15 C3 2.35 - 2.40 2.25 - 2.30
Table 3. Water level target at two seasons in principal reaches of Charras marsh.
Season Rain Objective Gate position Channel velocity Glass eel migration
Winter High Rainfall drainage Large opening High Increases progressively
Spring Medium Water drainage Daily control Medium High
Summer low Maintain water level Close Null Low
Autumn High Rainfall drainage Large opening High None
Table 4. Summary of the seasonal water managements operations and flows in Charras marsh.
2.4. Hydraulic data
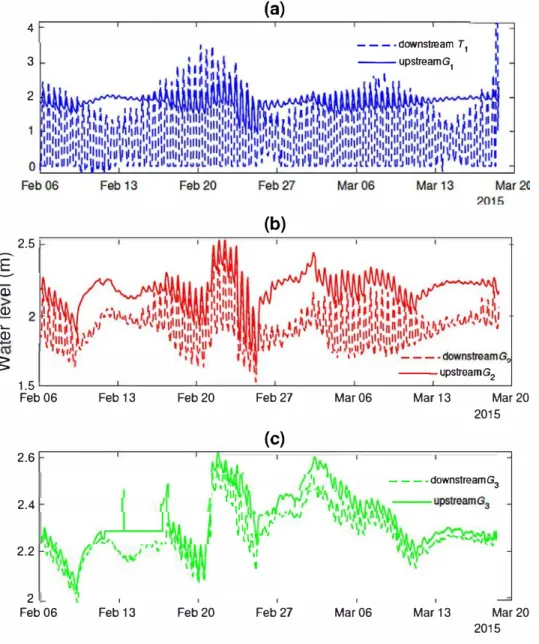
Water level measurements have been monitored continuously at different locations in the marsh, during the period of glass eel arrival from the ocean, between 06/02/2015 and 18/03/2015, using ultrasonic water level sensors, with a recording interval of 15 minutes (Figures 2 and 3). In complement several flow rates were measured upstream of G1 (18/02/2015) and at each hydraulic structure on 19/02/2015. They were
per-formed with an Acoustic Doppler Current Profiler (RDI StreamPro), allowing a quick measurement compatible with the frequent change in hydraulic conditions due to the tide. These measurements were used to calibrate sluice gates and tide gates discharge equations. Sluice gate openings were also available during the study period (Fig. 4).
..--.. E .._... Q) Q) '-Q) � 4 3 2 2.5 1.5 Feb 06 2.6 2.4 2.2 2 Feb 06 Feb 13 Feb 13 (a)
(b)
Feb20 Feb27(c)
1 V '�111·,-
,,,
,.,
·�\ • ./1,�,,
1 Feb20 Feb27 - - - . downstream T1 --upstreamG1,,
. ,,
---upstreamG2Mar06 Mar 13 Mar20
2015
- - - -downstreamG3
Mar06 Mar 13 Mar20 2015
Figure 2. Water level records in different location of the Charras canal. (a) water level downstream T1 gate (i.e. corresponding to the down-stream constraint) and water level upstream G1. (b) water levels downstream and upstream G2. (c) water levels downstream and upstream G3.
- The openings of sluice gates G1 and G2 were modified daily. The opening modifi cation depended on the inflow variation (Fig 4).
- Except during the irrigation period, G3 was fully open. As a consequence G3 was not an obstacle during glass eel migration.
- Sluice gates openings on tributaries ( C4, Cs, C6, and C1) were rarely modified.
During the study, water levels in tributaries were controlled by water level variation in C1 reach, the gate openings being unchanged.
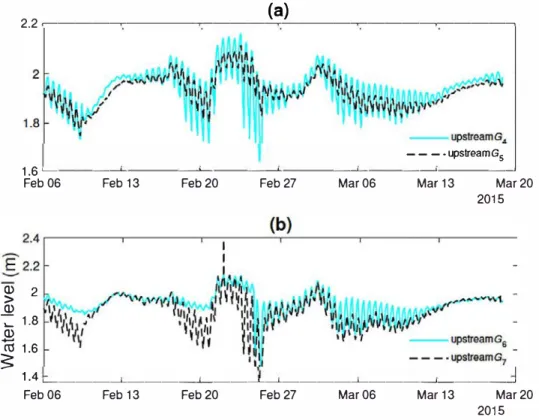
(a) 2.2 �---�----�---�----�---�----� - - - - upstreamG5 1.6 '-- ---'- -- ---'--- ---'-- - ---'-- ----'- - ---' Feb 06 Q) 2 > Q) -:::: 1.8 Q) ctÎ 1.6 �
Feb 13 Feb20 Feb27 Mar06 Mar 13 Mar 20 2015
1.4 '---'---'---'----'---'---'---'
Feb 06 Feb 13 Feb20 Feb27 Mar06 Mar 13 Mar 20 2015
Figure 3. water level records, in different locations of Charras marsh tributaries. (a) water levels upstream G4 and Gs.(b} water levels upstream Gs and G7.
gate).
- G7 was always open and did not disturbed the flow. However a flap gate controlled water entrance in C1 at high tide.
These observations show that, during glass eel migration period, daily water man agement was performed along the marsh with the modification of G1 and G2 openings, which led us to focus on these two gates for possible adaptation of management rules in the perspective of eel passage improvement.
As said above, it is possible to place blocks on the gate T1 to permit the passage of glass eels. However, this operation affects the water levels, and therefore the entire hydraulic conditions in the networks due to backwater effects. The adaptation of G2 operation (to improve fish passage) should consider this interaction. To maintain sus tainable agricultural uses in the area, it is also required to maintain the water level in C1 near the target value (see Table 3).
3. Modelling strategy
This section describes the hydraulic model developed for the study, its calibration against observations, the management strategies which will be compared and the se lected indicators for this comparison.
In this approach, it is important to consider the backwater effects and the time varying flow conditions due to tides, which cause periodic flow inversions at vari ous locations in the marsh. In this context, a hydraulic model based on the
one-(a} 3�---�
-
--WG 1 ----WG2 ... wG3 --WG4 -·-·-··WG5 ---0 L_____'.::=:::::'.:i::__ __ _,__ _ __ ...1.._ _ __ 1..._ _ _____L:::::==::__JFeb06 Feb 13 Feb20 Feb27 Mar06 Mar 13 Mar 20
2015
(b}
a�---�
-C") 6 0Feb06 Feb 13 Feb20 Feb27 Mar06
-mean daily IICIN
Mar 13 Mar 20
2015
Figure 4. (a) gate openings in Charras marsh during the measurement period. Gate G5 and G1 are net presented because: G5 was closed, and gate G1 was fully opened during the measurement period. (b} mean daily flow at G2 gate, calculated from water level measurement and the sluice discharge equation (see text section 3).
dimensional Saint-Venant's equations was used. The software SIC ("Simulation of Irrigation Canals") was selected for its ability to simulate regulated networks, with possible flow inversion, and to implement specific discharge equations in regulation modules (Baume et al. 2005).
The hydraulic model is expected to provide key variables for fish passage assessment, notably the potential constraining flow velocities at structures. Due to tides, the model has to address regular transitions between free flow and submerged flow at sluice gates, and high submergence and flow inversions at sluice gates. There are few gate equations able to deal with such challenging conditions to be included in numerical models. Specific equations based on energy-momentum balance (Belaud et al. 2009) were implemented and coupled with the 1D flow equations.
3.1. Description of the hydraulic model 3.1.1. Saint- Venant equations
The one-dimensional Saint-Venant's equations can be written as follows:
∂Q ∂t + ∂Q2/A ∂x + gA ∂h ∂x+ gA(Sf− Sb) = 0 (3)
where t is the time, x is the abscissa, Q is the flow rate, A is the wetted Area, h is the water level, g is the gravitational acceleration, Sf is the friction slope, and Sb
is the bed slope. Equation 2 and 3 are solved thanks to Preissman numerical scheme, which is unconditionally stable. A time step of 1 minute was selected for the sake of accuracy. The friction slope was calculated with Manning equation, in which Manning coefficient (n) was adjusted by calibration on observed water levels.
3.1.2. Hydraulic structures discharge equations
Sluice gate discharge equation – Water levels are strongly affected by sluice gates. These structures also create flow accelerations that constitute barriers during fish migration. For this purpose, it is therefore necessary to consider the velocity VGj in
the jet under the gates Gj:
VGj =
Q CcW L
(4) in which Ccis the contraction coefficient (between 0.6 and 1 - see Belaud et al. (2012)),
W is the gate opening and L is the gate width.
Standard gate equations with fixed discharge coefficient or contraction do not ensure continuity of flow calculation in all possible configurations of water levels and gate openings. The discharge at these structures were calculated thanks to the following discharge equation: Q = √CcW 1 + kL p 2g s hu− h1 1 −Cc2W2 h2 u (5)
where k is the correction coefficient due to headloss and other real fluid effects, allowing calibration of the equation on discharge measurements, huis the upstream water level,
hdis the downstream water level. The momentum equation was used to determine the
flow regime. In case of free flow, h1 = CcW , otherwise h1 = hd.
To ensure continuity of the equation with increasing opening, Cc varies with the
relative gate opening a = hw
u and the relative submergence s = h1
hu, starting from
Cc ' 0.6 for small opening to unity in case of a large submergence and a large opening. Iterations (with a fixed point method) are needed to obtain the discharge as function of hu, hd and W (Belaud et al. 2012). Equation (4) gives the velocity under the gate.
These equations were used for G1, G2, G3, G4, and G5, when flowed under the sluice
gates.
Flow over closed gates – When sluice gates were closed, they acted as a weirs. During the measurement period, this situation occurred for G6. Considering that hug
is the upstream head and hdg is the downstream head over the gate, the discharge is given by:
• For the free flow (hdg < 23hug):
Q = µfL
p
2gh3/2ug (6)
with a discharge coefficient, µ ' 0.385. For the submerged flow (hdg> 23hug):
Q = µsL
p
2g(hug− hdg)1/2hdg (7)
with a discharge coefficient, µs= 3 √
3 2 µf.
Tide gate discharge equation – If the water level downstream of the tide gate was lower than the upstream water level, the tide gate was fully open and therefore had no influence on the flow. In the opposite case, the tide gate was closed, but the blocks maintains a small opening; to calculate the discharge at the gate, we used a vertical fish slot discharge equation (Wu et al. 1999):
Q = µgbhd
p
2g(hd− hu) (8)
where b is the opening width due to the block, hd is the water level downstream of
the tide gate, hu is the water level upstream of the tide gate, and µg is a discharge
coefficient around 0.8, which can be calibrated with field measurements.
Flap gate discharge equation – The principle is the same as for tide gates. If hd > hu, the flap gate was closed, and the gate blocks allowed a small opening,
we used the following sluice gate discharge equation to calculate the discharge at the gate, we use a sluice gate discharge equation:
Q = CdbL
p
2g(hd− hu) (9)
where b is the opening due to the blocks (b=0 if there are no blocks), L is the width of the flap gate (equal to the width of the sluice gate positioned few meter upstream of the flap gate), and Cdis a discharge coefficient set to 0.8 following results obtained
on similar undershot flap gates in submerged flow (Belaud and Litrico 2008). It can be noticed that free flow never occurs for flap gates.
3.1.3. Model calibration
The hydraulic model contains coefficients which are quite sensitive on model results, considering their possible range of variation: the Manning coefficient for the energy loss in canal reaches, and the head loss coefficients at structures (k for sluice gates, and discharge coefficients µg, µf , and Cd). The discharge coefficients were first calibrated
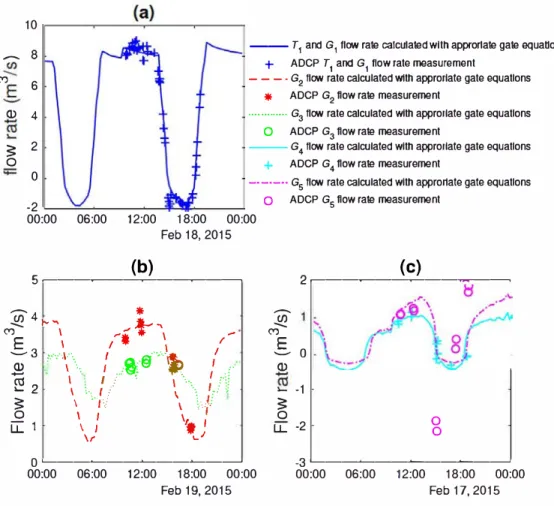
thanks to ADCP flow rate measurements and water level records. The flow rates have been calculated at each hydraulic structure with water level records upstream and downstream of the hydraulic structures. Table 5 reports the calibrated coefficients for each sluice gate. The channel Manning coefficients were calibrated from water level measurements in fields. Fig. 5 illustrates the quality of discharge predictions for G1,
10
-
8 --T1 and G1 flow rate calculated wtth approrlate gate equauons+ ADCP T1 and G1 flow rate measurement C") Q)
;::
0 6 4 2 0 -2- - - • G2 flc,,v rate calculated w1th apprortate gate equatlons
*
ADCP G2 flow rate measurement••••••••••••• G3 fJc,,v rate calculated w1th apprortate gate equatlons
O ADCP G3 flow rate measurement
--G4 fJc,,v rate calculated w1th apprortate gate equatlons
+
ADCP G4 flow rate measurement-• -• -• • G5 fJc,,v rate calculated w1th apprortate gate equatlons O ADCP G5 flow rate measurement
00:00 06:00 12:00 18:00 00:00 Feb 18, 2015 (b) 5�---� C") � 4 � '\ ..,
i-...
E 1 ... , 1 ,,,,.. .._., 3 _$ ,..-.,·.�:·.. . \ \ / ,' ..,
&.
·
,.
·t(
·
"-�
�
/
I,.
\ I . I ,!::i
2 \ ; ... :/ . \ · ..\
J
r'
if�
1 \,,.
:
\�)
-0'----�--�--�----' 00:00 06:00 12:00 18:00 00:00 Feb 19, 2015 (c) 2�---�-� C") �-So
Q) "- -1;::
0 LL -2 0 0 -3 '----�--�--�----' 00:00 06:00 12:00 18:00 00:00 Feb 17, 2015Figure 5. Calibration results for sluice gate G1 and tide gate T1 (a). Calibration results for sluice gates G2 and Gs (b), G4 and Gs (c).
To validate the model, a simulation has been performed with the following boundary conditions:
- Water level measured and corrected downstream of T1 tide gate.
- Daily flow calculated from water level measurements upstream G3, G4, Gs, G6
and G1 sluice gates. These daily flows were calculated using water discharge equations and water level measurement.
The root mean square error (Eq. 10) was used to evaluate the performance of the model:
RM SE= VL,(hmes -hsim)
2
n (10)
where hmes is the water level from field measurements, and hsim is the simulated
water level.
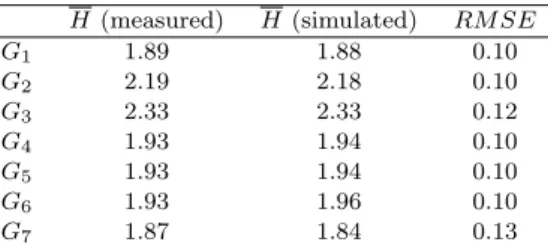
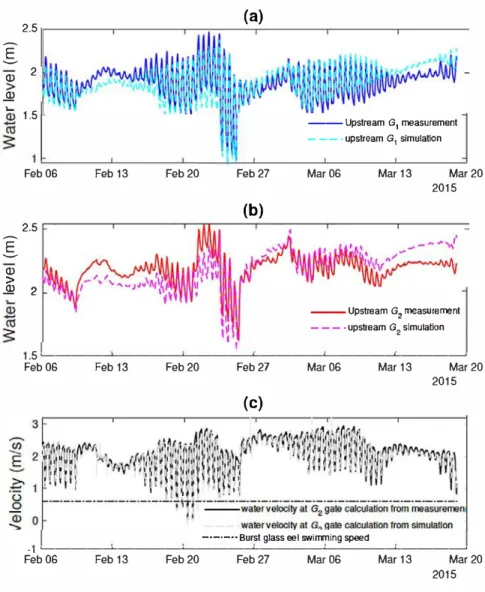
Results are summarized in Table 6. T here was a good agreement during the 40-day period of observation between the model outputs and the water level observations upstream of gates G1 and G2 (Fig. 6). There was also a good agreement between
Gates and reaches Type calibrated coefficient C1 main reach n= 0.015 C2 main reach n=0.02 C3 main reach n=0.025 C4 tributary n=0.05 C5 tributary n=0.033 C6 tributary n=0.022 C7 tributary n=0.022 T1 tide gate µg=0.8 G1 sluice gate k=0 G2 sluice gate k=0.35 G3 sluice gate k=1 G4 sluice gate k=0.2 G5 sluice gate k=0.2
G6 weir (sluice gate closed) µf=0.4
G7 sluice gate n.a. (sluice gate fully open)
Table 5. Calibrated coefficients for head losses at different locations of the Charras marsh (Manning n and others from discharge equations of the respective gates, see text). For flap gates at structures G4, G5, G6 and G7, the discharge coefficient was set to 0.8.
water velocities under G2 calculated with Eq. 1 and measured and simulated water
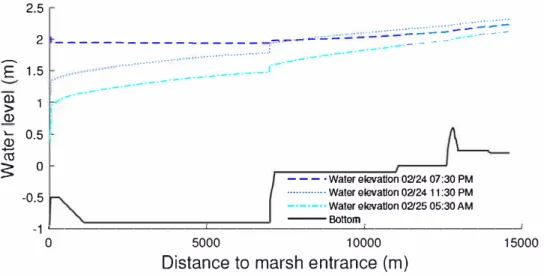
levels (Fig. 6). These velocities will be used afterwards as an indicator for fish passage opportunities under the gate. Figure 7 shows the water level simulated along reaches C1 and C2 at three different times. At low tide, there was a significant friction slope
in both reaches (Fig. 7). Flow variability was high throughout the system, especially between low tide and high tide conditions, and the mean flow was obviously not sufficient to describe the hydraulic conditions. These results illustrates the importance of using the unsteady Saint-Venant equations to describe water flows in the marsh.
H (measured) H (simulated) RM SE G1 1.89 1.88 0.10 G2 2.19 2.18 0.10 G3 2.33 2.33 0.12 G4 1.93 1.94 0.10 G5 1.93 1.94 0.10 G6 1.93 1.96 0.10 G7 1.87 1.84 0.13
Table 6. Calibration evaluation of the hydraulic model: mean water level (H) upstream of different gates and RM SE.
3.2. Alternative management scenarios to improve eel passage
To improve glass eel passage at hydraulic structures, alternative management scenarios can be explored in order to (i) show the impact of management modifications at one gate on the overall open channel network hydraulic conditions; and (ii) provide recommendations about the operation or the design of these gates. Two kinds of strategies were explored:
• A passive management strategy. It consists on a modification of tide gate blocks size, without modification of sluice gate openings. At high tide, the water level in C1 reach should raise, and the water level difference between the upstream and
downstream sides of G2 gate should decrease. This management scenario does
not need any modification in manager work, neither a coordination between different gate managers, but the blocks cannot be removed or changed easily, which implies that this management scenario cannot be adaptative to daily inflow
:[
Q) ..92 ,_:[
Q) > ..92 2.5(a)
2 1.5 --Upstream G1 measurement - - - • upstream G 1 simulationFeb0S Feb 13 Feb20 Feb27 Maros Mar 13 Mar 20 2015 (b) 2.5 2 --Upstream G2 measurement - - - • upstream G2 simulation 1.5 �---�----�---�----�---�---�
Feb0S Feb 13 Feb20 Feb27 Maros Mar 13 Mar 20
2015 (c)
-·-·-··Burst glass eel swimming speed
-1 �---�----�---�----�---�---�
Feb0S Feb 13 Feb20 Feb27 Maros Mar 13 Mar 20
2015
Figure 6. Mode! outputs over the measurement period. (a) comparison between measured and simulated water level upstream of G1. (b) comparison between measured and simulated water level upstream of G2. (c) comparison between water velocities at gate G2, calculated from measured and simulated water levels; the burst swimming speed of glass eel is given as a reference value of flow velocity above which eel passage should be highly compromised.
and tide variations. The increase of seawater inflow ( compared to a scenario upon which T1 or G1 are closed) has therefore to be estimated and compared with the amount of (salt)water that can be accepted upstream.
• An active management strategy. Sluice gates opening may be modified daily, the blocks being maintained as in year 2015. The objective is here to temporally reduce the velocity under G2 in order to increase the duration of gate passability for eels. This can be achieved by reducing the water level difference downstream and upstream the gate, e.g. by opening it for a while. This time should not be too long to avoid an excessive decrease of the water level in pool C2. This kind of management is more adaptative to inflow and tide variations but sluice gate
2.5
...
�
·
�-::�:::=
2 -·--·-·-· ... �::.:.:.-·-·-
E 1.5- - - -
...
.
. . ............... ....:
,--,-
.---
-
.---·-·
···-·--·-·-·-·---·-·'
---·-·
Q) > Q) 1 . . -·---·-·---·-· Q) 0.5 :«i
� 0 -0.5 - - - • Water elevaUon 02/24 07:30 PM •••••••••••• • Water elevaUon 02/24 11 :30 PM -·-·-··Water elevaUon 02/25 05:30 AM --Bottom -1 �---�---�---� 0 5000 10000 15000Distance to marsh entrance (m)
Figure 7. Water elevation along reaches C1 and C2. The solid line represents the canal bottom. Dotted lines show water elevations at 3 different hours on 24/02/2015 and 25/02/2015.
openings have to be adjusted daily.
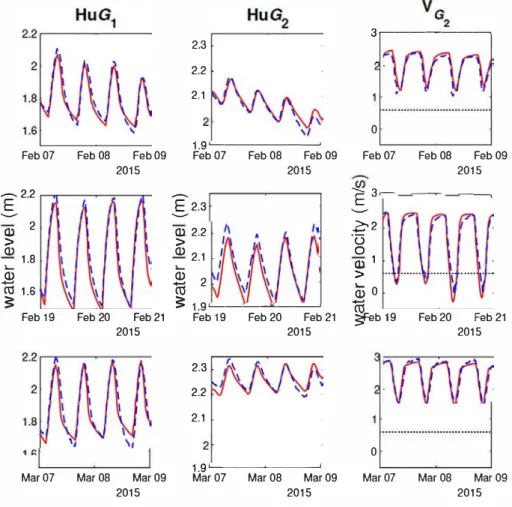
To test the feasibility and the efficiency of the different options, 3 periods were selected with different tide ranges and flow rate inflows. Each period was selected in a way that, during 2 days, the flow conditions were quite stable (i.e. did not vary from more than 10%), and the seven sluice gates Gi had a constant opening (i.e. none has been managed during the 2 days). The corresponding conditions are reported in Table 7. Figure 8 illustrates the capacity of the model to simulate the observed conditions (water levels and calculated velocities) during the 3 selected periods.
Day name Inflow (m3/s) Tide range (m) G1 opening (m) G2 opening (m)
07/02/2015 P1 2.70 2.20 0.40 0.35
19/02/2015 P2 2.64 3.10 0.55 0.40
07/03/2015 P3 3.40 2.45 0.45 0.35
Table 7. Periods selected and corresponding parameters for the comparison of alternative management strate-gies
The comparison between simulated and measured water levels and flow velocities (Fig. 8) showed that the model is accurate. Comparing the flow velocities under G2 and the burst swimming speed of glass eel (Fig. 8), it seems G2 can be crossed by glass
eel during the four tides of period P2, but is not passable during the 2 other periods.
Due to its higher tide range, it seems logically that salt intrusion is also higher during this period.
Several simulations were performed on P1, P2, and P3 periods (Table 7) in order to
evaluate the impact of management strategies:
• For the passive management strategy, simulations were performed with different black sizes, ranging from O to 60 cm, on the 3 periods. The used sluice gate openings were those observed in the fields during the periods. The objectives of these simulations were (i) to test the impact of blacks size on bath fish passage and hydraulic management needs and (ii) to analyze the influence of the black size on the hydraulic conditions.
Feb 07 Feb 08 Feb 09 Ê2.2 .._... Q) 2 > Q) 1.8 "-Q)
ro
1.s ;:: 2015 2.3 2.2 2.1 1.9�---�Feb 07 Feb 08 Feb 09
Ê2.3 .._... Q) 2.2 > Q) 2.1 "-Q)
ro
2 2015:i:
1.9�-��--�Feb 19 Feb 20 Feb 21 Feb 19 Feb 20 Feb 21
2015
Mar 07 Mar 08 Mar 09 2015 2.3 2.2 2.1 2015 1.9�---� Mar 07 Mar 08 Mar 09
2015
3---�
0
Feb07 Feb 08 Feb 09
2015
E3---�
.._... �2·u
0 Q) 1 >ci5
0ro
;::feb 19 0 Feb20 Feb 21 2015Mar 07 Mar 08 Mar 09
2015
Figure 8. Simulation of water levels and flow velocities at G1 and G2, during the 3 Pi periods with constant inflow and stable management. Blue dashed lines corresponds to measurements, red lines to simulations. 1st, 2nd and 3rd rows are for periods P1, P2 and Ps, respectively. 1st column is for water level upstream of gate G1, 2nd column for water level upstream of G2 and 3rd column is water velocity at gate G2. Black dotted lines, in the third column, indicates glass eel burst swimming velocity (0.6 m/s).
openings varying from 28 to 52 cm, and G2 gate openings varying from 35 to 7 4 cm, by steps of 2 cm (which corresponds to the current ranges and resolution of gate movements). These simulations were performed on period P1 only, which corresponded to an average flow rate in the system ( 4) and an average tide range (see Fig. 2 and 3). These simulations were performed with blacks of 20 cm at tide gate T1 (which corresponds to the current real blacks size). The hydrologie conditions were constant over the period, which led to select a constant gate opening throughout the period, as done in practice in the fields (Fig. 4). • In order to show how the active management principles can be applied, and how
they perform in terms of fish passage opportunities, salt intrusion and water level control, simulations have been done over the whole measurement period of 40 days, with the modified management rules between 18/02/2015 and 25/02/2015. This analysis can also serve to illustrate how the model can be used to evaluate
3.3. Indicators for the evaluation of management scenarii
Four indicators have been selected in order to compare the different management options.
The first one, Tpass is the duration when the water velocity at G2 gate is lower
than glass eel swim capacity (0.6 m/s), during one tide. This indicator is useful to quantify the effectiveness of the studied scenarios from an ecological point of view. It was arbitrarily decided that it should be greater than 1 hour per tide to allow a significant passage of eels.
Three other indicators were chosen for their usefulness from an agricultural and flood management points of view.
∆H1 is the mean water level deviation from recorded water levels upstream of gate
G1 (Hu,G1). We chose this average water level as a reference (rather than the ones
previously given in Table 3 which are average targets), because it is necessary to continuously adapt the water level due to the variations of tide and river flow. For management purposes, ∆H1 should be lower than 15 cm.
∆H2 is the mean water levels deviation from recorded water level upstream of gate
G2 (Hu,G2). For management purposes, ∆H2 should also be lower than 15 cm.
Rsea is the ratio of the sea water volume intrusion through T1 to the water volume
drained out of the marsh. For management purposes, Rseashould be lower than 0.2.
The reference values, for each periods Pi, have been calculated from measurement
and are provided in Table 8. These values were used to compare the results of tested management with the results of current management.
Period Tpass(H) Hu,G1 (m) Hu,G1 (m) Rsea
P1 0 1.79 2.06 0.03
P2 2.6 1.78 2.01 0.17
P3 0 1.87 2.26 0.05
Table 8. Reference values for the 3 studied periods P1, P2, P3. Hu,Gi is the average water level upstream of Gi
4. Results
4.1. Passive management
The passive management strategy was evaluated by calculating the indicators during each period using different block sizes (Fig. 9). With no block, there was obviously no seawater intrusion. Consequently, the water level difference between the upstream and downstream sides of G2 remained high and thus induced, below gate G2, a water
velocity that was always above glass eel burst swimming speed.
An increase of the block size implied more sea water intrusion and an increase of the mean water levels in all reaches. During period P2, a 10 cm block allowed flow velocities under gate G2 that were theoretically compatible with some eel passage (Fig. 9). With a 20 cm block, during period P2 the seawater intrusion allowed the passage of glass eels during about 2.6 hours per. However, during periods P1 and P3, whatever
the block size, passive management scenarii were not sufficient to permit fish passage. All the indicators linearly reacted to block size in the size range 0–25 cm, while blocks larger than 30 cm induced indicator values equivalent to a situation without tide gate. For larger blocks, Rsea seemed excessive for some of the tides during period P2 (Fig. 9). This should be an issue for the purposes of water management in the
Charras freshwater marsh. In addition, from an ecological point of view, the release of a large volume of salt water during the next tidal cycle could deter fish looking for fresh or brackish water, such as glass eels.
These results illustrate one of the limitations of passive management. Indeed, if the tide gate opening is tao high, due to a large black size, then the sea water inflow is no longer controlled by the black, but by the sluice gate only. Therefore, the optimal black size depends on the opening of G1 and on the hydrological conditions.
This argues to select a unique black size, and to increase the time favorable to fish passage by changing the gate openings according to the hydrological and tidal conditions. These principles of active management are analyzed below.
3 :::c 2.5 2 ·.;::: CO g> 1.5 .§ "O Q) E i= 0.5 0 0.05
]:
0 C: 0-�
-� -0.05 "O C: -0.1 -0.15•
•
0s
•
g
� li 9 0 Tpass•
.
•
•
-0.2 0.4 Block size (m) AHi ô•
e
Il•
Q•
:
:
Il•
:
0.2 0.4 Block size (m) 2 ..._ 1.5.s
� ·c3 0 0.5 ai > .... 0*
� -0.5 -1 0.6 0.25 0.2 ci', E 0.15 M'.s
<Il 0.1 Q) U) 0.05 0 0.6•
•
•
Min(V G ) on Periode P. 2 1• • • • • • • • •
• • • • • • • • •
•
•
...
•
•
•
• •
• • •
• •
0 0.2 0.4 0.6 Block size (m) Rsea• •
• •
• •
•
•
•
•
• • • • • • •
•
•
•
•
• • • • • • • •
•
• •
•
0 0.2 0.4 0.6 Block size (m)Figure 9. Effects of block size on four indicators (Tpa.ss duration when G2 is passable by glass eel during one tide, L:!.Hi mean water level deviation from water recorded level upstream G1, L:!.H2 mean water level deviation from water recorded level upstream G2, and Rsea the ratio of sea water intrusion), during the 3 studied periods (Blue P1 period, red P2 period, and green P3 period). On the clown left figure, open circles and cross symbols represent respectively the mean water level deviation from reference upstream G1 and upstream G2. Black dotted lines, on the top right figure, indicates glass eel burst swimming velocity (0.6 m/s).
4 .2. Active management
It was assumed here that 20 cm blacks were installed on the tide gate T1. Simulations were then performed for a combination of G1 and G2 gate openings.
Figure 10 plots the changes in the four indicators for simulated conditions during the studied period P1. Fish passability of gate G2 was facilitated by increasing G2 opening. A limit exists, below which the gate is unpassable. This opening limit depends on the other gate openings (Figure 10) and on hydrological conditions. Indeed, on period P2, gate G2 is passable with a fixed block of 20 cm, G1 opening of 55 cm and G2 opening of 40 cm (Figure 9). However, on period P1, gate G2 is unpassable with the same management (Figure 10).
An increase in G2 opening emptied reach C2 and filled C1, reducing seawater intru sion. The upper limit was defined by the decrease of HuG2, a too large deviation from target value being prejudicial to the agricultural uses in the marsh.
Increasing of G1 opening is also a way to enhance fish passage of gate G2. Such as for G2 opening, there is an opening limit in order to respect the water level needed for the marsh management.
]:
0.8 0.7 g> 0.6 "E � 0 0.5 T pass (h) �N ••••••••••••]:
0.4 ••••••••••••••••••••••••
0.3 '----'---0.8 0.7 0.3 0.4 0.5 G1 opening (m) �H2 (m) g> 0.6 ë::8-
0.5•
•••
•
•
•
•
•
•
•
•
0.4 •••••••••••••
••
•
•••
•
•
•
•
•
0.3 �---0.3 0.4 0.5 G1 opening (m) 2.5 2 1.5 0.5 0 0.1 0 -0.1 -0.2 0.8 0.7 Ê g> 0.6 "E � 0 0.5 �N •••••••••••• Ê 0.4 • • • • • • • • • • • ••
•••
•
•
••••
•
•
0.3 '----'---0.8 0.7 0.3 0.4 0.5 G1 opening (m) R (m3/m3) sea g> 0.6 ë::8-
0.5 �N•••
•••
•••
•••
0.4 • • • • • • • • • • • ••
•••
•••
•
•••
•
0.3 �---0.3 0.4 0.5 G1 opening (m) 0.2 0.1 0 -0.1 -0.2 0.035 0.03 0.025 0.02Figure 10. Effects of G1 and G2 opening modifications on period P1. The top left figure shows Tpass variations in hours. The top right figure shows mean water deviation [).Hi variation in meters. The down left figure shows mean water deviation t).H2 variation in meters. The down left figure shows Rsea ratio variations.
The best active management for fish passage continuity is, obviously, when gates are open at their maximum. This management rule made G2 passable during more than 2 hours per tide. But this strategy appeared unacceptable regarding hydraulic management indicators: the mean water level in reach C2 was 1.77 m, a value far
below the target level of 2.06 m (i.e. water level is 30 cm too low). From Figure 10, it was possible to find a management strategy that should improve fish passage continuity while respecting the constraints on the other indicators. Figure 11 shows the period suitable for fish passage using an active management scenario that respects the different constraints on indicators. Ten combinations appeared relevant, and the best active management for fish passage continuity was obtained with a G1 opening of 38 cm and a G2 opening of 74 cm. In these conditions, gate G2 was passable during more than 1.5 hour per tide, and the salt intrusion ratio was limited to Rsea = 2.5%.
T pass (h)
•
•
••
•••
••• •••
•• •••
2.5 0.7•
•
•••
•••
•• • ••
••
•
••
•
••
•
•• •••
2 Ê•
•
• •
••
••• •••
•
•• •••
Cl 0.6• •
•••
• •••
C:• ••
••
• •••
1.5,::
Q)• ••••• •••
• ••••• •••
8-
• ••••• •••
"' 0.5• ••••• •••
('.}• • •••• • ••
• •••••
0.5 0.4••••••••••••
0 0.3 0.35 0.4 0.45 0.5 G1 opening (m)Figure 11. Optimization of Tpass with an active management scenario during period P1. The operating conditions which do not respect the constraints on indicators have been fill in black.
Figure 12 illustrates the impact on water level and water velocity under gate G2 for three active management scenarii, including the observed (i.e. real, current) one. With a G1 opening of 52 cm and a G2 opening of 7 4 cm, the gate was passable at each high tide. There was no difference in Tpass between the four tides of period P1, but the water level in marsh decreased continuously during the 2 days, implying large fluctuations of water level upstream of G2 due to the tide.
With a G1 opening of 38 cm and a G2 opening of 74 cm, the water level in the marsh was higher, reaching the targeted levels for marsh management, and the gate was passable at each high tide. There was no difference in T pass between the four tides.
The tidal influence upstream of G1 decreased.
The search of an optimal active management scenario over the period P1 suggested the following improvements compared to the reference situation: gate opening of G1 should be slightly decreased, while gate opening of G2 should be significantly in creased. This philosophy was applied on the period between the 18/02/2015 and the 25/02/2015, which included successive tides with large amplitudes (Fig. 2). Figure 13 compares the water levels and the velocities under gate G2 between current man agement parameters and two management scenarii increasing eel passage ( the best management for glass eel tested with, and without, management constraint in flH1, flH2 and Rsea)- With the new proposed values of openings, the number of tides where the velocity at gate G2 was under 0.6 m/s was increased from 5 (total duration of 11.5 hours) to 14 (total duration of 50.25 hours). However, this caused some variations on the water levels, notably an increase of levels at gate G1. The mean water level upstream G1 was increased by about 20 cm in comparison with the mean water level upstream G1 simulated with recorded management (Fig. 13). This is more than the
- 2 E
-ai 1.8 > Q) 1.6ro
3: 1.4 1.2 '---�---'Feb07 Feb08 Feb 09
2015
0'---�---'
Feb07 Feb08 Feb 09
2015 � ,.,,\ -E 2. 1! ,, - \,,,i, , , ,., Q) > J!1 1.8
ro
3: 1.6 \"! \',.,,'!\', / ', / ' \/ \ ! '. ,., ,,. ',.' '. ! '. i '. \ ' \ . 1 ,\ \J \ \ ! ·' \ ;� \ . 1 \! - \ \ ! ! . \/ 1.4 '---�---'Feb 07 Feb08 Feb09
2015
--WG,=40Cm WG:i=3Scm
- - - • WG,=38Cm WG:i=74cm
-·-·---WG1=52cm WG:i=74cm
Figure 12. Simulation of water levels and water velocities for 3 different active management scenarii during period P1. Blue continuous line: current management (G1 opening = 40 cm, G2 opening = 35 cm). Red dashed line: best management scenario to improve fish passage (among those that have been tested), with respect of other constraints (G1 opening= 38 cm and G2 opening= 74 cm). Green clash-dot line: best scenario to improve fish passage (among those that have been tested), other constraints not considered (G1 opening= 52 cm, G2 opening= 74 cm).
15 cm, because this scenario was optimized for tides and flow condition (tide and flow which occurred during P1 period), whereas variable flow and tidal conditions occurred between 18/02/2015 and 25/02/2015. The level returned to the normal after 6 days, and there is almost no difference between scenarios after 02/03/2015 (Figure 13).
5. Discussion
5.1. From local to network scale: dealing with backwater and unsteady
fto w
The optimization of fish passage continuity through management measures is generally understood at the obstacle scale, by managing its opening or by building a structure making it passable. In the case of low-slope networks, the "backwater effect" implies an influence of the management of structures on the upstream part of the networks.
:[2 O> C "ë 1C r---"" Q) o. (a) --WG1 reco ded - - -. wa, modified --WG2 recorded -, - - - • WG2 modified �---t===�
oo�---�---�---��---�---�---�
Feb 18 Feb 21 Feb24 Feb 27 (b)
Mar02 Maros Maros 2015
� 2 '� 1 ',
�
�
fJJvlA
I
�
:: 1.5 , ' 1 --Upstream G1 with recorded man agement
$
� l�---�----�-�---�---_u_p- _w_eam_ �G_,_w_lth_m_oo_if��m_M_a_g_=_�_�
> Feb 18 Feb 21 Feb 24 Feb 27 Mar 02 Mar 05 Mar 08
2015 (c)
I
2.s---� ---Q) > �....
Q) > 1.5> Feb 18 Feb21 Feb24
Feb21 Feb24
- - - • upstream G2 with modified management
Feb 27 Mar02
(d)
Maros Maros 2015
wa ter velocity at G2 gate (modified management)
-·-·-·· Burst glass eel swimmng i speed
Feb 27 Mar02 Maros Maros
2015
Figure 13. Simulations of water levels and water velocities following management adaptations between 18/02/2015 and 26/02/2015. (a) comparison of G1 and G2 openings for recorded management and modified management. (b) and (c) comparison of simulated and measured water levels between reference and modified management rules. (d) comparison of velocities under gate G2 between reference and adapted management rules.
This makes it possible, through the management of a single structure, to promote fish upstream migration at the next upstream structures. However, this influence is com plex to understand, particularly in coastal environments subject to the tide influence. The implementation of a 1D model with unsteady flow, backwater effect and specific gate equations was essential to quantify and to optimize these longitudinal interac tions between structures subject to varying hydraulic conditions. Under coastal marsh conditions, changes of hydraulic regime at the structures are very frequent ( at each tide), presenting free to submerged flow transitions and flow inversions.
Specific structure equations, ensuring the continuity of the calculations during these hydraulic transitions, have been implemented in the software SIC, thus allowing flow
rates and height variations to be simulated accurately. The tool developed could then be used to explore management strategies based on the addition of blocks or modifi-cations to structure openings.
The method developed above makes it possible to explore the interactions between different constraints considering the hydraulic complexity of a tidal marsh environ-ment, with backwater effects and constantly varying boundary conditions.
In our case, there have been two major interests of using the hydrodynamic model: (1) We were able to find an optimum management strategy for each hydrological inflow condition, by following the method used for period P1. However, note that
it could be time-consuming, due to numerous possible combinations of boundary conditions and initial water levels in the marsh. This complexity also increases with the number of gates to consider.
(2) This model allowed to diagnose operating conditions, in order to adjust gate opening in near real-time. For instance, whereas a combination of gate openings was found satisfying for fish passage continuity, the model was useful to evaluate the impact of this management rule on water levels, and the time after which the water level would return to a target level.
5.2. Passive management: a soft solution to improve fish passage continuity
Passive management could, at a low cost, help to increase fish passage continuity in a the tidal marsh. Simulations have shown that adding blocks to the downstream tide gate (T1) may make an upstream sluice gate (G2) passable for fish during some tide
cycles (Figure 9). However, the choice of block size influences various indicators, such as salt water inflow, water levels, maximum velocities at structures and therefore the duration of favorable hydraulic conditions for fish migration.
Nevertheless, modifying one control structure appeared to be insufficient to allow fish passage during all tides, and the block efficiency depends on the tidal range and on other instantaneous hydrological conditions. For example, if the tidal amplitude is too low to obtain sufficient seawater entry into the marsh, then the presence of a block will have little impact on the flow level in the marsh and, subsequently, on the optimization of hydraulic conditions for eel passage. In addition, the overall efficiency of the blocks was shown to be highly dependent on the management conditions of the other hydraulic control structures.
5.3. Toward advanced control strategies
Passive management has the advantage of minimizing interventions, but it allows salt water to enter the marsh during periods when there is no clear ecological needs (at least in this study, e.g. no passage of target species). Thus, a strategy based on frequent gate operations makes it possible to go further in meeting the objectives of fish passage continuity, salinity and water levels control. In our case study, we were able to identify gate operation strategies that could largely increase the time duration suitable for fish passage. This type of solutions may be a good way to improve fish passage in marsh systems, where flow conditions are highly variables and depend both on tide ranges and on the outflow from freshwater network. In some conditions, the management of gate opening could therefore advantageously replace traditional solutions such as eel ramps, which could be easily poached and are not always efficient for glass eels in such
varying hydraulic conditions and/or when air temperature is low.
The modelling procedure allowed quantifying performance of operation scenarios a priori, and thus to define management procedures for different hydraulic structures, during the favorable periods for fish migration and under various hydrological condi-tions. In this case study, we limited the number of gate operations, corresponding to the usual management practice of this type of environment (daily maneuvres requiring human intervention). Increasing performance is possible with finer management, based on frequent actuations of gates openings, which could be possible with automatic man-agement procedures as done for irrigation canals in order to achieve minimum water losses (Wahlin et al. 2014). The automation of the structures has enabled significant progress in terms of hydraulic management (compliance with flow rates and set-point levels), using methods based on the automation and simulation of hydraulic dynam-ics. The application of such methods to the biological quality of environments is more recent, such as the management of algal populations in water distribution channels for irrigation supply (Fovet et al. 2012). The approach developed here could be extended to evaluate the contribution of automatic control on the optimization of gate opera-tion of all structures, aimed at maximizing the passability of structures for fish while limiting salt inputs and level variations.
5.4. Hydraulic modelling for water management and ecological issues The hydraulic model allows to simulate the water level and the flow rate at any position of the network and any time, then to evaluate management scenarios based on a large number of criteria:
• Water levels for management: maximum levels for submersion issues, minimum levels for freshwater availability. It is also possible to quantify the tidal range for bank stability issues. We have used an average level as a reference.
• Drainage and water supply: water volumes exchange within the marsh, or be-tween the marsh and other connected water bodies (e.g. the estuary, the up-stream river system), is a key information for some human activities (e.g. irriga-tion). In our example we used the volume ratio at the mouth of the marsh. • Fish obstacle and fish habitat issues: as shown in our study, 1D-modelling can be
used to estimate velocities at obstacles, and water level and mean flow velocity along the system which are essential variables for habitat modelling.
• Tidal range as an ecological criterion: in some coastal marshes, the appearance of particular flora is conditioned by the tidal range.
Models based on Saint-Venant equation can be coupled with other equations to estimate the evolution of temperature or the transport of solute (e.g. salt) in a hydro-graphic network. It is then necessary to develop the monitoring network (e.g. salinity or temperature sensors) for the calibration of the specific models.
6. Conclusion
Among the causes of fish population decline, the fragmentation of habitats and a limited access to suitable ones may be partially addressed with cheap and acceptable adaptations, based on a better understanding of fish behavior and soft solutions for the management of hydraulic structures. Here, we have considered tide-influenced