The Business Strategy of Japanese Slers
by
MASAHIRO KASHIBE
Bachelor of Economics,
Tohoku
University
(1988)
SUBMITTED TO THE MIT SLOAN SCHOOL OF MANAGEMENT
IN PARTIAL FULFILLMENT OF THE REQUIREMENTS
FOR THE DEGREE OF
MASTER OF BUSINESS ADMINISTRATION
at
the
MASSACHUSETTS INSTITUTE OF TECHNOLOGY
June 2006
@
2006 Masahiro Kashibe. All rights reserved.
The author hereby grants to MIT permission to reproduce and to distribute publicly
paper and electronic copies of this thesis document in whole or in part.
Signature
of Author
MIT Sloan School of Management
May 10, 2006
Certified by:
-J
Michael A.
Cusumano
Sloan
Management
Review Professor of Management
Thesis Advisor
Accepted by:
Stephen J. Sacca
Director, MIT Sloan Feo-1ws Program in Innovation and Global Leadership
OF TECHNOLOGY
AUG
3 2006
LIBRARIES
ARCHNIVES
The Business Strategy of Japanese Slers
by
MASAHIRO KASHIBE
Submitted to the MIT Sloan School of Management
on May 12, 2006 in partial fulfillment of the requirements for the Degree of
Master of Business Administration
ABSTRACT
The fundamental role of the System Integrators (Slers) is to provide
customized IT systems or services that satisfy the unique requirements of each
customer by integrating the various products and services that many IT companies
produce. Originally, the IT companies in the different business segments such as the
consulting business, hardware business, and software product business have
complemented each other, and Slers played the roles of coordinators between these
various IT companies and the customers. However, the business model of IT
companies is rapidly changing. The firewalls separating business segments in the
industry are becoming obsolete, and the Japanese Slers are now getting involved in
the intense new competition. This thesis identifies key elements that influence the
future business of Japanese Slers. It also proposes sound strategies that will enable
Japanese Slers to grow solidly from the viewpoint of top management.
From the technological viewpoint, my research finds that the commoditization
and openness of technologies have made hardware and software product
companies shift their business focuses from products to services. On the other hand,
from the market viewpoint, customers are implementing the strategies that select
and focus on core businesses. Customers are actively trying to find outsourcing
opportunities. The enterprise IT systems are no exception. Customers are trying to
maximize business value using IT by distinguishing strategic systems that should be
customized and owned by themselves from commodity systems that should reduce
costs by adopting outsourcing services. Under these changing environments, Slers
will be unable to maintain the sustainability of their business simply by improving
their current core competency: system integration. I argue that Slers should create
new relationships with complementors. Developing open-application platforms and
sharing them with IT service providers widely will allow Slers to create a new
software ecosystem that will provide mutually beneficial relationships with their
current competitors. The Slers should not focus on cost reduction in offshore
development; rather, global sourcing and global business expansion should be the
center of the strategies for offshoring. I also show that the development of consulting
services and the hybrid services that combine outsourcing and system integration
services will be the keys to further growth.
Thesis Supervisor: Michael A. Cusumano
TABLE OF CONTENTS
Page
Chapter 1: Introduction
...
8
1.1
Background
...
8
1.2 Objectives
of
the Project...
9
1.3 Methodology...
9
1.4
Structure Overview
...
10
Chapter 2: The Nature of SI Business...
11
2.1
The Definition of System Integration (SI) and Slers
... 11
2.1.1
Definition
of SI ...
11
2.1.2
Definition of Sler...
14
2.1.3
Sum mary of Definition...
20
2.2 Business Model of Slers...
20
2.2.1
Products of Slers...
20
2.2.2
Two Business Formats
...
21
2.3 The Characteristics of Japanese Slers...
22
2.3.1
The Oligopoly of IT Market...
...
...
23
2.3.2
The Hierarchical Business Structure
...
24
2.3.3
Business Portfolio Analysis
...
25
2.3.4
Statistical Analysis...
28
2.3.5
Project Management & System Development Methodology
... 35
Endnotes for Chapter 2...
39
Chapter 3: IT Investm ent Analysis ...
40
3.1. Trends in Japan's IT Services Market ...
40
3.2. Analysis of Customer Trends
...
44
3.3. Conclusion...
51
Chapter 4: The Consulting Business ...
54
4.1. An Overview of the Consulting Business...
55
4.2. Five-Forces Analysis
...
58
4.3. Customer Segmentation...
61
4.4. Bundle of Com petencies
...
62
4.5. Environmental Scan
...
63
4.6. The Scope of Strategies
...
64
4.7. Entering Model
...
65
4.8. Conclusion...70
Endnotes for Chapter 4...72
Chapter 5: Project-Based (System Integration) Business...73
5.1. Project-Based (System Integration) Business Overview
... 73
5.2. Five-Forces Analysis ...
80
5.3. Customer Segmentation ...
83
5.4. Bundle of Com petencies
...
84
5.5. Environm ental Scan
...
85
5.6. The Scope of Strategies ...
87
5.7. Strategic
Thrusts ...
92
5.8. Conclusion...
104
Endnotes
for Chapter 5...
106
Chapter 6: Outsourcing Business... 108
6.1. Definition of the Outsourcing Business... 108
6.2. M arket Overview
...
115
6.3. Five-Forces
...
122
6.4. Customer Segmentation...
125
6.5. Bundle of Com petencies
...
126
6.6. Environmental Scan
...
127
6.8. Strategic Trusts
...
129
6.9.
Conclusion...
140
Endnotes
for Chapter
6...
143
Chapter 7: O pen Technology ... 144
7.1. Open Source
...
145
7.1.1. The Analysis of Open-Source Penetration
...
145
7.1.2. The Quadrant Fram ework
Analysis...
149
7.1.3. Evaluation of the current potential of OSS
...
152
7.1.4. The Im pact on SI Business
...
155
7.2. O pen Architecture
...
156
7.2.1. The Business Im pact of
Standardization...
156
7.2.2. Electric Com m
erce (EC) M
arket Analysis
...
157
7.2.3. Strategy for Software M odularization
...
159
7.3. Conclusion...
162
Endnotes for Chapter
7...
164
Chapter 8: Conclusion... 165
ACKNOWLEDGMENTS
As I worked on this thesis project, my company, professors, and friends at
MIT Sloan Fellows Program helped me gain broader perspectives while giving me
opportunities to enhance my talents. There are many individuals to whom I would
like to extend my sincere thanks and appreciation:
Professor Michael A. Cusumano for his remarkable direction of my thesis and his
able assistance throughout my research activities.
Professor Arnoldo C. Hax, for introducing his excellent strategic planning
methodologies.
Mr. Syunichi Kominami, Senior Executive Vice President & Representative Director
of NTT Data Corporation, and Mr. Takashi Enomoto, Senior Vice President &
Director of NTT Data Corporation, for giving me this great opportunity to study at the
MIT Sloan Fellows Program.
Mr. Toshio
Iwamoto,
Senior Vice President of NTT Data Corporation, for giving me
many opportunities and kind encouragement.
Mr. Moritaka Watanabe and Mr. Masaru Sasaki, Senior Executive Manager of NTT
Data Corporation, for enormous supports to study at the MIT Sloan Fellows Program.
Mr. Tohshi Fujiwara, Senior Executive Manager of NTT Data Corporation, for
thoughtful advices on my thesis.
Ms. Yoko Tomioka, Manager of NTT Data Corporation, for strong support during my
year in the MIT Sloan Fellows Program.
My colleagues in System Planning Group of NTT Data Corporation, for continuously
being my source of motivation and inspiration.
Ms. Elizabeth Fox, for her excellent editing.
I would also like to thank the members of the MIT Sloan Fellows Program Office for
the great coordination and work for the program.
I am grateful to my father and father-in-law, who could not witness my achievement.
I dedicate this thesis to the memory of my father and father-in-law.
Finally my acknowledgement of great thanks to my wife, Iri, and my son, Yuri, for
their cooperation and kind assistance - with my great gratitude.
Chapter 1:
Introduction
1.1
Background
The business of corporate System Integration (SI) seems to be at a critical
turning point. We can find the significant phenomena that have the potential for
fundamentally changing this business. Technical innovation is expanding its
influence to more applications and making technology more service-oriented. The
innovation creates the new ecosystem of software called "collaborative
development." The customers are also changing. Thanks to the technology, the
business and service revolutions we have experienced in
B2C
business after the
advent of the Internet technology are steadily making an impact on
B2B
business,
too. As customers focus on core businesses and gain more flexibility,
their
expectations of IT systems and System Integrators (Slers) are changing. It will be
difficult to have solid growth if Slers cling tenaciously to the conventional methods of
SI
business. From the global viewpoint, the prosperity of global sourcing is starting
to influence the Japanese SI market, which originally had relatively high barriers to
globalization, from the viewpoint of both the economy and geographic location of the
business. If we shift our focus to the competition, many players, which formerly were
categorized in different segments, are aiming to expand their businesses and
competing with each other in the same market under the name of "IT Service
Providers."
What can differentiate Slers from other competitors? What is their core
competence? What business should they focus on? These fundamental questions
come from the author's experiences as a senior manager in a system integration company. Now is the right time to review the current situations of Slers and to identify the directions to follow.
1.2 Objectives of the Project
The objectives of this thesis are to identify and analyze key elements that influence the future business of Slers and to create sound strategies that enable Slers to grow solidly from the viewpoint of top management. Various research companies and IT consultants have developed analyses of the future IT market or required business strategies for IT companies. However, most of them do not differentiate Slers from other IT service providers. I focus on the Slers' viewpoint because I believe the characteristics of Slers, which include the various business elements of IT service providers, require unique business strategies.
1.3 Methodology
This thesis relies on research into and analysis of various businesses that
Slers cover. I research market trends in the IT industry and analyze strategies of key players in the industry. I also focus on the changes in customer requirements for IT. I do not focus on the environment and strategies for a specific company. Rather, I try to figure out the dynamics that create the tide of new business in the SI market as a whole. Based on this understanding, I identify the keys to success in the SI business from now on and explore the appropriate and universal strategies for Japanese Slers.
I apply the Delta Model as a framework for developing strategies. The reports of premier IT research firms are helpful for gathering market data. I also fully utilize the theory and knowledge that I have learned in the classes to derive fundamental theories from the phenomena in the market. The author's personal experience in a Japanese system integration company is helpful to obtain better understanding and consideration of the current SI market.
1.4 Structure Overview
This thesis is composed of seven chapters beyond this one. In Chapter 2, I
define the Sler and the business scope that I focus on. I also illustrate the characteristics of Japanese Slers in contrast to foreign Slers. In Chapter 3, I analyze the trends of the Japanese SI market and customer investment. Chapter 4 analyzes the market conditions and competitiveness of the consulting business and create strategies for Slers. In Chapter 5, I analyze the business environment of project-based business and propose the required strategies. Chapter 6 assesses the business conditions for outsourcing and suggests the appropriate strategies. In Chapter 7, I focus on open technologies that have a significant impact on both the IT market and the business of Slers. I interpret the essential significance of the paradigm shift and examine the appropriateness of my proposed strategies. Chapter 8 summarizes the insights and recommendations that I develop in previous chapters.
Chapter 2:
The Nature of SI Business
2.1 The Definition of System Integration (SI) and Slers
The words "System Integration" ("SI") and "System Integrator" ("Sler") are ambiguous. Every IT research company defines these words in a different way, and many IT companies define themselves as "Slers". For example, the phrases "IT services providers" in Gartner's words', "IT service vendor" 2in IDC Japan's words,
and "Information service company"3 in Nikkei Computer's words have almost the
same meaning. These three words mean the companies that provide various IT related services such as system design, system development, IT outsourcing, and system maintenance. Software Magazine includes more than ten different software business sectors in the category of System Integration Business4. Basically, "SI" is the name of IT service and "Sler" is the companies that provide the service. There are roughly three factors that make the definition of SI and Slers ambiguous. One is the diversity of the market that SI business includes. Another one is the wide variation of services that Slers provide. The last thing is the diversity of business players in these market and services. First of all, I would like to define "SI business" and "Sler" to clarify the scope of the paper.
2.1.1 Definition of SI
Defining the word "SI (business)," requires clarifying the target market, customers, and services it includes.
(1) Target Market
If I define the scope of SI market by using two fundamental elements, I can define the taraet market of Slers as the shaded area shown in Fiqure 2.1.1-1
Figure 2.1.1-1 Target Market of SI
(2) Target Customers
In general, the SI business targets corporate and public business. It depends on the size of the Slers, but they basically cover diversified industries by having expertise or a focused organization for each industry. For example, typical Japanese Slers have three different business divisions: a public industry division, a financial industry division, and an enterprise business division. The public industry division covers both government and municipalities, and the financial industry division covers various customers in the industry such as city banks, regional banks, security companies and so on. In general, the enterprise business division consists of
industry-focused sub-divisions such as telecommunication, retail market,
(3) Service Variations
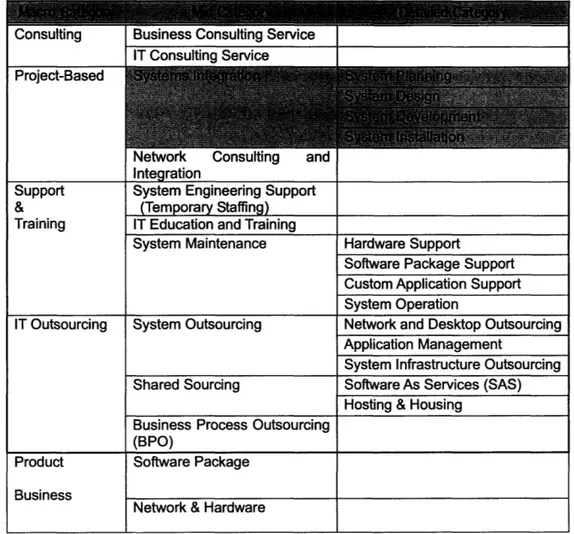
The services of Slers are well diversified. They provide various kinds of IT-related services, combine them into integrated services, and support whole lifecycle of customers' IT needs. Table 2.1.1-1 shows diversified service varieties that Slers can provide. Many IT companies have created unique buzzwords for their services, but the Table covers fundamental service. First-tier Slers can provide whole services, but other Slers might focus on some specific services. For example, providing system maintenance services that includes 24H/365D nation-wide support is difficult to have for relatively small Slers. The consulting business is another example that is not so easy to provide for mid- or small-size Slers, because the required resources are different from other IT services.
Table 2.1.1-1 Service Variations of Slers I IT Consultina Service Project-Based Support & Training IT Outsourcing Product Business
Network Consulting and
Integration
System Engineering Support (Temporary Staffing) IT Education and Training System Maintenance
System Outsourcing
Shared Sourcing
Business Process Outsourcing (BPO)
Software Package Network & Hardware
Hardware Support
Software Package Support Custom Application Support System Operation
Network and Desktop Outsourcing Application Management
System Infrastructure Outsourcing Software As Services (SAS) Hosting & Housing
2.1.2 Definition of Sler
(1) Players
Before I move to the definition of Slers, I would like to define the players in IT industries. Table 2.1.2-1 shows the business players related to SI business. I categorized these players based on the differences in their core businesses. Many of these players have various business capabilities, and their business scopes overlap.
21 2-1 Plavar_ Related to SI busineAs Company Program Development Company Engineer / Programmer Staffing Company Application Service Provider (ASP) Hardware Company IT Consulting Company System Integrator
the software package. It can also provide consultation and customization of the package. The company whose core business is to develop programs based on project-based contracts. The company whose core business is to deliver temporary engineers or programmers to support the clients
The company whose core business is to provide application services using IT. It charges based on the services customers use.
The company that manufactures hardware products. It also provides various IT-related services.
The company whose core business is business and IT consulting. It also provides various
IT-related services.
The company whose core business is project-based system integration. It also provides various IT related services.
Business Consulting Cresco, Ines
Various small companies
Google, Yahoo
IBM, Hitachi, Fujitsu, NEC
Accenture, NRI, JRI NTT Data, CSK, TIS, NS Solution
(2) Definition
In my definition of Slers, they are the companies that provide project-based System Integration Services as their core business. The core business is the one that makes the largest revenue or profit, or that is regarded as the corporate mission. In other words, a company that provides System Integration service as its main revenue source could be categorized as an Sler. For example, hardware companies, such as IBM or Fujitsu, also provide System Integration Service, and it is becoming their main revenue source. However, I should differentiate Slers from hardware vendors because of the fundamental difference in the natures of their businesses. Even though hardware vendors, such as IBM, have shifted their business from products to services, they still have the objectives of selling their own products, and they can create synergy with product businesses and other IT services. At the same time, specifically for Japanese hardware vendors, the open architecture and commoditization of hardware have made them give up their own technology and they no longer persist in selling their own hardware. From this viewpoint, the boundary between hardware companies and Slers is blurring.
I also differentiate package software companies, such as Oracle or SAP, from Slers. In these enterprise package software companies, the revenue from service has exceeded the revenue from product licenses. However, their service basically focuses on the installation and customization of their own software products. I regard their services as support and training, not System Integration, in Table 2.1.1-1. The fundamental business objectives of package software companies are to develop competitive software products and expand their market share. Additionally, Slers are
excellent business and implementation partners for them. From this viewpoint, the business strategy of package software companies should differ from that of Slers.
Nevertheless, as package software companies have shifted their business to services more and the revenue from license relatively has gone down, they have become closer to Slers. At some point in the near future, it might be impossible to differentiate them from Slers. Table 2.1.2-2 shows the relationship between players and the services they provide. The table indicates that all the players in the IT industry can provide project-based service to some extent. It also shows that both hardware companies and IT consulting companies compete with system integrators in terms of breadth and depth of services.
Between Plavers and Service Cove 0 (Support) Core Core 0 0 Core (Support) A A 0 Core A (Support) 0 0 0 0 Core 0 Core 0 0 0 0 0 (Sales) 0 Core 0 0 0 0 (Sales)
(3) The Role of Slers
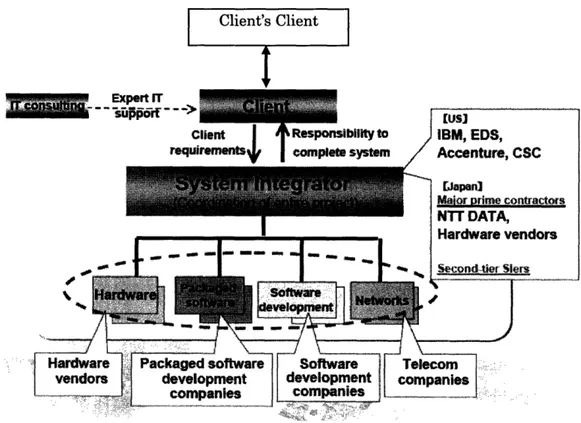
Figure 2.1.2-1 shows the role of Slers. An Sler can develop a computer system by itself, but according to the complexity or the size of the project, it may subcontract with other IT companies to get technical assistance or system engineers' resources.
qExpert rr
Source: "Information January, 2006," NTT Data Corporation s Figure 2.1.2-1 The Role of Slers (5) Technology Focus
In general, Slers cover various technologies and platforms. Multi-vendor support has been one of their competencies in the SI business. However, as technology becomes open, the advantage is weakening rapidly. For example, before the open technology became so popular, hardware vendors could not develop multi-vendor systems because they did not have the knowledge of other vendors' products. Only Slers had that kind of knowledge and experiences. Recently, almost all hardware vendors advocate multi-vendor integration, thanks to the open technology.
2.1.3 Summary of Definition
As illustrated above, I define Slers in this paper as having four characteristics: (1) the company originally provides project-based system-integration service; (2) it also provides various IT-related services such as outsourcing or consulting and integrates these services into comprehensive IT services; (3) basically, it produces no hardware products; and (4) the revenue proportion of the software products license is relatively small, with the software license business not a prime objective.
Some hardware vendors are giving up their own technology and developing integration of multi-vendor products. They are shifting their businesses from product businesses to services. In many enterprise software package vendors, the revenue from service has exceeded the revenue from licenses. The products are expanding horizontally or vertically, as in the case of Enterprise Resource Planning (ERP) products companies. The fundamental business differences between Slers and product companies are diluting.
2.2 Business Model of Slers
The business model of Slers is well diversified. It is very useful to understand the business model variations of Slers to analyze and develop the business strategies for Slers.
2.2.1 Products of Slers
products to sell. In terms of tangible products, they sell both hardware and software. In general, Slers do not actually produce any hardware. They re-sell hardware for customers based on the project's requirements. They can earn a margin because of their strong bargaining power against hardware vendors. Many Slers deploy multiple vendors' hardware, and multi-vendor integration is one of their advantages. In some cases, they have OEM hardware, or they sell hardware as wholesalers. They could make a reasonable profit from the hardware business, but as hardware becomes commoditized and down-sized, it is becoming less profitable. The business model and the business situation are almost the same in software products. Often Slers re-sell packaged software to customers. They also have their own software packages. However, the business volume is relatively small, and many of these software packages are supposed to be customized to adapt to customer requirements. Slers position their own software products as a way to help their system integration business.
The Slers also sell intangible products. Those products include expert knowledge. They assign engineers or consultants to help specific customers' work, and they charge based on time. This practice is particularly common in the upper phase of system development, where the project scope and baseline are ambiguous. The temporary programmer agency business is a common business model for program development companies, and Slers use these companies as a programmer resource.
2.2.2 Two Business Formats
is the System Development Service Model; system integration business belongs to this category. The other is the Service Provider Model; outsourcing business and XSP business belong to this category. In the service provider model, Slers retain ownership of the assets for IT systems and provide management and maintenance services for clients. Clients pay fees for their use. They can avoid the burden of substantial commitments of funds. For Slers, there is a fairly large capital investment necessary in the initial stages, but once an order has been received, it represents a stable revenue source for the length of time that the client uses the services. On the other hand, the system development service model delivers systems when a project is completed, and the client pays a lump-sum fee at the end of the project. Table 2.2.2-1 summarizes the characteristics of both business models.
Type of Contract Owner of Assets Payment Method Stipulated Contract The Company Monthly Fees Inalvidual Contract Client Lump-Sum Payment Source: "NTT Data Annual Report 2005," NT DataCorporation
2.3 The Characteristics of Japanese Slers
To analyze the business condition or to create a business strategy for Japanese Slers, it is quite useful to understand the characteristics of Japanese Slers in comparison with other IT companies or foreign Slers. Major traits of Japanese Slers include the oligopolistic nature of the market and the hierarchical structure of Japanese business.
2.3.1 The Oligopoly of IT Market
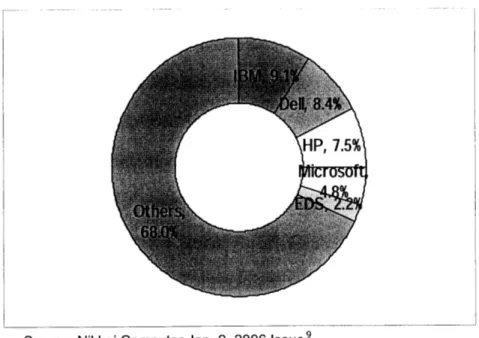
The Japanese IT market is in an oligopolistic condition. In terms of market share, the sales of the top five companies occupy 67.5% of Japan's IT market. In contrast, the top five US companies occupy only 32.0% of the US IT market. Until the mid-80's, IBM had more than 50% of US market share, but it declined to 20% in the end of 80's, and many new companies arose by turns7. In Japan, this oligopolistic market condition has not changed for decades. From a historical viewpoint, the protectionism of the Japanese government in the incubation period of the domestic IT industry created the base of a stable market oligopoly, and conservative business customs have sustained the environment. In a sense, this protectionism could help Japanese computer vendors to survive, as opposed to the European situation. However, we could say the protectionism has also prevented new venture companies that had a specific technology or cutting-edge solutions from arising.
Source: Nikkei Computer Jan. 9, 2006 Issue 8
Figure 2.3.1-1 Market share of the Japanese IT Market
Source: Nikkei Computer Jan. 9, 2006 Issue9
Figure 2.3.1-2 Market share of US IT Market
2.3.2 The Hierarchical Business Structure
The oligopolistic structure of the Japanese IT market developed the hierarchical business structure of the Japanese SI business, which is killing profits of software development companies. In a general system development project, the top five companies play the roles of prime contractors, which make contracts directly with customers; they make sub-contracts with their partners, and these partners again make sub-contracts with smaller software development companies. Generally, less than 15% of engineers come from the prime contractor, and others come from sub-contracted partner companies. In every layer of the contracting, owners get a margin, squeezing from subcontractors, and this profit-taking spoils the global cost competencies of the Japanese SI project. There are mainly three reasons why Slers subcontract with others. Firstly, it is to cover diversified business and technological requirements. In particular, the use of Open Technology has made systems more
complex, and as a result, system integration projects require more engineers who have in-depth knowledge about a specific technological field or products. Secondly,
Slers need to have better access to the engineers' resource pool. Especially in a big project, they require a lot of programmers. Thirdly, Slers need to have cheaper engineers and programmers. Because of the company size, the engineers' cost in a large scale SI company is high. Additionally, more than 60% of the project cost comes from the labor cost. As a result, Slers seek low-cost human resources from outside companies, and this situation engenders a cost-reduction requirement against companies in lower ranks of the hierarchy of the contract structure and prevents smaller IT companies from growing.
Hardware Cost Software Cost Development Cost Test Cost
Labor Cost = 60%
-Figure 2.3.2-1 Cost Structure of a system development project
2.3.3 Business Portfolio Analysis
(1) Business Geography
The business of Japanese Slers is limited in Japan, just as other software business is limited in Japan. More than 90% of their revenue comes from domestic business. Japanese Slers have established foreign software development centers, especially in China, but they are the offshore development centers for the Japanese market. Because Japan is the second largest IT market globally, Japanese Slers have not necessarily expanded their business to overseas. Additionally, the SI business requires close communication with customers. While the language problem is a hindrance to global business for Japanese Slers, this limitation also helped them
not to lose market share in Japan to foreign competitors.
However, this geographical limitation has also limited their business opportunities, and they do not have scale competency with global players. Table 2.3.3-1 shows the small presence of Japanese Slers in the global IT service market.
Table 2.3.3-1 Ton Ten Software Comnan
Armonk, NY ation Server/Web
Server
Microsoft $33,969.00 15.40% $36,835.00 57,086 Operating
Redmond, WA Systems
EDS $20,669.00 0.50% $20,669.00 117,000 IT Sourcing
Piano, TX
Computer Sciences $15,188.10 9.70% $15,188.10 76,000 System Integration
Corporation Services/IT
El Segundo, CA Consulting
Accenture $15,113.60 12.80% $15,113.60 100,000 System Integration
New York, NY Services/IT
Consulting Hewlett-Packard $13,778.00 35.50% $79,905.00 151,000 System Integration
Company Services/IT
Palo Alto, CA Consulting
Oracle Corporation $10,156.00 7.20% $10,156.00 41,658 Database
Redwood City, CA
Hitachi, Ltd. $9,490.70 2.50% $84,365.00 347,424 Telecommunicatio
Brisbane, CA n Services
SAP $9,313.50 5.00% $9,313.50 32,000 Business Process
Newtown Square, PA Management
Capgemini $8,580.90 18.80% $8,580.90 59,324 System Integration
New York, NY Services/IT
Consulting Source: "2005 Software 500," Software Magazine
In contrast, more than 80% of the revenue of the top six Indian IT companies
comes from outside India. In particular, the US is their biggest market. This situation is quite reasonable because the Indian domestic IT market has not been well developed, and these companies have expanded their business by acquiring outsourcing and off-shoring needs of US customers.
2 3 4 5 6 7 8 9 10
Nortn America bbb.U/o bZ.J3o bU.0% b t4.44% b U.b% b 64.3% :jbb.U/o
Europe 24.9% 33.0% 23.2% 18.5% 21.4% 8.8% 21.6%
Others 10.1% 4.7% 17.3% 17.1% 18.0% 6.9% 12.4%
Source: "Benchmarking Report," Patni Computer Systems Ltd.
2.3.4 Statistical Analysis
From statistical data about the software industry, we can find some characteristics of Japanese Slers. The research about Japanese software companies shows that 47.4% of software companies think that project-based system development is their core business. In other words, about 50% of Japanese software companies can be categorized as "some kind of Slers."
M Package Software Development and Sell
N Project-Based System Development o Game Software O Embedded Software Development * Temporary Engineer/Programmer Business E ASP * Others, N/A
Source: "Software Business no Kyousouryoku" (Competencies of Software Business), Software Sangyo Kenkyu-kai1"
Figure 2.3.4-1 The Core Businesses of Japanese Software Companies
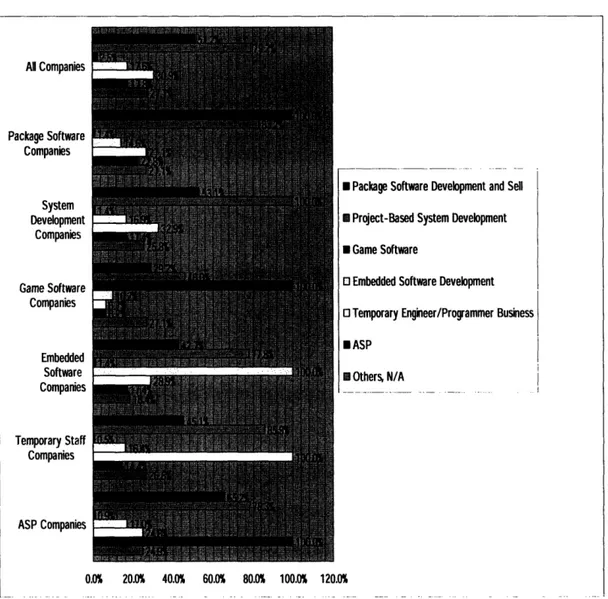
The business distribution of Japanese software companies (Figure 2.3.4-2) shows that almost 80% of software companies, except for game software companies, provide project-based system development service. We can say that project-based system development is the most popular software business in Japan.
* Package Software Development and Sell
I Project-Based System Development
M Game Software
o Embedded Software Development
o Temporary Engineer/Programmer Business
H ASP Al Companies Package Software Companies System Development Companies Game Software Companies Embedded Software Companies Temporary Staff Companies ASP Companies 0.0% 20.0% 40.0% 60.0% 80.0% 100.0% 120.0%
Source: "Software Business no Kyousouryoku"d' (Competencies of Software Business), Software Sangyo Kenkyu-kai 12
Figure 2.3.4-2 Business Distribution of Japanese Software Companies
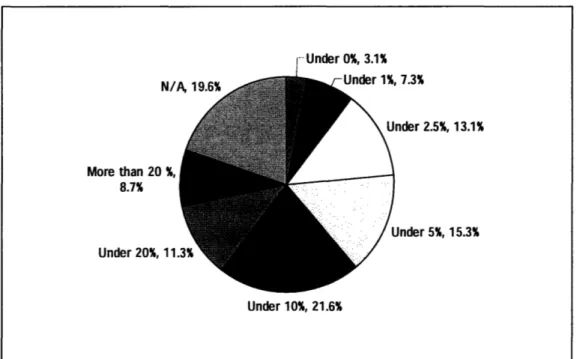
From the viewpoint of profitability, 56% of Japanese software companies have less than 10% of the current profit/total capital ratio. A look at the details of the
situation by core business categories shows that about 40% of package software companies make more than 10 % of the current profit/total capital ratio. We could say that package software companies are more efficient than Slers, and this fact coincides with the nature of the software business.
More than 2C 8.7% Under 20%, -Under 0%, 3.1% 7.3% nder 2.5%, 13.1% Jnder 5%, 15.3% Under 10%, 21.6%
Source: "Software Business no Kyousouryoku" (Competencies of Software Business), Software Sangyo Kenkyu-kai 13
Figure 2.3.4-3 Distribution of Current Profit I Total Capital Ratio of Japanese
Package Software
Development
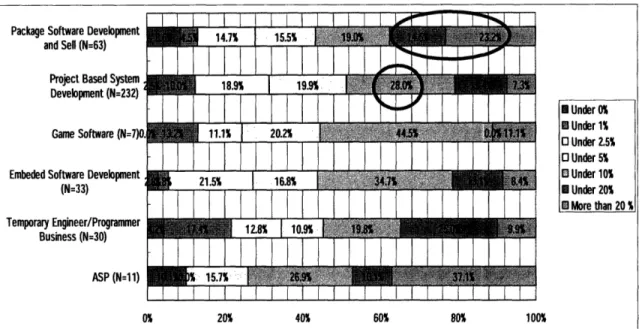
Project Based System
18.9%
199
Development (N=232)
Game Software (N=7)0. 11.1% 20.2% 4 1
Embeded Software Development 21.5% 16.8% 343•4,
(N=33)
Temporary Engineer/Programmer [2.8 109IIUI
Business (N=30) 12.8 10• ASP (N=11): ••5.7 __ _ l _
---M Under 0% M Under 1% o Under 2.5% o Under 5% n Under 10% M Under 20% E More than 20 % 0% 20% 40% 60% 80% 100%Source: "Software Business no Kyousouryoku" (Competencies of Software Business), Software Sangyo Kenkyu-kai 14
Figure 2.3.4-4 Distribution of Current Profit / Total Capital Ratio of Japanese
Software Companies by Core Business
If we compare the top Japanese Slers' profitability with that of foreign SI companies, we can find several significant characteristics. Table 2.3.4-1 and Table 2.3.4-2 show the profitability of the top Japanese and US system integration business providers. The overall profitability of Japanese Slers is relatively homogeneous compared to the US profitability. This fact indicates that the business portfolios of the Japanese top players are similar to each other. As mentioned before, the core business of Japanese Slers is customized system development (project-based system integration), which is a relatively low-profit business compared to consulting or a package-based business. They use many domestic sub-contractors, and there is not enough room to reduce costs further in this business format because of the labor costs. These are the main causes of this homogeneous profitability. The only Sler in the table based on a consulting firm, NRI has strength in the consulting-based
business, and this strength allows it to achieve higher profitability than other players in Japan.
On the other hand, the profitability of US top players varies so much because of the differences of their core businesses. Obviously, consulting-based business providers such as Accenture and software product providers such as Oracle and SAP can achieve higher profitability, and outsourcing business players such as EDS have experienced stagnant business conditions.
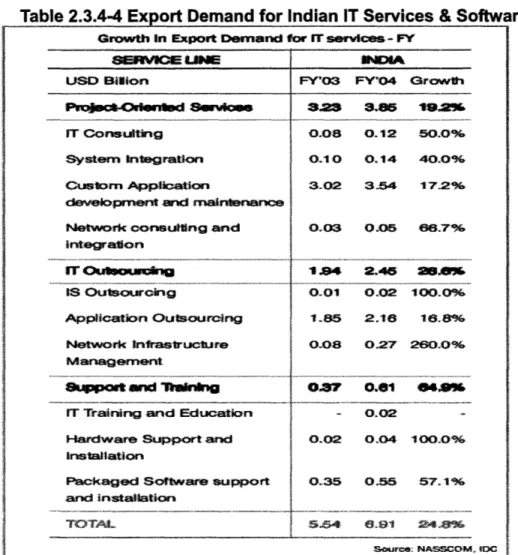
Table 2.3.4-3 shows the higher profitability of Indian Slers. The sum of 73.9% of Indian IT services and software market comes from export business1 . A
total of 56.6% of it comes from IT services & Software business, and 82.5% of this business consists of the custom-application development/maintenance and the
outsourcing of applications1 6 (See Table 2.3.4-4). The core business model of Indian
Slers is the same as that of Japanese Slers, but the huge structural difference between these two countries' SI business appears in the reliance on export. I gather from these data that the reason why Indian Slers' profitability is far above that of the Japanese one is their low domestic labor cost, because controlling labor cost is the key to making a profit in this business category. Indian Slers can enjoy the difference between global market prices and domestic labor costs.
I-ujitsu N/A b.416 boTtware berVICe unly
Hitachi N/A 4.8% Information Technology Only
Cannot Calculate SI
NEC N/A N/A
Business Separately
IBM N/A N/A Not Disclosed Japanese One
NTT Data 24.1% 4.6%
Cannot Calculate SI
Toshiba N/A N/A
Business Separately
Non-Consolidated, Service
Nihon Unisys 17.2% N/A Business Only
Business Only
Information Service CSK N/A 6.0% Business Only NRI 24.6% 12.2% TIS 18.4% 7.5% NS Solutions 20.1% 8.0%
HP N/A N/A Not Disclosed Japanese One
Fujisoft ABC 18.7% 6.6%
Information Business Only
Oki N/ A% 4.1%
(Including Printer Business)
Otsuka 23.3% 4.6%
Source: Author (2006)
Ranking is based on SI vendor Ranking in 2004, IDC Japan 7
Gross Margin % and Operating Income % are calculated by author from annual report and 2004 financial statement of each company.
Tahle 2_3_4-2 US Tnn Ranked Slers' Profitabilitv in 2004
IBM 25.0% N/A IBM Global Service only
EDS 8.3% -0.5%
CSC 19.5% 5.1%
Accenture 29.8% 12.3%
HP N/A 7.40 HP Service only
Oracle 56.3% 34.1% All Business
Oracle(Service) 14.5% N/A Service Business Only
SAP 65.7% 27.4% All Business
SAP(Service) 22.4% N/A Service Business Only
Capgemini 26.8% 0.9%
Source: Author (2006)
Ranking is based on Software Magazine 500, 2005 (Excluding Microsoft)' 8
Gross Margin % and Operating Income % is calculated from annual report and 10k in 2004
of each company by author.
ty in 2005 Infosys 42.9% 29.3% Wipro 34.8% 24.2% TCS 46.2% 27.0% Satyam 37.3% 20.7% HCL Tech 37.7% 17.9% Patni 35.9% 14.6%
Source: "Benchmarking Report," Patni Computer Systems Ltd.
(Data is for the Quarter ended 3 1st December, 2005.)
----Table 2.3.4-4 Export Demand for Indian IT Services & Software
Source
2.3.5 Project Management & System Development Methodology
The software business is quite a labor-intensive industry. In fact, hardware and technology have been improved year by year, as Moore's Law states, but the program development process and methodology have not improved so much. Especially in the enterprise system integration business, it is common that a project continues more than two years and requires more than two thousand man-months. In such a huge project, the Sler plays a key role as a prime contractor and takes
Growth in Export Demand for IT services- FY
SWWVIM im WWNEIND
USD Bilion FY'03 FY04 Growth
PWoect-Odmfld Survnoe 8328 8.85 19.2%
IT Consulting 0.08 0.12 50.0%
Systemrn Integration 0.10 0.14 40.0%
Custorn Application 3.02 3-.4 17.2%
development and maintenance
Network consulting and 0.03 0.05 66.7% integration IT OuboStaufug 1.94 2.46 2l.fl IS Outsourcing 0.01 0.02 100.00% Application Outsourcing 1.85 2.16 16.8% Network infrastructure 0.08 0.27 260.0% Managemrnent
uppt and WW r*u1 o0rM 0.e1 04A%
IT Training and Education - 0.02
Hardware Support and 0.02 0.04 100.0%
Installation
Packaged Software support 0.35 0.55 57.1% and installation TOT 5.54 .91 24NS Source: NASSCOM ID ~ ý 4CCs --: NASSCOM 19
responsibilities for project management. The project management knowledge and methodology are critical competencies for Slers, and these traits differentiate Slers from package software companies. Of course, package product companies also manage projects, but these projects are basically internal products-development projects. The characteristics are quite different from Slers' projects, in which interaction with customers influences the management significantly. Specifically, the Japanese system development heavily relies on customized or "from-scratch" development. Additionally, system technology and requirements are becoming more complex. In the early 2000s, many SI projects failed because of delay, cost overrun, or quality problems, and these failures of the projects made a negative impact on Slers' business. After that, Slers have retrained engineers and managers, reinforced project management process, and restructured project management organization. Now, Slers consider a project manager a professional specialist, and they have imposed internal and external qualifications on the position. Figure 2.3.5-1 shows the transition of accumulated numbers of people who are qualified as Project Management Professionals by PMI. Though not all PMP-licensed people are from the software industry, the number explains how the concept of professional project management has become popular in Japan.
14000 12000 10000 8000 6000 4000 2000 99 00 01 02 03 04 05 97 98
Source: PMI Tokyo Chapter20
Figure 2.3.5-1 Accumulated number of PMP-eligible people in Japan System development methodology is another critical issue for Slers. Various kinds of development methodologies have been created, and most Slers have their own development standards that define tasks, development processes, and output based on these methodologies. The waterfall methodology is one of the long-standing methodologies and is popular among Japanese Slers. The research of Professor Cusumano in 2002 2 1 shows that 53% of projects in Japan adopted this
methodology. On the other hand, there are several criticisms of the effectiveness of this methodology. In fact, it lacks flexibility in terms of modification of customer requirements or system design, and the process accumulates risks that come to light only in later phases of the projects. I do not think the waterfall model is a typical methodology for Japanese Slers. They adopt different methodologies that fit each
project's nature and situation. However, we could say that the waterfall methodology fits the business structure and pricing method of Japanese Slers well. In general, in-house engineers of Japanese Slers play key roles until the end of detailed design when the programming phase is outsourced to software development companies. The software development companies also outsource a part of their business to smaller companies. The waterfall methodology, which defines requirements, functions and designs precisely and fixes them at the end of the design phase, is
very useful for this business structure. Moreover, this methodology can be combined tightly with project cost estimation. Slers estimate project costs by assessing required workload based on the project requirement, and once the budget is fixed, Slers take responsibility to control project costs. Therefore, fixing requirements and design in the early phase of the project and phase-by-phase confirmation of the output by customers, which are the characteristics of the waterfall methodology, work well for cost estimation and budget control by Slers. The choice of the best methodology to fit the project is important to maximize customer value, but Slers should have different pricing methods or models for different methodologies to avoid project failures.
Endnotes for Chapter 2
'Minjoo Chon, Jacqueline Heng, and Yuko Adachi, "Market Overview: IT Services Providers in Japan, 2003" (G00126120), Mar. 23, 2005, Gartner Inc: p. 1.
2 Kashiwagi, Ito, "Japan ITServices Opportunities and Contenders (Japanese Version):
Competitive Analysid' (#J42503), Oct. 2004, IDC Japan: p. 8.
3 "The 10h Customer Satisfaction Research," Nikkei Computer, Aug. 8, 2005 Issue: p. 50.
4 http://www.softwaremag.com/S_FocusAreas.cfm?Doc=The500.
5 "Information January 2006': p. B-3,
http://www.nttdata.co.jp/en/investor/presentation.html, NTT Data Corporation.
6 "NTTData Annual Report 2005': p. 46, NTT Data Corporation
7 "Japanese IT Jan. 9, 2006 Issue, Nikkei Computer: p. 59.
8 "Japanese IT Jan. 9, 2006 Issue, Nikkei Computer: p. 59. 9 "Japanese IT Jan. 9, 2006 Issue, Nikkei Computer: p. 59.
1 0 http://www.softwaremag.com/S_FocusAreas.cfm?Doc=The500
1 1 "Software Business no Kyousouryoku" (Competencies of Software Business), Software Sangyo
Kenkyu-kai, Chyuou Keizai-shya, Tokyo, Mar. 30, 2005: p. 153.
1 2 "Software Business no Kyousouryoku" (Competencies of Software Business), Software Sangyo
Kenkyu-kai, Chyuou Keizai-shya, Tokyo, Mar. 30, 2005: p. 152.
1 3 "Software Business no Kyousouryoku" (Competencies of Software Business), Software Sangyo
Kenkyu-kai, Chyuou Keizai-shya, Tokyo, Mar. 30, 2005: p. 155.
1 4 "Software Business no Kyousouryoku" (Competencies of Software Business), Software Sangyo
Kenkyu-kai, Chyuou Keizai-shya, Tokyo, Mar. 30, 2005: p. 156.
1 5 NASSCOM Facts & Figures http://www.nasscom.orglartdisplay.asp?catid=810#1
1 6 NASSCOM Facts & Figures http://www.nasscom.orglartdisplay.asp?catid=810#1
1 7 Kashiwagi, "Japan IT Services Opportunities and Contenders (Japanese Version):
Competitive Analysis" (#J42504), Jan. 2005, IDC Japan: p. 6. 18 http://www.softwaremag.com/S_FocusAreas.cfm?Doc=The500
1 9 NASSCOM Facts & Figures http://www.nasscom.org/artdisplay.asp?cat_id=810#1
20 http://www.pmi-tokyo.org/
Chapter 3:
IT Investment Analysis
Information technology has become the fundamental infrastructure for all industries and societies, and IT has expanded its market value continuously. Customers have intensively implemented IT systems to generate the maximum business value using IT. They have begun to evaluate Return On Investment in IT severely. Chapter Two defined diversified services that Slers provide. To create business strategies for each service category, it is essential to understand market conditions and trends precisely. This chapter analyzes customers' IT investment trends first. Secondly, it analyzes what customers expect from IT.
3.1. Trends in Japan's IT Services Market
Japan is the second largest IT market globally, but its growth has been stagnant after 2000, suffering from the restraint of enterprise IT investment after the so-called "IT Bubble Economy." After 2003, the market returned to steady growth. However, each IT investment has become smaller, and customers have become more cost-sensitive to IT investment. Slers, which always suffered from a chronic shortage of engineers and programmers because of the strong demand, have experienced either a slowdown of growth or shrinkage of business. Additionally, the deflation of the Japanese economy also decreased the prices of services. Moreover, open technology and the commoditization of hardware also made the situation worse. As a result, Slers have been involved in price competition without being able to convince customers that their premium price originally comes from their high value.
In 2004, the market size was about 4.6 trillion Yen, 2.9% growth over the previous year. Figure 3.1-1 shows the market size and growth rate of the Japanese market for Slers.
Source: Feb. 2005, IDC Japan 1
Figure 3.1-1 Market Size and Growth Rate of Japanese Market for Slers The overall market forecast (Figure 3.1-2) shows us steady growth from 2005, and many organizations have turned positive about IT investment. Additionally, the detailed IT investment distribution indicates steady growth of IT spending for IT service providers (Figure 3.1-3). However, as Figure 3.1-4 indicates, the business size of each system or project is shrinking, and customers are more cost- and ROI-sensitive. Now Slers are facing intensive pressure to reduce costs. They have expanded overseas development partners, especially in China, to access low-cost programmers and to strengthen cost competencies, but less room is left to cut costs just by finding low-cost engineers and programmers.
Billion Yen 5,000 4,000 3,000 2,000 1,000 n I U.U% 8.0% 6.0% I Market Size ---- Growth Rate 4.0% 2.0% 0 0% 1999 2000 2001 2002 2003 2004
Billion Yen
* IT Outsourcing * Project Base
O Support & Training
2004 2005 2006 2007 2008 2009
Source: Feb. /UU;, ILJ d iJdIpaI
Figure 3.1-2 Japanese IT Market Forecast 3000 2500 2000 1500 1000 500 n
100%
Source: May 2005, Gartner Japan3
Figure 3.1-3 Japanese IT Budget Distribution by Service Category
75
2000 2001 2002 2003 2004 2005
Source: Author (2006). Monthly averages were calculated by author based on Bank Of Japan's Service Price Index4
Figure 3.1-4 IT Service for corporate users price index
0 Others a Internal Engineers [ Network 0 External Engineers a Software 8 Hardware 1999 2000 2001 2002 2003 2004 2005 Plan (n=698) (n=824) (n=831) (n=687) (n=640) (n=596) (n=596) 105 100 95 90 85 80 75
---All Service Industry Average SCustom Software
Package Software System Management and
... Operation Services
Source: May 2005, Gartner Japan 3
Figure 3.1-3 Japanese IT Budget Distribution by Service
3.2. Analysis of Customer Trends
Many Slers claimed to reinforce their core business skills such as project management and quality control to survive severe conditions. However, we should analyze the IT value position of customers precisely to evaluate the rationality of Slers' strategies. Understanding customers' expectations from IT and the underlying problems of IT investment is necessary to create the right strategies. The IT
investment objectives are, of course, different for each customer, but it is important to look at what they as a whole expect to better understand the right direction for the strategy. Figure 3.2-1 shows the objectives of IT investment of Japanese customers. This kind of statistical research has been executed every year by various research companies, and the results have been almost the same every year. The top two (improvement of business process efficiency and cost reduction) are the basic advantages that customers can obtain by using IT, and regardless of the size of the organization, they are the most prioritized objectives.
0.0% 20.0% 40.0% 60.0% 80.0% I
Source: IT Service Japan - User Wants and Needs, Dec. 28, 2005, Gartner Japan5
Figure 3.2-1 Objectives of IT Investment in Japan
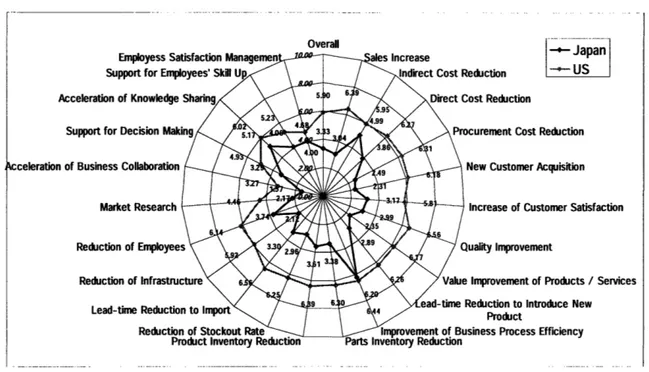
When we look at the comparative analysis of the degree of customer satisfaction from IT investment in the US and Japan, we can find the current problems of Japanese IT services. Figure 3.2-2 explains how much organizations recognize the effectiveness of IT investment. The effectiveness of IT investment is indexed based on the degree to which organizations are satisfied with IT investment. The result demonstrates that Japanese organizations are less satisfied with their IT investment than US organizations.
Others
C%. Improvement of Shareholders' Value
4_ Improvement of CSR
Electric Application to Control Authority
0Globalization
Lead-time Reduction to Introduce New Products Product / Service Revolution
Effective Responses to Legislative Change
Support to Create New Business Reinforcement of Compliance
Improvement of Flexibility Reinforcement of Inter-enterprise Relationship
-Support for Customer Analysis
Sales Support SImprovement of Profitability
Knowledge Management Promotion for Paperless/ness
Intra-communication Support Supply Chain Management
Improvement of Customer Services
Supprt for Management Data Analysis Support for Decision Making
. . Cost Reduction
Improvement of Business Process Efficiency r--- -~~~--- -~ ~ ~~~ '
Overall I
n-I
Source: "Research Report of IT Utilization for Corporate Management 2003," Ministry of Internal Affairs and Telecommunication 6
Figure 3.2-2 Customer Satisfaction from IT Investment
We can assume that satisfaction from IT can be calculated as follows.
Effectiveness of IT Investment =
Degree (or Appropriateness) of IT Introduction * Capability to use IT
If we look at detailed data, we find that the degree of IT introduction is not
always reflected in the effectiveness of IT investment. The Japanese organizations that do not recognize the effectiveness of IT, in spite of their advanced IT introduction, are more likely to exist than those of the United States (Figure 3.2-3,
Acce
Su
%cceleration of
teduction -- US
ost Reduction
curement Cost Reduction
New Customer Acquisition
Increase of Customer Satisfaction
uality Improvement
Improvement of Products / Services
Reduction to Introduce New
Product
siness Process Efficiency
Figure 3.2-4). In other words, even though organizations heavily invest in IT, they cannot gain enough return to correspond to their investment.
wiS to! 'I.l *0ll iil 40 US *0l !li 10 to so so 40 W 4460 Of to us46
IT introduction score-> n=1 193, correlation=0.2
The portion of the organizations that do not think the worth of their IT justifies their IT investment: 24.4%
Source: "Research Report of IT Utilization for Corporate Management 2003," Ministry of Internal Affairs and Telecommunication7
Figure 3.2-3 Correlation between IT investment and Effectiveness of IT (JP) &W
0 4= 3-m o LO 2A to oJcO
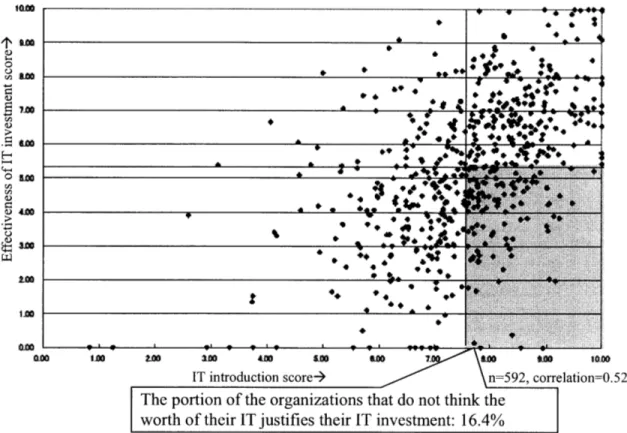
IT introduction score-- n=592, correlation=0.52
The portion of the organizations that do not think the worth of their IT justifies their IT investment: 16.4%
Source: "Research Report of IT Utilization for Corporate Management 2003", Ministry of Internal Affairs and Telecommunication8
Figure 3.2-4 Correlation between IT investment and Effectiveness of IT (US)
We could say that Japanese average organizations lack IT capability and appropriate IT investment. If we break down these two variables and see the detailed data in the same research report, we find three factors that show significant differences between US organizations and Japanese ones. I think these three factors influence IT capability and degree of appropriateness of IT investment.
* Periodical evaluation of the efficiency of IT investment by using a
Fewer Japanese organizations have their own quantitative measurement methodology for IT investment than US ones. In particular, they have not made serious efforts to tackle ex post evaluation. The lack of the methodology makes it difficult for the Japanese organizations to assess the appropriateness of their IT investment. Additionally, they cannot have the feedback from their past IT investment experiences because they neglect the evaluation of ROI after the development of the systems.
* Reinvestment in new or strategic business by using the funds the
organization gets from cost reduction using IT (US: 73.2%, Japan:
48.4%)1o
Even if a Japanese organization can successfully reduce its business operation cost by using IT, it cannot effectively reinvest this reduced cost in businesses that have the potential for future profit. I think one of the reasons is the burden of IT maintenance. While IT helps organizations to reduce business costs, it also requires a maintenance cost. Specifically, Japanese organizations prefer to customize applications, and they have not evaluated their IT assets. As a result, they have been obliged to spend much more money on IT maintenance than US organizations.
* The alignment between business process and IT (US: 64.9%, Japan: 41.8%)11
Though both US and Japanese top management get equally involved in IT strategy-planning, the alignment process between business and IT differs in these two countries. Japanese customers tend to prefer to adopt IT to an existing organization or current business process. As a consequence, they need to customize applications, and the opportunity to maximize business value from IT could be limited.
Given these observations, I find several critical issues for Japanese organizations. They need to strengthen IT governance and to develop a framework with which to evaluate IT assets. They also need to restructure the implementation process of IT for value optimization from the viewpoint of enterprise. These activities will also help them to shift from huge spending on maintenance to more strategic IT investment.
For Slers, using only cost reduction for project-based business is not enough to solve the current problems that customers are suffering from. It is essential for Slers to enhance consulting services that support customers' IT capability. For example, to generate more business value from IT, customers should learn the concept of Enterprise Architecture, which is the organizing logic for business process and IT infrastructure reflecting the integration and standardization requirements of the firm's operating model12, and adopt the IT architecture maturity model (Table 3.2-1) on their IT assets. Both IT consulting and business consulting services are necessary for customers to change their current IT systems to the architecture-based ones. The conventional project-based system integration services will not helpful for customers from this viewpoint.