Cell Squeezing: A Vector-Free Microfluidic Platform
for Intracellular Delivery of Macromolecules
ARcHNES
By
Armon R. Sharei
B.S. Chemical Engineering
Stanford University, 2008
MASSACHUSETT5 I~ifTUTEI OF TECHNOLOGYJUN
26
2013
LIBRARIES
SUBMITTED TO THE DEPARTMENT OF CHEMICAL ENGINEERING
IN PARTIAL
FULFILLMENT OF THE REQUIREMENTS FOR THE DEGREE OF
PHILOSOPHY DOCTORATE IN CHEMICAL ENGINEERING
AT THE
MASSACHUSETTS INSTITUTE OF TECHNOLOGY
JUNE 2013
Signature of Author:
7
I,
A
Department of Chemical EngineeringMay 20, 2013 Certified by:
Certified by:
Klavs F. Jensen Warren K. Lewis Professor of Chemical Engineering Professor of Materials Science and Engineering Thesis Supervisor
Robert S. Langer David H. Koch Institute Professor Thesis Supervisor Accepted by:
Patrick S. Doyle
Singapore Research Professor of Chemical Engineering Chairman, Committee for Graduate Students
.
Abstract
Intracellular delivery of material is a long-standing challenge for both therapeutic and research applications. Existing technologies rely on a variety of mechanisms to facilitate delivery. Vector-based methods, such as polymeric nanoparticles and liposomes, form complexes with the target material and subsequently facilitate its uptake by the cell of interest, often through endocytosis. Although effective in some applications, these methods have had difficulty translating to patient-derived primary cells, especially stem cells and immune cells. Moreover, these vectors are often limited in the range of target materials they can deliver and leave much material trapped in endocytotic vesicles.
Physical methods, such as electroporation and sonoporation, have been able to address some of the challenges with vector-based methods by providing a platform for physical disruption of the cell membrane. By eliminating the need for vector materials and circumventing the endocytotic pathway, these methods have shown an advantage in some applications, especially those involving primary cells that are recalcitrant to vector-based methods. However, both electroporation and sonoporation suffer from high cell toxicity and have had limited success in delivering materials such as proteins and nanomaterials. Electroporation in particular has been shown to damage certain target materials, such as quantum dots. Microinjection, an alternative method in which cells are punctured by a microneedle, can address a variety of target materials and cell types however its low throughput has hindered its adoption for most applications. There is thus a need for more effective intracellular delivery methods.
This dissertation describes a microfluidic approach to intracellular delivery that seeks to embody the advantages of a physical method, while mitigating issues related to toxicity and damage to the target material. In our method, the cells of interest are prepared in suspension with the target delivery material and flown through a parallel network of microfluidic channels. Each channel contains a constriction point where the cells are rapidly deformed, or squeezed, as they pass through. This process induces temporary disruption of the cell membrane thereby enabling diffusive transport of material from the surrounding buffer into the cell cytosol. These disruptions persist for less than 5min before membrane integrity is fully restored. This method has thus far been demonstrated in over 15 cell types and has been able to deliver a variety of functional materials including, DNA, RNA, proteins, quantum dots, carbon nanotubes, and small molecules. Our cell squeezing technology has further illustrated its enabling potential in a number of applications detailed herein.
Quantum dots are a promising alternative to organic fluorescent dyes due to their superior spectral properties and stability. These nanoparticles have much potential as imaging agents in
vitro and in vivo. Delivery of undamaged quantum dots to the cell cytoplasm has been a
challenge with existing techniques. Vector-based methods have resulted in aggregation and endosomal sequestration of quantum dots while electroporation can damage the semi-conducting particles and aggregate delivered dots in the cytosol. In our work, we demonstrated efficient cytosolic delivery of quantum dots without inducing aggregation, trapping material in endosomes, or significant loss of cell viability. Moreover, we have shown that individual quantum dots delivered by this approach are detectable in the cell cytosol, thus illustrating the potential of this technique for single molecule tracking studies. These results indicate that our
method could potentially be implemented as a robust platform for quantum dot based imaging in a variety of applications.
The reprogramming of somatic cells into induced pluripotent stem cells (iPSCs) has much potential in its ability to address existing challenges in regenerative medicine by providing a patient-specific source of pluripotent stem cells to generate new tissue. The mechanism of this reprogramming process, however, is still poorly understood and existing technologies suffer from chronically low reprogramming efficiencies (<4%). Moreover, many existing approaches to reprogramming rely on viral vectors to facilitate the delivery of the target transcription factors -these vectors are considered inappropriate for clinical applications due to safety concerns. Cytosolic delivery of protein transcription factors is a possible alternative to viral and plasmid-based reprogramming techniques. Direct protein delivery would negate the current safety concerns with viral and plasmid-based methods as it could not cause potentially tumorigenic changes in the genome. In our work, we implemented the cell squeezing technology as a method to deliver protein transcription factors to the cytosol of primary human fibroblasts. These studies yielded colonies of pluripotent stem cells that appeared to be fully functional. Moreover, the efficiency of this procedure was 10-100x higher than the current state-of-the-art protein reprogramming methods. The versatility of our delivery technology thus provides a promising platform for further study of the reprogramming process and the development of more efficient,
clinically applicable, reprogramming procedures.
Finally, the technology described herein has been implemented in cancer vaccine applications. Some recent immunotherapies against cancer have focused on the use of dendritic cells as antigen presenting cells. These cells are capable of presenting cancer antigens to other immune cell subsets and prompting a powerful immune response against the target cell type. A significant challenge for these therapies, however, is that current methods to induce antigen presentation in dendritic cells are often inefficient and can potentially induce a parallel regulatory response that reduces treatment efficacy. In our work, we have implemented the device as a platform for direct cytosolic delivery of the target antigen to dendritic cells. This approach could enable effective presentation of the target antigen while minimizing the development of a regulatory response. Our results indicate that this approach can produce effective antigen presentation in vitro, as measured by CD8 T cell coculture assays. Moreover, we have demonstrated effective antigen presentation in B cells, a more desirable clinical alternative to dendritic cells. These results thus illustrate the potential of this technology to be implemented as an enabling, patient-specific vaccination platform with minimal side-effects.
In summary, we have developed a robust, high-throughput approach to intracellular delivery. In the described technique, cytosolic delivery is facilitated by the temporary disruption of the cell membrane in response to rapid mechanical deformation of the cell in a microfluidic channel. This technology seeks to addresses some of the challenges of existing vector-based and physical poration methods, such as endocytosis, translation to primary cells, and cell toxicity. Our results in quantum dot, cell reprogramming, and cancer vaccine applications illustrate the strengths of this system. Although in its infancy, this technology has demonstrated the potential to enable a range of clinical and research applications. In the future, better understanding of the underlying mechanism and improvements to the system could produce substantial gains in performance and allow this technique to be widely adopted by researchers and clinicians.
I.
Acknowledgments
Thesis Committee
Prof. Klavs F. Jensen: For taking me on as a graduate student for a high risk project and giving
me the flexibility and independence needed to fully develop as a capable researcher. I also appreciate his continual support of the project during the various personnel, financial and research challenges.
Prof. Robert Langer: For taking me on as a graduate student and forming a collaboration with
Klavs centered around the described project. I also acknowledge Bob's mentoring support in selecting the appropriate research directions and, along with Klavs, teaching me how to steer a large project to completion.
Prof. Christopher Love: For his active guidance in numerous projects, particularly our
immunology work and circulating tumor cell work. He has also been very helpful in assisting my
job search, providing advice and enabling my future transition to an independent position. Prof. Dane Wittrup: For his active guidance in our immunology work and his continual
encouragement to take greater ownership of promising projects and push them to completion.
Undergraduates
The undergraduates that worked on this project as part of the MIT Undergraduate Research Opportunities Program (UROP) have been critical to our success and performed much of the important experimental work described herein.
Nahyun Cho: For her exceptional dedication to her projects and her contributions to the development of the platform, reprogramming studies, and cancer diagnostic studies.
Emily Jackson: For her dedication to her projects and her contributions to the development of the platform and understanding its underlying mechanisms.
Shirley Mao: For her exceptional dedication to her projects and her contributions to the development of the platform and application of the system to antigen presentation studies.
Roberta Poceviciute: For her dedication to her projects and her contributions to improving the
platform and understanding its underlying mechanisms.
George C. Hartoularos: For his dedication to his projects and his contributions to implementing the platform for adoptive transfer therapies.
Tanya Talkar: For her continuing commitment to the project and her budding contributions to
Key Collaborators:
Dr. Andrea Adamo: For introducing me to microfluidics and many of its basic
concepts/practices
Dr. Janeta Zoldan: For introducing me to cell biology and many of its basic concepts/practices
Dr. Jungmin Lee: For introducing me to quantum dots and the imaging techniques/concepts
surrounding them. I also acknowledge her exceptional contributions to our project on quantum dot delivery and being a great friend!
Pamela Basto: For introducing me to dendritic cells and basic immunology concepts. I also
acknowledge her early contributions to our dendritic cell antigen presentation project.
Dr. Siddharth Jhunjhunwala: For teaching me additional concepts in T cell and B cell
immunology as well as his continuing contributions to our adoptive transfer therapy projects.
Viktor Adelsteinsson: For teaching me much about circulating tumor cells, their role in cancer
metastisis and being a key contributor to our work in tagging and isolation of circulating tumor cells.
Additional Collaborators:
Dr. Woo Young Sim, Dr. Min-Joon Han, Sabine Schneider, Prof. Daniel Anderson, Prof. Kwang Soo Kim (Harvard), Dr. Abigail Lytton-Jean, Dr. Gregory Szeto, Dr. Trifanova, Prof. Judy Lieberman (Harvard), Prof. Darrel Irvine, Dr. Daniel A. Heller, Dr. Jeon Woong Kang, Prof. Moungi Bawendi, Narmin Tahirova
Family
Shariar Sharei, Yasmine Sharei, and Niku Sharei: My wonderful family who have been very
supportive throughout my time at MIT and who made all this possible!
Bridget Navarro: For her amazing kindness and support throughout my studies and being the
best girlfriend ever!
Table of Contents
. A bstract... 2
II. A cknow ledgm ents... 4
III. Table of Figures ... 9
IV . The Challenge of Intracellular D elivery ... 20
V . D elivery by Rapid M echanical D eform ation... 27
I. H ypothesis... 27
II. D esign... 27
D evice nom enclature ... 29
D efining delivery efficiency ... 29
D evice recovery ... 29
Reagent use... 31
III. G overning param eters ... 33
Project Outlook... 34
IV . Cytosolic delivery by diffusion... 35
M odeling D iffusion ... 40
Project Outlook... 42
V . Tw o-tiered delivery ... 42
Project Outlook... 44
V I. M em brane disruption m echanism ... 45
Project Outlook... 48
V II. Im aging of m em brane disruptions... 48
Project Outlook... 51
V III. A pplicability across cell types... 53
IX . Flexibility in addressing different delivery m aterial... 59
X . Sum m ary ... 60
X I. D evice design guidelines for new cell types ... 61
D esign Param eters:... 62
VI. Robust, High-Throughput Cytosolic Delivery of Quantum Dots... 65
I. Background ... 65
III. Single QD tracking in cell cytosol ... 80
IV . Sum m ary ... 81
VII. A Microfluidic Platform for Protein-based Reprogramming... 82
I. Background ... 82
II. Protein Delivery ... 84
III. Delivery to em bryonic stem cells... 86
Project Outlook... 88
IV . M ultiple deliveries... 90
V . Cell Reprogramm ing ... 93
VIII. Im proving antigen presentation for cancer vaccination ... 100
I. Introduction... 100
II. Tum or lysate as a source of target antigens ... 101
III. B cells as antigen presenting cells... 104
IV . M HC class I antigen presentation and DC m aturation... 106
V . M HC class II antigen presentation... 114
Project outlook... 115
VI. Translation to B cells... 116
VII. Antigen presentation from cell lysate... 119
VIII. Sum m ary... 120
IX . Future Directions ... 121
I. Device platform ... 121
II. Quantum Dot delivery... 123
III. Cell reprogramm ing ... 124
IV . Cancer vaccines... 126
X . APPEN DIX ... 130
I. Device m anufacture, operation and cell assays ... 130
Operating Procedure ... 130
II. Device fabrication and m ounting system ... 133
III. M easuring delivery... 134
Cell culture ... 134
Transm ission electron m icroscopy ... 134
Antibody labeling of im m une cells ... 135
Reprogram m ing factor purification by FLAG... 135
W estern blotting ... 135
Transcription factor delivery studies ... 135
Staining of colonies ... 136
Ram an Spectroscopy ... 136
Flow cytom etry ... 136
IV . Synthesizing quantum dots ... 137
M aterials ... 137
Instrum entation...
137
QD synthesis... 137
Synthesis of organic QD ligand... 139
Typical PIL synthesis ... 140
V . QD analysis ... 143
Delivery procedure for QDs ... 143
Cell culture ... 144
Confocal m icroscopy ... 144
Epifluorescence m icroscopy ... 144
Flow cytom etry ... 144
VI. Procedure for cell reprogramm ing experim ents... 145
VII. Cancer vaccine protocols ... 145
Cell lysis protocol... 145
Buffers ... 146
M ice ... 14 7 BM DC Harvesting Protocol: ... 148
T cell Purification...150
BM DC Purification...152
Splenic DC purification protocol... 153
IIl. Table of Figures
Figure 1. Delivery mechanism and system design. a) Illustration of delivery hypothesis
whereby the rapid deformation of a cell, as it passes through a microfluidic constriction,
generates transient membrane holes. Includes an electron micrograph of current parallel channel design with blue cells as an illustration. b) Image of a finished device consisting of Pyrex bound to silicon for sealing. Scale bar at 2mm. c) Illustration of the delivery procedure where cells and delivery material are mixed in the inlet reservoir, run through the chip, and collected in the outlet reservoir. The mounting system consists of stainless steel and aluminum parts interfaced to the chip by inert O-rings. Scale bar is 10m m . ... 28 Figure 2. Device layout. This graphic depicts the design of the latest generation of 'iS' devices.
These devices are symmetrical and have been designed to ensure uniform flow velocities across the ~70 parallel channels. ... 30 Figure 3. Schematic of the pressure system used to interface with the devices. Most of these
components, except for the plastic holders were available off the shelf. ... 31 Figure 4. Defining delivery. a) Definition of constriction dimensions illustrated in an SEM
image. b-c) Definition of delivery efficiency. b) Sample fluorescence intensity histogram (from flow cytometry) of a control/endocytosis HeLa cell population that is exposed to cascade blue conjugated 3kDa dextran and c) one that is treated by a 30um-6um device. d) Treatment of HeLa cells by the device alone (i.e. in the absence of dyes) did not lead to a significant change in fluorescence relative to the endocytosis case; hence the endocytosis control was selected for gating purposes. We chose the 1 Oum-6umx5 devices since these generally yielded the highest delivery efficiencies in H eLa cells... 32 Figure 5. Autofluorescence in immune cells. Autofluorescence histograms for cells treated by a
30um-5umx5 device in the absence of pacific blue or fluorescein dyes. These data demonstrate that there is no significant change in auto fluorescence in these channels due to device treatment. Note that the macrophages were stained with a FITC tagged antibody to CD1 b... 33 Figure 6. Delivery performance depends on cell speed and constriction design. Constriction dimensions are denoted by numbers (e.g. 1 Oum-6umx5) such that the first number corresponds to constriction length, the second to constriction width and the third (if present) to the number of constrictions in series per channel. a) Delivery efficiency and b) cell viability 18 hours post treatment as a function of cell speed for 40um-6um (o), 20um-6um (i:) and 1 Oum-6umx5 (A) device designs. Efficiencies and viabilities were measured by flow cytometry after propidium iodide staining. All data points were run in triplicate and error bars represent two standard
d ev iatio n s. ... 3 4
Figure 7. Multiple delivery cycles. Delivery efficiency (3kDa dextran) and viability of HeLa
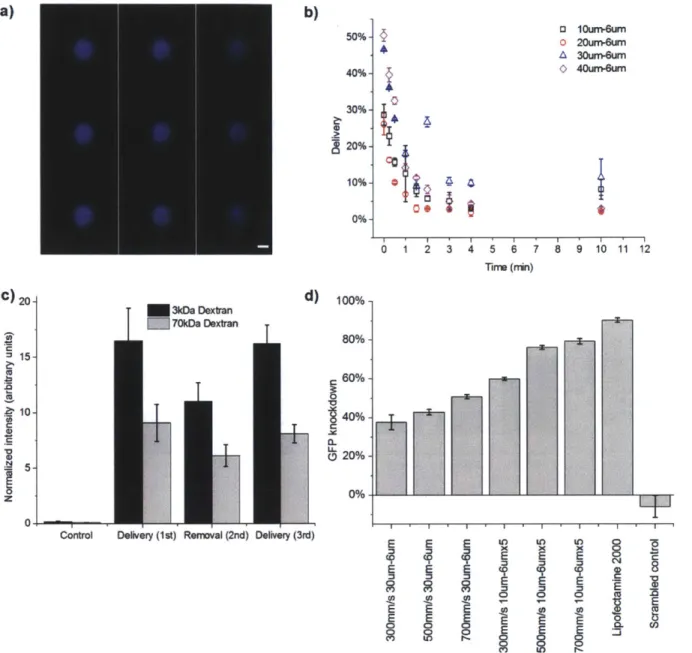
cells in response to multiple treatment cycles (within 1 min of each other) through a 10um-6um device. Note that results from multiple delivery cycles are not analogous to treatment by a single chip containing the equivalent number of constrictions in series (Figure 6)... 35 Figure 8. Diffusive delivery mechanism. a) Scans of different horizontal planes of a HeLa cell
microscopy. Note that 3kDa dextran is small enough to enter the nuclear envelope(44). Scans read from top to bottom, then left to right where the top left is at z=6.98um and bottom right is at z=-6.7um. Scale bar represents 6um. b) Live cell delivery efficiency of 10um-6um (i), 20um-6um (o), 30um-6um (A), and 40um-6um (0) devices. The time axis indicates the amount of time elapsed from initial treatment of cells before they were exposed to the target delivery solution.
All results were measured by flow cytometry 18 hours post-treatment. c) Average intensity of
the delivered cell population normalized by untreated cells to control for auto-fluorescence. Fluorescein conjugated 70kDa dextran and cascade blue conjugated 3kDa dextran are delivered to the cell (cycles 1 and 3) and removed from the cell (cycle 2) in consecutive treatment cycles. The control represents cells that were only exposed to the delivery solution and not treated by the device. d) Gene knockdown, as a function of device type and cell speed, in live destabilized GFP expressing HeLa cells 18 hours after the delivery of anti-eGFP siRNA at a delivery concentration of 5uM. Lipofectamine 2000 was used as a positive control and scrambled controls were run at 500mm/s on a 1Oum-6umx5. All data points were run in triplicate and error bars represent two standard deviation s... 37 Figure 9. Additional validation of mechanism. a) Effect of device width on delivery
efficiency. Flow cytometry data of the delivery efficiency of 1 OkDa fluorescein labeled dextran, delivered at 150mm/s, using 10um-6um, 30um-6um or 30um-8um devices. b) Delivery
performance at 20'C vs. 4'C. Cascade blue labeled 3kDa dextran and fluorescein labeled 70kDa dextran were delivered to HeLa cells at 4'C or at room temperature (20'C). For the 4'C
condition, cells and the device were kept on a cold plate (set at 4'C) for 5min prior to delivery, the delivery procedure was conducted on the plate, and the collected cells were subsequently incubated for 5min on ice before being seeded onto a cell culture plate and incubated at 37'C. The room temperature samples were kept at room temperature for all steps of the procedure prior to being seeded onto a cell culture plate and incubated at 37'C. The resulting live cell delivery efficiencies, measured by flow cytometry 18 hours post-delivery, indicate no major differences in delivery performance for either target molecule. These results would indicate that material uptake is not an active process as most active endocytotic processes are arrested or severely diminished at 4'C. c) Knockdown specificity. Gene knockdown due to anti-eGFP siRNA and scrambled controls delivered to HeLa cells expressing destabilized GFP. The 1 Oum-6umx5 device was operated at a cell speed of 500mm/s, Lipofectamine 2000 was used as a positive control, and the results were measured at 18 hours post-treatment. Control cells were only exposed to the delivery solution but not treated by the device. The ~30% knock-up in gene expression in the Lipofectamine 2000 scrambled control is an artifact that we have observed in studies involving destabilized-GFP expressing HeLa cells. Rounded cell morphology due to treatment by Lipofectamine 2000 would indicate that treatment with these particles is causing significant amounts of cell stress, which could contribute to the observed GFP up regulation. Although this problem could potentially be removed with further optimization of Lipofectamine treatments, it is likely a consequence of using a toxic agent(45) in the sensitive destabilized-GFP assay. Experiments with eGFP expressing HeLa cells showed consistent knockdown after
treatment by the device and had less pronounced artifacts (~ 10% knock-up) in Lipofectamine
2 0 0 0 co n tro ls... 3 8
Figure 10. Dosage response. Increasing buffer concentrations of 70kDa dextran yield higher
delivery without causing a change in the baseline endocytosis rate (0 psi). Note that one of the data points at Opsi corresponds to the untreated control ... 40
Figure 11. Simulation of diffusive delivery. a) Simulation results indicating the percentage of
material delivered/lost from the cell as a function of membrane diffusivity when the material of interest is in the buffer (o) or in the cell (o) at the time of poration. b) Graphical representation of the simulated system and the concentration gradient that forms across the membrane if
material is delivered from the buffer (red area) to the cell (blue area)... 41
Figure 12. Two-tiered delivery of material. a) Live cell delivery efficiency, as a function of
speed, for HeLa cells treated with Pacific Blue conjugated 3kDa (0), fluorescein conjugated 70kDa (o) and 2MDa (A) dextran. This experiment was conducted with a 1 Oum-6umx5 chip. All data points were run in triplicate and error bars represent two standard deviations. b,c) Histogram overlays of flow cytometry data for HeLa cells that are untreated (red), treated at 700mm/s (green), treated at 500mm/s(orange), treated at 300mm/s (light blue), or only exposed to the delivery material(control, dark blue). The delivery material consisted of b) pacific blue
conjugated 3kDa dextran and c) fluorescein conjugated 70kDa dextran. ... 44
Figure 13. Delivery of plasmids by rapid mechanical deformation. EGFP encoding plasmids (5kbp) (Aldevron) were labeled with a fluorescein tag (Mirus) and delivered to HeLa cells using
a 30um-6um device at 30psi (uncertain about exact operating pressure). These data indicate an estimated 15% cytosolic delivery efficiency to live cells relative to controls. In separate,
unlabeled plasmid delivery experiments we did not observe any GFP expression, indicating that the DNA may not have entered the nucleus. Note that these data were obtained using early
versions of the device and therefore are probably not representative of the latest generation of iS chips when operated at high pressures... 45
Figure 14. Test parameters for determining membrane disruption mechanism. This figure
illustrates the 4 criteria that were used to evaluate the relevance of candidate delivery parameters. Length (L), width/diameter (D), and driving pressure (Pinlet) have been addressed previously. Changes in constriction design were also tested, the pinhole approach in design B yielded similar performance to design A at 1/1 0th the operating pressure. ... 47
Figure 15. SEM images of fixed cells at different time points post-treatment. HeLa cells
were fixed with a glutaraldehyde solution after treatment by the device in accordance with previously reported methods (47). The fixation involved addition of 100 ul of an aqueous
solution of glutaraldehyde (initial concentration: 25% v/v) to 500 Al of the cell suspension 5 and
10 s after initiation of the US exposure (which lasted a total of 10 s). The cells were washed with
PBS, re-suspended in 2 ml of glutaraldehyde solution (5% v/v), and kept for 10 min at room temperature in a microcentrifuge tube. The cells were then washed successively in ethanol solutions containing, respectively, 30%, 50%, 70%, 95%, 100% and 100% v/v of alcohol in water. Cells were kept in each solution for about 20 min and the ethanol solution was removed
by mild centrifugation for 5 s. Finally, 15 ul of the cell suspension was mounted on metal grids
and left at room temperature overnight prior to gold coating by the imaging core staff. The contrast in morphology between treated and untreated cells was observed consistently across at least 2 independent experim ents ... 50
Figure 16. TEM images of cells fixed <1s after treatment with gold nanoparticles. Left)
Arrows indicate possible membrane disruptions ~50nm in diameter. Right) Brackets indicates possible membrane disruption ~500nm in diameter. These images were obtained as part of the experiments involving gold nanoparticle delivery (Figure 21). Images a) and b) are from one experimental set and c) and d) from a second independent one. The scale bars are at 1 00nm (c-d) and 500nm (a-b). To prepare cells for imaging, cells were fixed in 2.5% (w/v) glutaraldehyde,
3% (w/v) paraformaldehyde, and 5.0% (w/v) sucrose in 0.1M sodium cacodylate buffer (pH 7.4). After an overnight fixation, the cells were post-fixed in 1% (w/v) OsO4 in veronal-acetate buffer for 1 h. They were then stained en bloc overnight with 0.5% uranyl acetate in veronal-acetate buffer (pH 6.0), dehydrated, and embedded in Spurr's resin. Sections were cut on a Reichert Ultracut E (Leica) at a thickness of 70 nm with a diamond knife. Sections were examined with an EM 410 electron m icroscope (Phillips). ... 52 Figure 17. Applicability across cell types. a) Delivery efficiency and viability of NuFF cells
treated with a 30um-6um device to deliver 3kDa and 70kDa dextran. b) Delivery efficiency and viability of spleen isolated, murine dendritic cells treated with a 1 Oum-4um device to deliver 3kDa and 70kDa dextran. c) Delivery efficiency and viability of murine embryonic stem cells treated with a 1 Oum-6um device to deliver 3kDa and 70kDa dextran. d) Delivery efficiency of 3kDa and e) 70kDa dextran to B-cells (CD 19+), T-cells (TCR-B) and Macrophages (CD1 1b+) isolated from whole mouse blood by centrifugation and treated by 30um-5um and 30um-5umx5 devices at 1 000mm/s. 3kDa and 70kDa dextran were labeled with cascade blue and fluorescein respectively. All data points were run in triplicate and error bars represent two standard
d ev iatio n s. ... 54
Figure 18. Morphology and gene expression of mESCs following treatment by rapid
mechanical deformation. a) Images of control cells that did not flow though the device. b) Cells
that were treated by a 30um-6um device once, c) twice, or d) three times in succession. e) PCR gene expression profile of POU5 and ALP for cells treated by rapid mechanical deformation. Typically these genes would be down regulated significantly (usually >5x) in
differentiating/differentiated cells(49). Data is normalized by the expression levels of untreated cells. Single mESCs were able to form colonies within 24 hours after treatment and exhibited normal undifferentiated mESC colony structure throughout a two week follow-up. Scale bar at 2 0 0u m . ... 5 5
Figure 19. Fluorescence intensity histograms for immune cells treated by a 30um-5umx5 or
30um-5um device to deliver cascade blue labeled 3kDa dextran and fluorescein labeled 70kDa dextran. These histograms correspond to the data presented in Figure 17. ... 56 Figure 20. Delivery and viability data for separated immune cells. Murine T cells and B cells
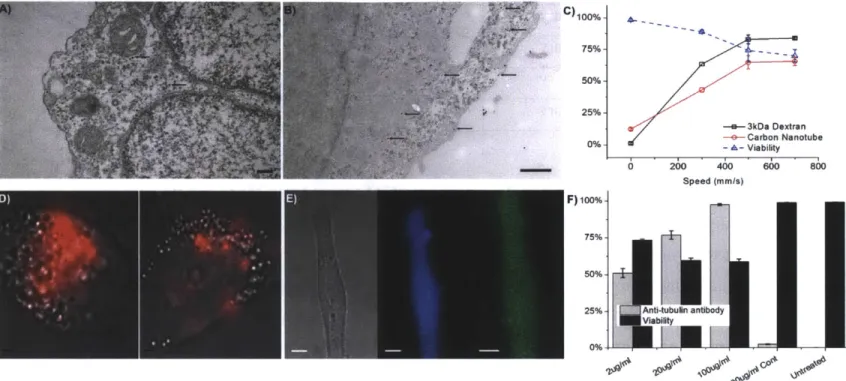
were isolated from the peritoneal cavity and antibody stained for CD 11b during analysis. All cells were treated by a 30um-5umx5 device at 1.2m/s. Delivery efficiency of fluorescein labeled 70kDa dextran, cascade blue labeled 3kDa dextran and cell viability (as measured and propidium iodide staining) were measured by flow cytometry 2 hours after delivery... 57 Figure 21. Nanomaterial and antibody delivery. a, b) TEM images of gold nanoparticles
(some indicated by arrows) in cells fixed ~1s after treatment by a 1 Oum-6umx5 device. Scale bars at 500nm. c) Delivery efficiency and viability of HeLa cells treated with a 10um-6umx5 device to deliver cascade blue labeled 3kDa dextran and Cy5 labeled, DNA wrapped, carbon nanotubes. d) Bright-field cell images overlaid with Raman scattering in the G-band (red) to indicate delivery of carbon nanotubes in treated cells (left) vs. endocytosis (right). Scale bars at 2um. e) Fluorescent micrograph of a HeLa cell 18h after delivery of cascade blue labeled 3kDa dextran (middle panel) and antibodies to tubulin with an Alexa Fluor 488 tag (right panel). Scale bars at 3um. f) Delivery efficiency and viability of HeLa cells treated with a 10um-6umx5 device, at 500mm/s, to deliver Alexa Fluor 488 labeled anti-tubulin antibodies. Delivery
efficiency at different antibody concentrations is compared to an endocytosis control at 100ug/ml an d untreated cells... 60 Figure 22. COMSOL multiphysics simulations of fluid flow in the 'iS' and 'I' design
schemes. The earlier 'I' designs were found to have a 2-3x variability in flow speed across cell
channels. The newer 'iS' design provides a longer entry region for the flow profile to fully form before it is split into smaller channels. In this design, flow speeds across channels were within
20-30% of each other... 64
Figure 23. a) Hypothesized method of entry for nanoparticles. Images not to scale. (b) Overlay
of transmission and confocal fluorescence images, followed by z-section confocal fluorescence images of treated cells delivered with QDs. Top, immediately after treatment and bottom, after 48 h incubation at 37 'C and 5% CO2. The diffuse staining pattern is constrained to the
cytoplasm and the nanoparticles appear not to enter the nucleus (dark region within the cell). S cale b ar is 10 p m ... 6 7 Figure 24. Delivery efficiency and viability after device treatment. a) Viability of HeLa cells
upon delivery of plain QD535 by the device, as measured by propidium iodide staining and flow cytometry. b) Far-field view of plain QD535 treated HeLa cells showing increase in cell density from 0 h to 48 h after treatment, demonstrating cell proliferation. c) Delivery efficiency into HeLa cell cytosol upon device treatment with QDs coated with PIL... 68 Figure 25. Construct design, absorbance, and stability in various media. (a) A schematic of
the free poly-imidazole ligand (PIL) prior to conjugation with the dye and coating the QDs (left), and of the resulting QD-disulfide-Rox construct (right) (image not to scale). (b) The absorbance spectrum of the QD-disulfide-dye construct. Excitation at 488 nm and at 405 nm provided exclusive absorption by the QDs throughout the experiment. (c) The stability of fluorescence energy transfer from QD to Rox for the construct in full culture media at 37 'C and 5% CO2,
demonstrating that the disulfide bond is not cleaved in the extracellular environment. (d)
of QD fluorescence. (e) Recovery of QD fluorescence upon treatment by the non-thiol reductant tris (2-carboxyethyl) phosphine, further supporting the cleavage of the disulfide bond... 70
Figure 26. Live cell confocal microscopy images and fluorescence intensity analysis
demonstrating cytoplasmic staining and chemical accessibility of QD surface. (a) Images of
treated cells (top) and control cells (bottom). The appearance of diffuse green fluorescence is present only in treated cells. Scale bar is 10 pm. (b) Change in intensity as a function of time in the green and red channels. Because n<20 at each time point, fluctuations in total average
fluorescence were corrected by normalizing to the 0 h time point. ... 73 Figure 27. a) Example QD and Rox channel confocal overlay images in the of cells that were
incubated, but not delivered, with QD-S-S-Rox (top) and autofluorescence from cells that were completely untreated (bottom). b) line graph of average absolute QD and Rox intensities in these cells. Scale bars are 10 pm ... 75 Figure 28. Flow cytometry measurements of average cell fluorescence and viability. a)
Average fluorescence of QD (top) and Rox (bottom) per cell, showing an increase in QD fluorescence only in treated cells. Rox fluorescence in both treated and control cells is at autofluorescence levels by the 24 h time point. b) Histogram of the distribution of fluorescence intensities among treated and control cells at select time points, in the QD channel (left) and Rox channel (right). QD delivery is estimated to have occurred in at least 35% of the cell population. Grey areas are meant to guide the eye in the movement of fluorescence intensity histogram peaks. c) Viability of control and treated cells as measured by propidium iodide. ... 76
Figure 29. QDs are delivered into HeLa cells at 4 *C, when biological processes are
arrested. Control group was incubated in PBS, and indicate autofluorescence levels. Inlet groups
were allowed to sit inside the microfluidic device but were not flown through the channels. (a) Delivery efficiency of QD540 QD fluorescence measured by flow cytometry, and (b) viability of treated, control, and inlet group cells. In these figures, the first number indicates the temperature at which delivery was performed and the second indicates the temperature at which the cells were allowed to recover for 5minutes prior to washing the QDs. ... 77 Figure 30. Delivery efficiency measured at 5uM, luM, 500nM and 100nM QD
concentrations during HeLa cell treatment with the microfluidic device. Inlet groups were
allowed to sit inside the microfluidic device but were not flown through the channels. Note that delivery concentrations as low as 1 OnM were detectable by microscopy. ... 78 Figure 31. Reproducibility of cytoplasmic delivery as shown by flow cytometry
measurements of two independent delivery experiments with the QD-S-S-Rox
nanoparticles. Average fluorescence of QD (a) and Rox (b) per cell, showing an increase in QD
fluorescence only in treated cells. Rox fluorescence in both treated and control cells is at
autofluorescence levels by the 24 h time point... 79 Figure 32. Epifluorescence imaging of unaggregated single QDs within the cell cytosol after
device treatment with a 10 nM QD solution (top), and blinking traces of the three QDs labeled A,
B, and C (bottom, green lines) with autofluorescence (bottom, grey lines). QD blinking traces
Figure 33. Protein delivery by cell squeezing. FACS data from HeLa cells 24hrs after
simultaneous delivery of FD and FITC labeled BSA A) at 300mm/s, B) Omm/s control. Each color coded quadrant differentiates between no delivery, 3kDa dextran delivery, 66kDa BSA delivery, or both C) FACS data from the same experiment as A &B demonstrating delivery and viability trends relative to cell speed. D) Detection of ApoE in HeLa cell lysate 24hrs after
delivery of the non-native protein... 85
Figure 34. New born foreskin fibroblasts (NuFF) cells treated by a 30um-6um device in the presence of 3kDa and 70kDa dextrans labeled with cascade blue and fluorescein
respectively. These data were measured by flow cytometry 18 hours after delivery and cell
viability was determined by propidium iodide staining... 86
Figure 35. Microfluidic delivery of fluorescently labeled dextran to mESCs. A) Quantitative
analysis of dextran delivery to mESCs as measured by FACS. B) Fluorescent micrograph and bright field image (C) of mESCs following fluorescein labeled 1 OkDa dextran delivery (50ptm scale bar). ...---.--... . ---... 87
Figure 36. Delivery to human embryonic stem cells. Preliminary experiments with three
different device designs, 1Oum-6um, 3Oum-6um and 1Oum-5um yielded up to (a) 50% delivery of 70kDa fluorescein labeled dextran. b) The viability of these treated cells remained above 50%
as measured by propidium iodide staining and flow cytometry. These results were measured on the same day, immediately after delivery was complete. ... 89
Figure 37. GFP knockdown in human embryonic stem cells. GFP expressing human
embryonic stem cells were treated with the listed device designs at 30 psi in the presence of 5uM of anti-GFP siRNA (Ambion). The scrambled siRNA control experiments were run at the same concentration. Error bars represent 2 standard deviations within the experimental replicates. GFP knockdown was measured 48 hours post-treatment and non-viable cells were excluded by
propidium iodide staining. ... .- -... 90
Figure 38. Cell response to multiple delivery treatments. In this experiment, HeLa cells were
treated by a 30um-6um device at 50psi over a period of 2 days. On the first day they were treated with fluorescein labeled 3kDa dextran and on the second day they were treated with cascade blue labeled 3kDa dextran. Results were measured on the second day, immediately after delivery, and dead cells were excluded based on propidium iodide staining. The quadrants were drawn based on endocytosis controls to indicate the delivery of each dye to the treated cells. ... 91
Figure 39. Relative delivery efficiency of cells between the first and second treatment. These
data were obtained from experiments on HeLa cells using both 1Oum-6um and 3Oum-6um devices as described in Figure 38. The blue bar illustrates the percentage of total cells that received the 3kDa cascade blue dye on day 2 and the green bar illustrates the percentage of
successfully treated cells from day 1 (i.e. those that received 3kDa fluorescein) that also
received the cascade blue dextran on day 2. The similar delivery efficiency values would indicate that cells successfully treated on day 1 were not any more or less likely to uptake material on day
Figure 40. Dextran efflux from treated cells. By comparing the fluorescein only population to
the fluorescein + cascade blue population in Figure 38, one can measure the efflux of fluorescein labeled dextran. This graph represents the reduction in mean fluorescence intensity of the
cascade blue +fluorescein population relative to the fluorescein only population. The net reduction indicates loss of fluorescein labeled dextran as a result of the second membrane
disruption event on day 2... 93 Figure 41. Altering cell morphology and gene expression by cytosolic delivery of
transcription factors. a) A western blot analysis of c-Myc, Klf4, Oct4 and Sox2 delivery to
NuFF cells by cell penetrating peptides versus a 1 Oum-6um device. Each of the four proteins has an additional 9 arginine (9R) groups to facilitate uptake. The lysate (Ly) columns correspond to the protein content of cells that are washed and lysed while the media columns correspond to the protein content of the media environment. b) Confocal microscopy images of NuFF cells fixed after delivery of the reprogramming factors. The proteins are tagged using an Alexa 488 conjugated anti-FLAG antibody and the nucleus is stained by DAPI. Scale bat at 15um. c) A progression of morphological changes from fibroblasts into colonies. White arrows indicate potentially transformed cells. The red arrow points towards coalescing cells forming a colony.
d-g) Expression of the human embryonic stem cell marker Oct4, SSEA-4, Tra-1-60 and Tra-1-81
in transformed colonies. Where appropriate, the small box represents a DAPI counter stain. Scale b ars at 100u m ... 9 5 Figure 42. Fluorescent micrographs of fixed cells treated after treatment by the device (top) or by CPPs only (bottom). The cell nucleus was stained with DAPI while an anti-FLAG Alexa 488 antibody was used to tag the target transcription factors. The punctate staining in the CPP
case indicates endocytotic trapping of much of the delivery material... 96 Figure 43. Image of a reprogrammed colony (right) as compared to a human embryonic stem cell. The morphology of the reprogrammed colonies is similar to the embryonic cells. Note
that the elongated cell morphology visible in the periphery is that of untransformed fibroblasts.97
Figure 44. Reprogramming efficiency and colony pluripotency. a) The average number of
colonies present in a sample plate after the delivery cycles have been completed. Averages and standard deviations were calculated based on data from 2 independent experiments, each run in duplicate. b) Alkaline Phosphatase (AP) staining of a colony transformed by the device(49). c) Induction of differentiation was achieved by growing the iPS-like cells in suspension as
previously described(89). Briefly, iPS-like colonies were enzymatically dissociated form feeder layers and transferred to low adhesion petri dishes. Subsequently, the resulting embryoid bodies (EB) were incubated in EB media (KO- DMEM (Gibco) with 20% knockout serum (Gibco), 1mM L-glutamine (Gibco), 0.1mM
P-mercaptoethanol,
and 1% NEAA (Gibco)) at 37'C. After 8 days, EBs were seeded on gelatin-covered chamber slides (Lab-Tek) and incubated for additional10 days in EB media. IPS-like generation and cell differentiation were assessed by fluorescent
immunohistochemical staining according to suggested protocols for cell reprogramming
(Stemgent). All cells were fixed with 4% paraformaldehyde, permeablized with 0.1% Triton-X and visualized with a Zeiss Axiovert 200 fluorescent microscope after staining. IPS-like EBs
were incubated with primary antibodies recognizing early human mesoderm marker brachyury
(1:50; Santa Cruz Biotechnology), definitive endodermal marker Sox17 (1:50; R&D Systems),
and Pax6 (1:100; Abcam) as markers for neuroectodermal cells. Nuclei were stained with 4',6-diamidino-2-phenylindole (DAPI). Bound primary antibodies were detected by FITC-labeled secondary antibody SC-2010 IgG-FITC (1:200; Santa Cruz Biotechnology)... 98
Figure 45. Antigen presentation pathways(102). An illustration of the MHC class I and MHC
class II antigen presentation pathways. MHC class I antigens are sourced from the proteasome mediated degradation of endogenous antigen particles while MHC class II antigens are sourced from exogenous antigens that have been endocytosed. Cross-presentation of endocytosed
antigens can occur in certain subsets of dendritic cells however the mechanism of this pathway is not well understood and the process is inefficient... 103
Figure 46. Delivery of fluorescein labeled ovalbumin to splenic dendritic cells derived from the spleen of C57BL/6 mice. 3kDa, cascade blue dextran was co-delivered to the cells and
propidium iodide staining was used to differentiate viable cells by flow cytometry. ... 104
Figure 47. Developing physical delivery methods as a cellular vaccine platform. First, a
mixture of target and self-proteins (probably obtained from a biopsy) are delivered to an APC (e.g. a dendritic cell) by physical poration. The activated APC will then process and present fragments of these proteins on its MHC-I receptors, thereby activating any CD8 T cells that recognize the various fragments. Innate processes that regulate/eliminate self-recognizing T cells will help mitigate any potential auto-immune side-effects. Activated T cells will begin
proliferation and cytokine secretion, thus driving a cytotoxic response against any diseased cells that express the target proteins... 106
Figure 48. Assessing antigen presentation and DC maturation. This figure provides a
schematic of the delivery materials used in our proof-of-concept experiments as well as the surface receptors that were probed by antibody staining. Ovalbumin was delivered as a model antigen to measure the MHC-I presentation of SIINFEKL by antibody staining (Bio Legend). 70kDa, fluorescein labeled dextran was used as a tracer to measure delivery performance. Upregulation of CD80 and CD86 was used to measure DC maturation in response to the device and known m aturation stim uli (such as LPS). ... 107
Figure 49. Antigen presentation in splenic DCs. An antibody to MHC Class I bound to SIINFEKL was used to measure antigen presentation in splenic DCs. Dead cells were excluded by propidium iodide staining... 108
Figure 50. Antigen presentation in bone marrow DCs. An antibody to MHC Class I bound to SIINFEKL was used to measure antigen presentation in bone marrow DCs. Dead cells were
excluded by propidium iodide staining... 109
Figure 51. MHC class I antigen presentation correlates with dextran delivery. a) Measures
the change in intensity on the FITC channel in response to delivery of 70kDa fluorescein dextran and ovalbumin to BMDCs. b) Measures the corresponding expression of SIINFEKL loaded MHC class I molecules as measured by antibody staining. FITC-A+ and FITC-A- denote the fluorescein positive and fluorescein negative populations respectively. These results were
obtained with a 30um-6um chip, cells were matured with LPS post-delivery, and dead cells were excluded by propidium iodide staining... 110 Figure 52. Antigen presentation kinetics. Presentation of SIINFEKL on MHC class I at 3hrs
(a), 20hrs (b), and 45hrs (c) after ovalbumin delivery. Results were measured by antibody
staining and dead cells were excluded by propidium iodide staining... 111
Figure 53. Splenic DC maturation in response to LPS stimulation. Spleen-derived DCs were
incubated for 3 hours at 370C after having undergone the listed treatments. The '4C' case was
kept on ice for 3 hours instead of incubation at 370C to suppress all active processes. These data
indicate that device treated cells have similar maturation levels to their untreated counterparts after a 3 hour incubation in LPS. The 'Endocytosis' case, which was not treated with LPS, would
suggest that the DC purification process alone may trigger a maturation process as those cells have significant upregulation of CD80 and CD86 relative to the iced control. Results were measured by antibody staining for CD80 and CD86 and dead cells were excluded by propidium iodid e staining ... 112
Figure 54. Activation of antigen-specific T cells in response to treated dendritic cells. a)
Bone marrow derived DCs were treated by the device in the presence of varying OVA
concentrations and cultured in the presence of CFSE stained, CD8' T cells derived from OT- 1 mice. After 5 days of culture, T cell proliferation was measured by flow cytometry. The dilution of the CFSE stain, as reflected by reduced intensity in the FITC channel, and increased cell counts indicate T cell proliferation across multiple generations. b) Secretion of the
immunostimulatory cytokine IFN-y, as measured by ELISA analysis of culture supernatant, from
CD8* T cells incubated in the presence of treated DCs. The 'OVA' conditions correspond to
cases where the cells were treated by the device, while the 'OVA Endo' condition corresponds to an endocytosis only case. Treatment of DCs by the device in the absence of OVA did not induce proliferation or cytokine secretion. Where applicable, error bars represent +1 standard deviation obtained from triplicate experim ents... 114
Figure 55. The device does not interfere with activation of CD4 T cells through MHC class II antigen presentation. Antigen specific CD4' T cells were obtained from OT-II transgenic
mice and co-cultured with device treated BMDCs. These mice contain a TCR on their CD4 T cells that is specific for an OVA epitope (different from SIINFEKL). Proliferation results were measured by CFSE staining and flow cytometry on day 5 of co-culture. These results indicate that the device and endocytosis (inlet) cases behave similarly, while the no OVA (where the cells are treated in the absence of protein) and NC (untreated or 'no contact') cases show no non-specific proliferation. These results held true whether or not LPS, a maturation inducing
polysaccharide, was present. The numbers (e.g. 50:30) correspond to the ratio of cell solution to delivery solution. The delivery solution was 0.5mg/ml OVA protein in PBS. ... 116
Figure 56. Proliferation results from CFSE tagged OT-I transgenic CD8 T cells co-cultured with OVA treated B cells. Treated B cells were cultured in the presence of CpG
oligonucleotides and treated with 10-4i or 30-5x5i device types. The Siin, NC and Inlet
Figure 57. Cytokine secretion of B cell activated T cells. These graphs represent the levels of
TNF-a and IFN-y present in the co-culture media 3 days after the start of incubation. In these experiments, naive B cells were treated by different device designs in the presence of 0. 1mg/ml of OVA protein. The bottom labels, such as 'CpG A', denote the type of stimulant that the B cells and T cells were cultured in after treatment. The '+stim' cases indicate that the cells were treated by the device in the presence of the listed stimulant. These data were obtained using a Lum inex bead assay to measure cytokine secretion. ... 118 Figure 58. Proliferation results from CFSE tagged OT-I transgenic CD8 T cells co-cultured with B16-OVA lysate treated DCs. The ratios, such as '50:10', indicate the volume of cell
suspension relative to the volume of cell lysate solution. Note the endocytosis and untreated controls do not have any observable peaks as the T cells died due to lack of stimulation in those co n d itio n s... 1 19 Figure 59. Combining cell squeezing and electroporation. A bright field micrograph of early
work (106) that could be modified to combine a constriction-based design with electrodes to enhance delivery efficacy. (scale bar 30tm ) ... 123 Figure 60. Ex vivo therapeutic concepts that implement this technology for immunotherapy or regenerative medicine applications. In both applications, the desired cells are isolated from
the patient, treated by the device to deliver therapeutic agents or reprogramming factors, and re-im planted to treat the target area... 123
IV. The Challenge of Intracellular Delivery
Intracellular delivery of macromolecules is a critical step in therapeutic and research applications. Nanoparticle mediated delivery of DNA and RNA, for example, is being explored for gene therapy(l, 2), while protein delivery is a promising means of affecting cellular function in both clinical(3) and laboratory(4) settings. Other materials, such as small molecules, quantum dots, or gold nanoparticles, are of interest for cancer therapies(5, 6), intracellular labeling(7, 8), and single molecule tracking(9).
The cell membrane is largely impermeable to macromolecules. Many existing techniques utilize polymeric nanoparticles(10, 11), liposomes(12), or chemical modifications of the target molecule(13), such as cell penetrating peptides (CPPs) (14, 15), to facilitate membrane poration or endocytotic delivery. In these methods, the delivery vehicle's efficacy is often dependent on the structure of the target molecule and the cell type. These methods are thus efficient in the delivery of structurally uniform materials, such as nucleic acids, but often ill-suited for the delivery of more structurally diverse materials, such as proteins(16, 17) and some nanomaterials(7). Moreover, the endosome escape mechanism that most of these methods rely on is often inefficient; hence, much material remains trapped in endosomal and lysosomal vesicles(18). More effective gene delivery methods, such as viral vectors(19, 20), on the other hand, often risk chromosomal integration and are limited to DNA and RNA delivery.
Membrane poration methods, such as electroporation(21, 22) and sonoporation(23), are an attractive alternative in some applications. Indeed electroporation has demonstrated its efficacy in a number of DNA(24) and RNA(25) delivery applications for previously difficult to transfect primary cells. However, this method can cause cell death and has been shown to damage sensitive materials such as quantum dots, which aggregate due to exposure to electric fields(8). There have also been limited reports of successful protein delivery by this mechanism (26, 27). Microinjection, on the other hand, is perhaps the most direct method of delivering material to the cell cytoplasm regardless of cell type or delivery material. Though effective for certain applications, such as producing transgenic organisms, the method's low throughput is a disadvantage in many therapeutic and research applications(28, 29).
The range of delivery material, target cell types and delivery methods are summarized in the tables below. Although this format does not capture the subtleties of individual delivery applications, it provides a generalized picture of the challenges in the field. Specifically, it illustrates that most methods have difficulty translating to primary cells. One could speculate that the reason electroporation has translated more effectively across cell types compared to its nanoparticle counterparts is that electroporation is primarily dependent on cell membrane properties. Nanoparticle vectors and cell penetrating peptides, in contrast, are affected by membrane properties, endocytotic rates and endosome escape mechanisms. Hence, as a method, they are more susceptible to variations in behavior across cell types while, despite high toxicity, electroporation is more robust and has been able to address some of the delivery challenges in primary cells.
Table 1. A categorization of cell types targeted for intracellular delivery applications.
Cell Types Comments
Immune Cells Important for understanding the immune response and developing
immunotherapies. This category includes T cells, B cells, Dendritic Cells, Macrophages, Monocytes, Granulocytes, etc. T cells and B cells are often the most recalcitrant to transfection.
Stem Cells Important for understanding development of different cell lineages and a critical component of potential regenerative therapies. Embryonic stem cells especially can be sensitive to perturbation as they die or differentiate in response to stressful transfection events
Neurons Important for understanding neural signaling pathways, brain function
and neurological diseases. Terminally differentiated and highly specialized cells that may lack the capacity to respond robustly to stressful transfection events
Fibroblasts/Epithelial This category encompasses a range of cell types with mechanistic or cells etc. therapeutic significance. These cells are typically easier to manipulate in culture and more resilient to stressful transfection events compared to the above three cell types.
Cell lines Established cell lines serve as useful models for studying some
disease/cell mechanisms and functions. These cells are easier to manipulate in vitro and thus most transfection methods are tested/developed around cell lines before attempted translation to primary cells.
Table 2. A categorization of target materials most commonly used for intracellular delivery applications.
Materials Comments
Nucleic Acids This category encompasses all oligonucleotides including DNA, RNA, siRNA, mRNA, and miRNA. DNA often needs to be transported into the nucleus to enable expression of the target genes (this transport is not necessarily an innate cellular function and often needs to be facilitated
by external means). The various forms of RNA are usually cytosolically
active. DNA plasmids are the most common target material for transfection as it provides an amplified response if successful. RNA is of increasing interest; however, it is inherently less stable than DNA and therefore more difficult to decouple delivery and activity issues. Because DNA and RNA are structurally similar, reagents/methods that
work for one often work for the other.
Proteins/peptides This category includes all combinations of amino acids regardless of function (e.g. antibodies, transcription factors, structural proteins, short peptides). Proteins are often difficult to produce/purify which is why some studies prefer to use DNA for artificially inducing expression in
vitro. For in vivo applications, however, DNA carries a finite risk of
integration into the genome and thus raises significant safety concerns. Moreover, there are applications (e.g. imaging) where over expression of the target protein may not be desirable. The structural diversity of proteins and their sensitive tertiary structure poses a significant
challenge to developing effective protein delivery methods.
Small Molecules This category includes all small molecule structures that may have a
biologically relevant function/application. Due to their
structural/chemical diversity, developing robust delivery technologies
for these materials is a challenge.
Nanomaterials This category includes materials such as quantum dots, gold
nanoparticles and carbon nanotubes. Due to their structural/chemical diversity, developing robust delivery technologies for these materials is
a challenge.
This observation would indicate that physical approaches to intracellular delivery are inherently more robust than vector-based methods. Electroporation is currently the most common physical approach as microinjection is challenging to scale to high throughput(30) and sonoporation has yet to demonstrate enabling potential beyond electroporation(3 1). In most current implementations of electroporation, the non-uniformity of the electrical field throughout the bulk solution could be responsible for the high rate of toxicity as some cells are exposed to overly harsh conditions(32). Recent microfluidic approaches to electroporation (22, 33) seek to address
this issue by providing a more uniform field in a controlled region. These systems have yet to establish significant throughput however. Moreover, the role of the electrical field in facilitating transport into the cytoplasm of a porated cell remains unclear as some results indicate electrophoretic effects may be responsible for transporting larger charged molecules, such as
DNA(34). Electrical fields are also known to damage certain target materials(8) and have had
limited success in protein delivery(26, 27).
A simplified approach to delivery that facilitates consistent mechanical disruption of the cell
membrane in the absence of vector materials or electrical fields could thus potentially overcome the aforementioned challenges of electroporation while retaining the benefits of a physical approach to delivery. For most in vivo applications, however, the development of targeted, vector-based delivery system would be preferred as it could be unfeasible to implement mechanical approaches in vivo.
Table 3. A list of delivery methods commonly used for in vitro and in vivo applications.
Delivery Methods Mechanism Advantage Disadvantage
Nanoparticles and This category encompasses all Ease of use, Potential
Liposomes methods that involve the potential for toxicity and
off-complexing of a carrier vector in vivo target effects with the target material to facilitate applications from vector
intracellular delivery. The majority material,
of these methods involve the limited success
following steps: 1) Carrier forms a in delivery to
complex with the target material 2) primary cells,
The complex is endocytosed by limited success
the desired cell 3) The complex in delivering
escapes the endosome and releases materials other
the target material in the than nucleic
cytoplasm 4) (Optional) the acids
complex facilitates nuclear
transport before release of the
target material.
Cell penetrating This category encompasses all Can Often requires
peptides (CPPs) methods that involve the use of facilitate covalent
polypeptide sequences to induce delivery of modification of delivery of the target material. The some target material, majority of these methods involve structurally much material the following steps: 1) the CPP is diverse remains trapped (often covalently) attached to the materials, in endosomes
endocytosed by the desired cell 3) in vivo
The complex escapes the applications
endosome and releases the target material in the cytoplasm 4) (Optional) the complex facilitates nuclear transport before release of
the target material.
Electroporation Cells are exposed to an electrical Ease of use, Toxicity,
field to induce the formation of capable of limited success
temporary pores in the cell addressing with proteins
membrane. Electrophoretic and/or some and
diffusive effects then facilitate the challenging nanomaterials transport of material in the primary
surrounding environment into the cells and
cell cytoplasm. materials
Microinjection Cells are physically punctured by a Theoreticall Low throughput microneedle to facilitate direct y capable of prohibits use in cytoplasmic delivery of the target delivering most
material. any material applications
to any cell
type
Sonoporation Cells are exposed to ultrasound to Ease of use, Toxicity, early induce the formation of temporary capable of stage
membrane disruptions that addressing technology has
facilitate the entry of the target some not
material into the cytoplasm challenging demonstrated
primary potential
cells and beyond
materials electroporation
Viral Viral vectors are engineered to Effective Significant risk
carry the gene of interest to the gene in clinical
target cells. delivery for applications,
most cell limited to gene