HAL Id: hal-02036719
https://hal-univ-rennes1.archives-ouvertes.fr/hal-02036719
Submitted on 2 May 2019
HAL is a multi-disciplinary open access archive for the deposit and dissemination of sci-entific research documents, whether they are pub-lished or not. The documents may come from teaching and research institutions in France or abroad, or from public or private research centers.
L’archive ouverte pluridisciplinaire HAL, est destinée au dépôt et à la diffusion de documents scientifiques de niveau recherche, publiés ou non, émanant des établissements d’enseignement et de recherche français ou étrangers, des laboratoires publics ou privés.
Automatic Segmentation of Kidney and Renal Tumor in
CT Images Based on 3D Fully Convolutional Neural
Network with Pyramid Pooling Module
Guanyu Yang, Guoqing Li, Tan Pan, Youyong Kong, Jiasong Wu, Huazhong
Shu, Limin Luo, Jean-Louis Dillenseger, Jean-Louis Coatrieux, Lijun Tang, et
al.
To cite this version:
Guanyu Yang, Guoqing Li, Tan Pan, Youyong Kong, Jiasong Wu, et al.. Automatic Segmentation of Kidney and Renal Tumor in CT Images Based on 3D Fully Convolutional Neural Network with Pyramid Pooling Module. 24th International Conference on Pattern Recognition, ICPR 2018, Aug 2018, Beijing, China. pp.3790-3795, �10.1109/ICPR.2018.8545143�. �hal-02036719�
Automatic Segmentation of Kidney and Renal Tumor in
CT Images Based on Pyramid Pooling and Gradually
Enhanced Feature Modules
Guanyu Yang
1,2,5, Guoqing Li
1, Tan Pan
1, Youyong Kong
1, Jiasong Wu
1,2,5,Huazhong Shu
1,2,5,
Limin Luo
1,2,5, Jean-Louis Dillenseger
3,5, Jean-Louis Coatrieux
3,5, Lijun Tang
4, Xiaomei Zhu
4,
1Lab of Image Science and Technology, School of Computer Science and Engineering, Southeast University, Nanjing, China
2International Joint Research Laboratory of Information Display and Visualization, Southeast University, Nanjing, China
3INSERM-U1099, LTSI, Université de Rennes 1, Rennes, F-35000, France
4Dept. of Radiology, the First Affiliated Hospital of Nanjing Medical University, Nanjing, China 5Centre de Recherche en Information Biomédicale Sino-Français (CRIBs)
Abstract— Renal cancer is one of ten most common cancers in
human beings. The laparoscopic partial nephrectomy (LPN) becomes a main therapeutic approach in treating renal cancer. Accurate kidney and tumor segmentation in CT images is a prerequisite step in the surgery planning. However, automatic kidney and renal tumor segmentation in CT images is still a challenge work. In this paper, we propose a new method to perform precise segmentation of kidney and renal tumor in CT angiography images. The method mainly relies on a new three-dimensional (3D) fully convolutional network (FCN) which combines the pyramid pooling module (PPM) and gradually enhanced feature module (GEFM). The proposed 3D network can utilize the 3D spatial contextual information to improve the segmentation of the kidney as well as the tumor lesion. According to the experimental results in the CT images of 140 patients, our proposed method can segment the kidney and renal tumor with a high accuracy. The average dice coefficients of kidney and renal tumor obtained by the proposed method are 0.923 and 0.826 respectively, which are higher than the other two advanced segmentation methods. Furthermore, our approach shows an excellent performance for renal tumor detection in high sensitivity and specificity.
Keywords—Kidney segmentation, renal tumor segmentation,
3D fully convolutional networks, pyramid pooling
I. INTRODUCTION
Renal cancer is one of ten most common cancers in human beings. Recently, the traditional radical nephrectomy (RN) is increasingly replaced by minimally invasive laparoscopic partial nephrectomy (LPN) in clinic to treat localized renal cancer [1]. The LPN surgery can remove the renal tumor and preserve the normal renal tissue. Especially, the newly developed LPN surgery with segmental renal artery clamping technique can optimally preserve the renal function by clamping the tumor feeding artery during LPN surgery [2]. In order to perform pre-operative LPN planning, major information such as the size and the position of tumor, the anatomy of kidney, renal arteries as well as ureter, should be extracted from volumetric CT images. However, manual delineation in more than 200 CT slices is too time-consuming
in clinical practice. Thus, an automatic or semi-automatic segmentation method is required.
Several approaches have been presented to perform kidney segmentation in CT or MR images. Cuingnet et al. [3] proposed a two-step kidney segmentation approach, based on random forest algorithms by detecting the kidney position and then by computing a probability map. Yang et al. [4] designed a coarse-to-fine segmentation by using multi-atlas images. These methods, however, only addressed the segmentation of the whole kidney and not the distinction between normal tissue and tumor lesion. In addition, this atlas-based method using the organ prior shape can fail in presence of large exophytic tumors
Few research works focused on the renal tumor segmentation. Linguraru et al. [5] developed a level-set based method to extract the renal tumors. However, user-defined points should be provided interactively for each tumor. Furthermore, the tumor lesion segmentation was performed in the venous phase CT image. Considering the limitation of the radiation dose, venous phase CT is not essential to the planning of LPN surgery. Only arterial phase CT images are acquired for the patients included in our study. Several examples of such images are displayed in Fig.1. They show that the position and the size of the tumors, the intensity and the texture of the kidneys vary significantly. This is why a precise automatic segmentation of the renal tumors is so challenging.
Recently, two-dimensional (2D) deep neural networks have been applied with success to natural images [6-8] and also in medical imaging [9-12]. However, their 2D feature extraction capability may be limited in discriminating regions of kidney and tumors with similar intensity distributions and textures as shown in Fig.1. Several 3D deep neural networks based on slices of CT or MR images [13-16]. Experimental results showed that 3D deep neural networks generally achieve better performance than the 2D convolutional neural networks in different organ segmentation tasks, such as liver tumor [13], brain tumor [14], lumbar vertebrae [15], confocal microscopy images [16], etc. However, to the best of our knowledge, there are no attempts reported for kidney and renal tumor segmentation.
Fig. 1. The examples of renal tumors displayed in arterial enhancement CT images. The renal tumors are marked by asterisks (*).
In this paper, we propose a framework to perform accurate segmentation of kidney and renal tumor in CT angiography images. The main contribution of this paper is that a new 3D fully convolutional network incorporating the pyramid pooling module (PPM) named 3D_FCN_PPM is implemented. Unlike the other 2D neural networks, this 3D network can extract the feature maps based on 3D spatial contextual information. Thus the morphological coherence of the kidneys and the tumor lesions can be improved. The paper is organized as follow: Section II describes the basic features of our method; experimental results are summarized in Section III before concluding (Section IV).
II. METHODOLOGY
Because an abdominal CT image includes more than 300 cross-sectional slices of 5122 pixels, a direct feeding of the
volumetric CT into the 3D convolutional neural network can require a large amount of graphics memory, which exceeds the memory capacity of the most recent graphics cards such as NVIDIA Titan X. Therefore, the ROIs of the kidneys are cropped from original CT image based on the coarse segmentation step used in our previous multi-atlas-based approach [4]. The ROIs extraction, with a fixed window size of 150×150 pixels, is carried out by aligning the image data with eight low-resolution atlas images. These ROIs are then used to build the training and testing datasets. In Fig. 2, the main pipeline of our method is illustrated.
A. Architecture of 3D Fully Convolutional Neural Network
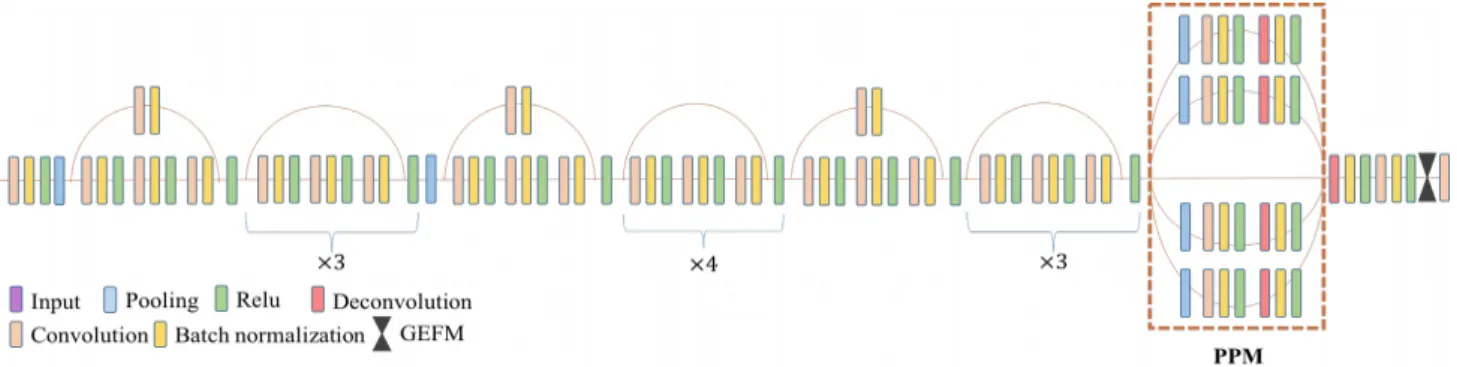
Our end-to-end system mainly consists of a specially designed 3D fully convolutional neural network structure as depicted in Fig.3.
1. Module design
Inspired by the idea of FCN [6], we designed a new 3D FCN-based network. Considering that 3D FCN has a huge demand of graphics memory, it is difficult to convert an existing 2D network, such as SegNet [7], PSPNET [8], into a 3D version by just replacing all 2D layers by 3D ones. So, several modifications have been made in our network architecture.
Firstly, the residual block introduced in ResNet [17] is adopted to construct the major part of our network. The usage of residual blocks can make our network converge faster and improve the generality of our model. As shown in Fig.3, there are 13 residual blocks with a total of 39 convolutional layers in our network.
Secondly, compared with the other existing networks, less pooling layers are used in order to preserve image details important for the segmentation task. It is well known that the pooling layer can decrease the use of graphics memory by reducing the size of feature maps and enlarge the reception field to enhance perception of global information. FCN will miss some useful details for the pixel-level segmentation if it has too many pooling layers, such as the non-maxima in the max-pooling layer. Considering that the location information and the semantic information are equally crucial to generate an accurate segmentation, we decrease the number of pooling layers to two, which, however, has some side-effects including the increasing consumption of graphics memory and the reduction of the reception field. Thus, according to the empirical evidence that the depth of the network is more important than its width, we choose to limit the width of network to achieve a deeper network structure. The dilated convolution [18] and the pyramid pooling module (PPM) are incorporated in our 3D network for larger reception fields. The detail layer settings is displayed in the Fig. 3.
2. Pyramid Pooling Module (PPM)
The PPM was firstly introduced by 2D Pyramid Scene Parsing Network (2D PSPNet) [8] and achieved best performance in the ImageNet scene parsing challenge 2016. As shown in Fig. 3, the PPM includes a shortcut and four branches, each of which mainly consists of a pooling layer, a convolution layer and a deconvolution layer. Different branches which have different kernel sizes in the pooling and deconvolution layers will lead to different sizes of the reception field. In this paper, the kernel sizes are set to 2, 4, 8 and 16 for four branches respectively. The branch with a larger kernel captures more global features and conversely the branch with a smaller kernel more local features. The input of PPM and the outputs of all branches are concatenated to be fed into the following layer. Thus, the combination of global and local features allows generating an accurate pixel-level prediction. Meanwhile, the different kernel sizes also improve the ability to detect the objects at different scales. Thus, the PPM is efficient in the segmentation task of the dataset with multi-scale objects. This is important to the segmentation task in this paper since the size of kidney and renal tumor vary significantly among different patients.
3. Weighted cross entropy
In our experimental dataset, the volume ratio of kidney, tumor and background regions are 16.93%, 2.43%, 80.64% respectively. For this unbalanced data distribution problem, we adopt the loss function based on weighted cross entropy [7] defined as follows,
(1) where T is the number of the classes. and are the probabilities of the i-th class of the ground truth and prediction respectively, is the weight of the i-th class. Here, the weights ’s are set to 1.0, 2.0 and 0.2 for kidney, tumor and background respectively in Eq. (1) according to the preliminary experiments
B. Post-Processing
Because of the limitation of the graphics memory, our network can only accept input volume of 64 slices. Thus, one ROI should be separated into several sub-volumes to be fed into the network. The segmentation results of all sub-volumes obtained by our network are later concatenated to generate the
final segmentation results. The segmentation results of the overlapped regions were generated by majority voting. The 3D conditional random field [19] was adopted to improve the segmentation results, such as filling the small holes. According the anatomy of kidney, the voxels classified as renal tumor and kidney are connected together. The connected component analysis with an 18-connectivity in 3D is performed to remove isolated misclassified voxels without the connection to the region of kidney. Only the largest connected component including voxels classified as kidney or renal tumor by our network is kept as the final segmentation result.
III. EXPERIMENTALRESULTS
A. Experimental datasets
The abdominal CT angiographic images of 140 patients who underwent a LPN surgery between Jan., 2013 to Dec., 2015 were included in this study. The images were acquired on a Siemens dual-source 64-slice CT scanner. The pixel size of these CT images is between 0.59mm 2 to 0.74 mm2. The
kidney segmentation results of our previous method [4] were used to generate the initial contours of kidneys. One radiologist (X. Zhu) checked the contours of the kidneys and corrected them if needed. The contours of tumors were drawn by the same radiologist manually in the cross-sectional slices. After the manual delineation, another radiologist (L. Tang) joined to perform a joint review of the contours and amended the contours by consensus if need. Patients with four different pathological renal tumor subtypes were included in this dataset. These renal cell carcinoma subtypes cover: clear cell, chromophobe, papillary and angioleiomyolipoma. The volume of the renal tumors ranges from 2.11 ml to 144.82 ml and the mean volume is 33.58 ml. The volume of the kidneys ranges from 85.76 ml to 262.78 ml and the mean volume is 156.37 ml.
In this study, only the kidneys with tumor lesion were selected to build the training and testing dataset. Thus, in total, 90 ROIs including the lesioned kidney were used for the training set and 50 ROIs for the testing dataset. Each ROI comes from different patient.
B. Implementation details
Our work is implemented based on pytorch [20]. The network training and testing experiments were performed on a workstation with the CPU of i7-5930K, the RAM of 128GB and one graphic cards of TITAN X of 12GB memory.
1. Data preprocessing
As it is done in other studies, images should be normalized before being fed into the network. Due to the existence of bones and air in the intestinal tract, the range of CT value in the image could change from -1000HU to more than 800HU. A thresholding step should be performed before the normalization. Because of the injection of contrast media, the CT values of the kidney and renal tumor have the same distribution, ranging approximately from 100HU to 500HU. Considering that the surrounding tissues have relatively lower CT value, the minimum and maximum thresholds for CT value are fixed to be -200HU and 500HU respectively. The CT values below or above these thresholds were set respectively to -200HU or 500HU. The pixel values in all images are normalized to 0~1 and subtracted by the mean value of the dataset.
2. Data augmentation
Since the manual delineation of the kidneys and renal tumors is a time-consuming work, too few images were available to train the network well. To expand the dataset, the ROIs were flipped and random cropped. Though each ROI has about 200 slices, the kidney and subsequently the tumor don’t appear in all slices. In order to get a good discrimination of the kidney and the tumor, the data augmentation manipulation was more focused on the region including kidney and renal tumor. Experimental results show that it is effective for training our 3D network. In total, the number of images for the network training reaches about 90000, which is about 1000 times larger than the number of original ROIs.
3. Network training
Our network was trained end-to-end by back-propagation and stochastic gradient descent (SGD). The momentum of SGD is set to 0.9. The L2 regularization is also used, the weight decay of which is 0.00001. The basic learning rate is 0.001. We adopt the multistep learning rate policy and the steps are set to [3, 5, 7] epochs. Fourteen thousand iterations were performed in each epoch when batch size is set to 4. Experiments show that our network can quickly get converged with these settings. The settings are used in all experiments.
C. Evaluation results
Fifty ROIs obtained from 50 patients in the testing dataset were used by our 3D_FCN_PPM network. We used the same training dataset to train two networks, i.e. 2D_PSPNet [10] and 3D_UNet [16], to evaluate the performance of our method. The segmentation results are evaluated quantitatively by dice coefficient and mean surface-to-surface distance. . The dice coefficient is defined as follows,
(2) where and are the voxels of the l-th label in the ground truth x and in the segmentation result y, respectively. is the number of the overlapped voxels of and . is the sum of of and . The dice coefficient and surface distance are calculated per patient.
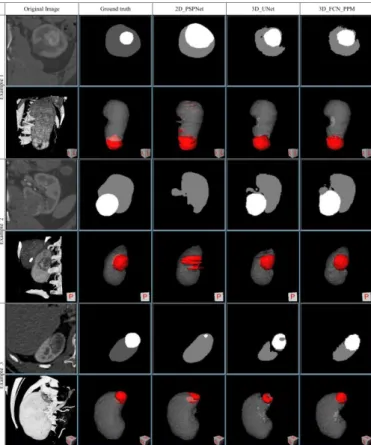
In Fig. 4, two examples of the original image, the ground truth and the comparison of segmentation results of different networks are displayed. From figures of 3D views displayed in Fig.4, the 2D_PSPNet generated some false positive tumor classification. In addition, as shown in the 2D cross-sectional image of the second example, the tumor region is misclassified as background because the region of renal tumor has similar image appearance with the adjacent tissue in displayed cross-sectional 2D image. Obviously, comparing to the other two 3D networks, the renal tumor is difficult to be segmented accurately by the 2D_PSPNet due to the lack of the contextual information in the z-direction.
From the 3D visualization of the results displayed in Fig.4, two 3D networks, i.e., 3D_UNet and our proposed network, yielded similar segmentation results. However, our proposed network, i.e. 3D_FCN_PPM, can generate more accurate segmentation than the 3D_UNet according to the 2D visualization of the results, especially in or near the tumors.
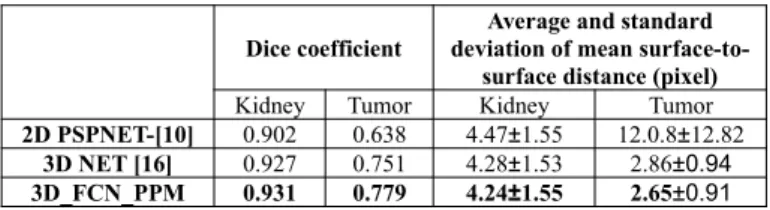
The comparison of dice coefficients and surface distances of different networks obtained in the testing dataset are summarized in Table I. In the testing dataset of 50 kidneys, 3D_FCN_PPM can achieved the highest dice coefficients and minimal mean surface-to-surface distance for both the kidney and the renal tumor. The average dice coefficients are 0.931 and 0.802 for kidneys and tumors respectively. The dice coefficients vary from 0.871 to 0.961 for kidneys and 0.440 to 0.938 for tumors. The average mean surface-to-surface distance is 4.21 and 2.65 pixels for kidneys and tumors respectively.
Table I. The comparison of Dice coefficients and surface distances of different networks obtained in the testing dataset.
Dice coefficient
Average and standard deviation of mean
surface-to-surface distance (pixel)
Kidney Tumor Kidney Tumor
2D PSPNET-[10] 0.902 0.638 4.47±1.55 12.0.8±12.82
3D NET [16] 0.927 0.751 4.28±1.53 2.86±0.94
3D_FCN_PPM 0.931 0.779 4.24±1.55 2.65±0.91
The lowest dice coefficient for renal tumor in the testing dataset was 0.440. However, according to the results shown in Fig. 5, the kidney and the tumor in this case were correctly detected but with some under-segmentation. The volume of this renal tumor is about 6ml and its diameter is less than 40 pixels. Thus, it is easy to understand that the under-segmentation of such small renal tumor is the major reason to have such a low dice coefficient.
More segmentation results of 3D_FCN_PPM are given in Fig. 6. Although the location, intensity and texture of the kidneys and the tumors in these examples are diverse, the predicted kidney and tumor regions are in good agreement with the ground truth. Another observation worth to be mentioned is that the 3D_FCN_PPM can produce the bias prediction near the renal hilum compared to the reference standard labeled by the radiologists, as pointed by the yellow arrows in Fig. 6.
Fig.4 The comparison of the segmentation results with 2D and 3D visualization in three examples. For each example, the original ROI image, ground truth and the segmentation results of 2D PSPNet, UNet-3D and 3D_FCN_PPM are displayed in the first to the fifth columns respectively. Both the segmentation results of a 2D cross-sectional image and of the whole 3D ROI are given. The regions of renal tumors are displayed in white of 2D view and in red of 3D view.
Fig. 5 The image with the lowest dice coefficient of tumor region in the testing dataset. The dice coefficients of kidney and tumor are 0.901 and 0.440 respectively. (a) the original slice, (b) the ground truth and (c) the segmentation results of 3D_FCN_PPM.
IV. CONCLUSION
In this paper, we proposed a 3D fully convolutional network with pyramid pooling module specially designed for kidneys and renal lesions segmentation. Experimental results and comparisons with other approaches demonstrate that our method achieves a very competitive performance with an average dice coefficient equal to 0.931 for kidney segmentation and to 0.802 for tumor. In addition, our proposed network is inherently general and can be easily extended to other applications. An important issue however in medical imaging will be how to get large data sets together with ground truth in order to efficiently train such network.
Fig. 6. The segmentation results of 3D_FCN_PPM. The images in the first to third columns are the original image, the ground truth and the segmentation results of 3D_FCN_PPM. The slice in each row comes from different patients. Yellow arrows mark the difference at renal hilum between the segmentation result and the ground truth.
V. ACKNOWLEDGMENT
This research was supported by National Natural Science Foundation under grants (31571001), the Short-Term Recruitment Program of Foreign Experts (WQ20163200398), and Science Foundation for The Excellent Youth Scholars of Southeast University.
VI. REFERENCES
[1] B. Ljungberg, K. Bensalah, S. Canfield, S. Dabestani, F. Hofmann, M. Hora, M. A. Kuczyk, T. Lam, L. Marconi, and A. S. Merseburger, “Eau guidelines on renal cell carcinoma: 2014 update,” European Urology, vol. 67, no. 5, p.913-924, 2015
[2] P. Shao, C. Chao, X. Meng, Xiaobing, Qiang, Zhang, and Zhengquan, “Laparoscopic partial nephrectomy with segmental renal artery clamping: technique and clinical outcomes,” European Urology, vol. 59, no. 7, pp. 849–55, 2011
[3] R. Cuingnet, R. Prevost, D. Lesage, L. D. Cohen, B. Mory, and R. Ardon, “Automatic detection and segmentation of kidneys in 3D CT images using random forests,” Medical Image Computing and Computer-Assisted Intervention – MICCAI 2012. Springer Berlin Heidelberg, 2012, pp.66-74.
[4] G. Yang, G., Gu, J., Chen, Y., Liu, W., Tang, L., Shu, H., Toumoulin, C.: “Automatic kidney segmentation in CT images based on multi-atlas image registration,” In: Engineering in Medicine & Biology Society Conference, 2014:5538.
[5] M.G. Linguraru, S. Wang, F. Shah, R. Gautam, J. Peterson, W. M. Linehan, et al.. “Automated noninvasive classification of renal cancer on multiphase CT,” Medical Physics, 2011, vol.38, no.10, pp.5738-5746. [6] J. Long, E. Shelhamer, T. Darrell. "Fully convolutional networks for
semantic segmentation," IEEE Transactions on Pattern Analysis and Machine Intelligence, vol.39, no.4, 2017,pp.640-651.
[7] V. Badrinarayanan, A. Kendall, and R. Cipolla, “Segnet: A deep convolutional encoderdecoder architecture for image segmentation” IEEE Transactions on Pattern Analysis and Machine Intelligence, in press, DOI: 10.1109/TPAMI.2016.2644615.
[8] H. Zhao, J. Shi, X. Qi, X. Wang, and J. Jia, “Pyramid scene parsing network,” IEEE Conference on Computer Vision and Pattern Recognition. IEEE Computer Society, 2017, pp.6230-6239.
[9] M. A. Hussain, A. Amir-Khalili, G. Hamarneh, and R. Abugharbieh, “Segmentation-free kidney localization and volume estimation using aggregated orthogonal decision CNNs”. Medical Image Computing and Computer-Assisted Intervention – MICCAI 2017, Springer Berlin Heidelberg, 2017, pp. 612-620.
[10] M. Havaei, A. Davy, D. Warde-Farley, A. Biard, A. Courville, Y. Bengio, C. Pal, P. M. Jodoin, and H. Larochelle, “Brain tumor segmentation with deep neural networks,” Medical Image Analysis, vol. 35, 2017, pp. 18– 31.
[11] A. Esteva, B. Kuprel, R. A. Novoa, J. Ko, S. M. Swetter, H. M. Blau, and S. Thrun, “Dermatologist level classification of skin cancer with deep neural networks,”, Nature , vol. 542, no. 7639, p. 115, 2017. [12] R. Rouhi, M. Jafari, S. Kasaei, and P. Keshavarzian, “Benign and
malignant breast tumors classification based on region growing and cnn
segmentation,” Expert Systems with Applications An International Journal, vol. 42, no. 3, 2015, pp. 990–1002.
[13] Q. Dou, L. Yu, H. Chen, Y. Jin, X. Yang, J. Qin, P. A. Heng, “3D deeply supervised network for automated segmentation of volumetric medical images,” Medical Image Analysis, vol. 41, 2017, pp.40-54.
[14] K. Kamnitsas, C. Ledig, V. F. Newcombe, J. P. Simpson, A. D. Kane, D. K. Menon, et al. “Efficient multi-scale 3D CNN with fully connected CRF for accurate brain lesion segmentation.” Medical image analysis, vol. 36, 2017, pp. 61-78.
[15] J. Rens, G. Zeng, G. Zheng. "Fully automatic segmentation of lumbar vertebrae from ct images using cascaded 3D fully convolutional networks." arXiv preprint arXiv:1712.01509 (2017). Unpublished. [16] Ç. Özgün, A. Abdulkadir, S. Lienkamp, T. Brox, O. Ronneberger, "3D
U-Net: learning dense volumetric segmentation from sparse annotation," International Conference on Medical Image Computing and Computer-Assisted Intervention–MICCAI 2016. Springer International Publishing, 2016 pp. 424-432.
[17] K. He, X. Zhang, S. Ren, and J. Sun, “Deep residual learning for image recognition,” IEEE Conference on Computer Vision and Pattern Recognition. IEEE Computer Society, 2016, pp. 770–778.
[18] F. Yu, V. Koltun. “Multi-scale context aggregation by dilated convolutions,” arXiv preprint arXiv:1511.07122 (2015). Unpublished. [19] P. Krähenbühl, V. Koltun. “Efficient inference in fully connected CRFs
with Gaussian edge potentials”. Advances in Neural Information Processing Systems 24 (NIPS 2011)
[20] Pytorch: Tensors and dynamic neural networks in python with strong gpu acceleration, http://pytorch.org/.