Publisher’s version / Version de l'éditeur:
Technical Report, 2004-03
READ THESE TERMS AND CONDITIONS CAREFULLY BEFORE USING THIS WEBSITE.
https://nrc-publications.canada.ca/eng/copyright
Vous avez des questions? Nous pouvons vous aider. Pour communiquer directement avec un auteur, consultez la
première page de la revue dans laquelle son article a été publié afin de trouver ses coordonnées. Si vous n’arrivez pas à les repérer, communiquez avec nous à PublicationsArchive-ArchivesPublications@nrc-cnrc.gc.ca.
Questions? Contact the NRC Publications Archive team at
PublicationsArchive-ArchivesPublications@nrc-cnrc.gc.ca. If you wish to email the authors directly, please see the first page of the publication for their contact information.
Archives des publications du CNRC
For the publisher’s version, please access the DOI link below./ Pour consulter la version de l’éditeur, utilisez le lien DOI ci-dessous.
https://doi.org/10.4224/12327562
Access and use of this website and the material on it are subject to the Terms and Conditions set forth at
Properties of Second-year and Multi-year Ice during Freeze-up
Johnston, Michelle
https://publications-cnrc.canada.ca/fra/droits
L’accès à ce site Web et l’utilisation de son contenu sont assujettis aux conditions présentées dans le site
LISEZ CES CONDITIONS ATTENTIVEMENT AVANT D’UTILISER CE SITE WEB.
NRC Publications Record / Notice d'Archives des publications de CNRC: https://nrc-publications.canada.ca/eng/view/object/?id=94e0e07c-4821-4a4d-aa49-723cd9325cd9 https://publications-cnrc.canada.ca/fra/voir/objet/?id=94e0e07c-4821-4a4d-aa49-723cd9325cd9
TP14292E
Properties of Second-year and Multi-year Ice
during Freeze-up
M. Johnston
Technical Report, CHC-TR-024
TP14292 E
Properties of Second-year and Multi-year Ice
during Freeze-up
M. Johnston
Canadian Hydraulics Centre National Research Council of Canada
Montreal Road Ottawa, Ontario K1A 0R6
Prepared for: Transport Canada
Marine Safety 330 Sparks Street Ottawa, Ontario K1A 0N8
Technical Report, CHC-TR-024 March 2004
Abstract
This report documents results from a field program during which the properties of second-year and multi-year ice were measured during freeze-up, October 2003. This project was undertaken in support of the Arctic Ice Regime Shipping System (AIRSS). Results from this study will be used in considering updates to the methods by which AIRSS accounts for ice decay. The thickness, snow depth, temperature, salinity and borehole strength of ice were measured at six sites in the central Canadian Arctic. Sampled multi-year ice included a one-month old ice cover that consisted of jumbled blocks of old ice (1.0 to 2.4 m thick), a 300 m diameter floe (1.74 to 4.5 m thick) and a 50 m diameter, hummocked floe (more than 2 m thick). Strength of the multi-year ice ranged from less than 1 MPa to 21 MPa, salinities varied from 0.0 to 4.7 ‰ and all but the uppermost 0.40 m of ice was at near melting, isothermal temperatures. Measurements were made on one second-year floe, several kilometres in diameter. That floe was from 1.4 to 1.6 m thick, had salinities from 0 to 2.9‰, was characterized by near melting isothermal temperatures and had strengths ranging from 1 MPa to 17.1 MPa. The considerable variability in the second-year and multi-second-year ice was ostensibly caused by the small-scale and large-scale voids observed in the ice and the complicated decay process.
Résumé
Le présent rapport documente les résultats du programme mené sur place pour mesurer les propriétés des glaces bisannuelles et pluriannuelles lors de l’englacement, en octobre 2003. L’épaisseur, la profondeur de neige, la température, la salinité et la résistance des trous de sondage dans la glace ont été mesurées à six sites au centre de l’Arctique canadien. Les échantillons de glaces pluriannuelles comprenaient une couverture de glace vieille d’un mois constituée de blocs massifs de vieille glace (de 1,0 à 2,4 m d’épaisseur), d’un floe de 300 m de diamètre (1,74 à 4,5 m d’épaisseur) et d’un floe hummoché de 50 m de diamètre (plus de 2 m d’épaisseur). La résistance de la glace pluriannuelle variait de moins de 1 à 21 MPa, la salinité variait de 0,0 à 4,7 ‰ et la totalité, à l’exception du 0,40 m de glace du dessus, était à une température isothermique avoisinant celle de la fonte. Les mesures ont été effectuées sur un floe de deuxième année de plusieurs kilomètres de diamètre. Ce floe d’une épaisseur variant entre 1,4 et 1,6 m, avec une salinité de 0 à 2,9 ‰, se caractérisait par une température isothermique avoisinante de la fonte et une résistance allant de 1 à 17,1 MPa. La variabilité considérable des glaces bisannuelles et pluriannuelles était ostensiblement causée en raison des interstices plus ou moins grands observés dans la glace et le processus de désintégration complexe.
Table of Contents
Abstract... i Table of Contents...iii List of Figures ... v List of Tables... v 1.0 Introduction ... 12.0 Ice Conditions around Cornwallis Island in October 2003 ... 2
3.0 Sampling Methodology ... 3
4.0 Site 1: Templeton Bay ... 4
4.1 Origin of the Ice in Templeton Bay... 5
4.2 Property Measurements at Site 1 ... 6
5.0 Site 2: Multi-year Ice in McDougall Sound ... 8
6.0 Site 3: Ice Island Fragment ... 10
7.0 Site 4: Second-year Ice near Pioneer Bay... 12
8.0 Site 5: Multi-year, Allen Bay ... 14
9.0 Site 6: Young Ice, Allen Bay... 16
10.0 Summary of Ice Property Measurements during Freeze-up ... 17
11.0 Compilation of Four Years of Strength Measurements... 21
12.0 Effect of Ice Decay on Strengths Measured during Freeze-up ... 22
13.0 Conclusions ... 24
14.0 Future Work... 25
15.0 Acknowledgements... 25
16.0 References... 26 Appendix A Sampling Methodology and Details of Strength Analysis ...A-1 Appendix B Mean Daily Air Temperature at Resolute... B-1 Appendix C Daily Log of Field Program ... C-1
List of Figures
Figure 1 Ice sites sampled from 2 to 8 October 2003 ...2
Figure 2 Second-year ice in Templeton Bay during the summer of 2002...4
Figure 3 Site 3, Multi-year ice in Templeton Bay, October 2003...5
Figure 4 Templeton Bay during the summer of 2003...6
Figure 5 Depth-profiles for multi-year ice at Site 1 ...7
Figure 6 Site 2, Multi-year ice in McDougall Sound...8
Figure 7 Depth-profiles for multi-year ice at Site 2 ...9
Figure 8 Ice Island fragments in vicinity of Little Cornwallis Island... 10
Figure 9 Depth-profiles of Ice Island fragment at Site 3... 11
Figure 10 Second-year ice near Pioneer Bay, Site 4 ... 12
Figure 11 Depth-profiles of second-year ice at Site 4... 13
Figure 12 Sites 5 & 6, multi-year and young ice in Northern Allen Bay ... 14
Figure 13 Depth-profiles of multi-year ice at Site 5... 15
Figure 14 Depth-profiles of young first-year ice at Site 6 ... 16
Figure 15 Ice borehole strength profiles for three multi-year ice sites ... 19
Figure 16 Ice borehole strength profiles of sites sampled during freeze-up ... 20
Figure 17 Four years of ice borehole strength measurements... 21
Figure 18 Core of multi-year ice at depth 1.40 m and the corresponding strength profile... 22
Figure 19 Extensive decay shown in cusps of multi-year ice overturned in Allen Bay ... 23
List of Tables
Table 1 Properties Measured during Freeze-up... 18Properties of Second-year and Multi-year Ice
during Freeze-up
1.0
Introduction
This report documents results from a field program that was designed to measure the properties of old ice (second-year and multi-year ice) during freeze-up, in October. Data gathered from this study will benefit the Arctic Ice Regime Shipping System (AIRSS). It will provide information that will provide a scientific basis for establishing when the “decay bonus” should be applied to the Ice Multipliers. Presently AIRSS, under the Arctic Shipping Pollution Prevention Regulations, allows a bonus factor to be applied to the Ice Multipliers for certain ice types, once they have decayed sufficiently. Those ice types include multi-year, second-year, medium first-year and thick first-first-year ice, and they must have thaw holes throughout their full thickness or be rotten (AIRSS, 1996).
The current method of accounting for ice decay was initially incorporated into AIRSS in qualitative terms only, with no scientific basis. Transport Canada sponsored the Canadian Hydraulics Centre (CHC) to conduct field measurements that would quantify the decrease in ice strength that occurs during summer. To date, three years of measurements have been conducted on different types of ice, from May to July/August. During that time, the properties and borehole strength of first-year ice (Johnston et al., 2003-a) and, to a lesser extent, second-year and multi-year ice (Johnston et al., 2003-b) were measured in summer. Based upon those measurements, it was suggested that the concept of ice decay be re-cast in AIRSS in terms of ice strength (Timco et al., 2004). That would mean stating that the summer bonus factor may be applied to first-year ice that has 10% (or less) of its mid-winter maximum strength (as denoted by the Ice Strength Charts). Measurements, although limited, indicate that a similar procedure may be appropriate for dealing with decayed second-year ice. As for multi-year ice, bonus factors should not be applied until more measurements have been made, providing a better understanding of how it decays.
Currently, AIRSS does not state when the summer bonus factor should be removed in the fall. At some point, decreasing air temperatures will cause the ice strength to increase above the 10% strength threshold, and the summer bonus factor will no longer be applicable. Exactly when does that occur, is the strengthening process similar for second-year and multi-year ice and how should it be taken into account in AIRSS? This field program sought to address those questions by documenting the properties of first-year, second-year and multi-year ice during freeze-up.
2.0
Ice Conditions around Cornwallis Island in October 2003
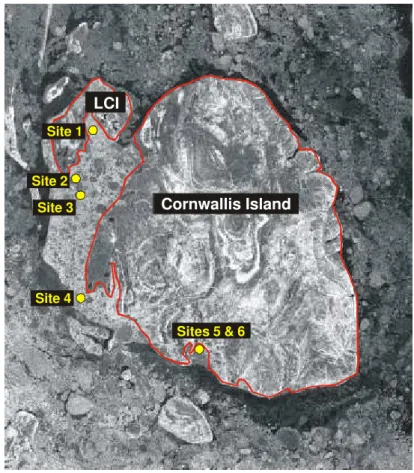
Before leaving for the field in October, the Canadian Ice Service (CIS) was consulted to obtain a synoptic view of the ice conditions and to document the coordinates of potential ice sampling sites. Figure 1 is a satellite image from early October 2003 showing the heavy ice conditions that existed between Cornwallis Island and Little Cornwallis Island (LCI). The six sites that were actually sampled during the field program are also shown in the figure.
Site 1 Site 2 Site 3 Site 4 Sites 5 & 6 Cornwallis Island LCI
Figure 1 Ice sites sampled from 2 to 8 October 2003 (Radarsat image from 4 October courtesy of CIS)
Upon arriving in the field in October, it became immediately apparent that finding old ice to sample would not be difficult. The 2003 season was unique in that respect - depending upon the year, it may not be difficult to find old ice floes around Cornwallis Island, but seldom are they so accessible. In fact, previous fieldwork has shown that the ice in Allen Bay and Lancaster Sound is usually characterized by first-year ice (Johnston and Sinha, 2001; Johnston et al., 2003-a). However, when the author boarded the CCGS LOUIS S. ST-LAURENT in Allen Bay on October 1, the vessel was surrounded by several, small multi-year ice floes.
Once aboard the LOUIS, the objectives of the science program were discussed with Commanding Officer Marsden. Considering the extremely unpredictable weather and reduced light levels at that time of year, it would be necessary to minimize the amount of flying time required. Since the ice in Templeton Bay had been given top priority, the CO recommended taking the ship to the entrance of Templeton Bay and then using the helicopter to fly into the Bay. Once sampling in Templeton Bay was complete, additional ice sites could be selected on an opportunity basis as the ship returned to Allen Bay.
Figure 1 shows the locations of the six sites that were sampled from 2 to 8 October 2003. Except for the ice in Templeton Bay (Site 1), sampling proceeded on an ad-hoc basis, depending upon the weather and ice conditions. Multi-year ice was sampled at Sites 1, 2 and 5, second-year ice was sampled at Site 4 and young first-second-year ice was sampled at Site 6. There was also the unique opportunity of sampling a massive fragment of Ice Island Ice (Site 3) during the field program.
3.0
Sampling Methodology
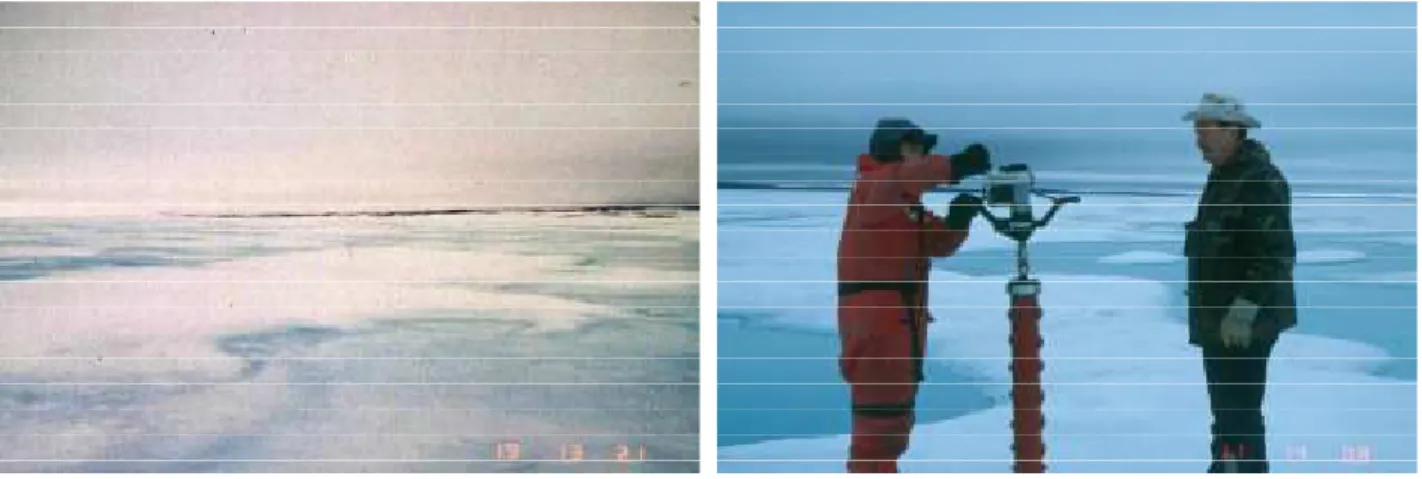
Upon arriving at each site, a 50 mm diameter, electric drill powered, ice auger was used to make holes at several locations. The ice thickness was gauged from the number of drill flights used for each hole. Since a total of eight flights of auger were taken to each site, it was possible to measure a maximum ice thickness of 8 m. Once the ice thickness had been documented, a gas-powered, 150 mm diameter, fibre-glass ice corer was used to extract up to three cores, at least two metres from one another. The snow thickness, ice surface temperature, ice thickness and ice freeboard (where appropriate) were measured at each of the core holes (boreholes). Full thickness cores of first-year and second-year ice were taken, whereas usually only the uppermost two metres of ice were removed from the multi-year ice floes. Limiting the multi-year ice cores to the top surface avoided encountering potential problems when retrieving the equipment, which has been problematic during past field programs. One of the cores was used to profile the ice temperature and another core was used to obtain a salinity profile of the ice. In some cases, portions of the core from the third hole were retained for future microstructural studies.
After the cores had been processed for temperature and salinity, strength tests were performed in the boreholes left by the corer. A borehole jack assembly was used to measure the ice borehole strength, which is a measure of the in situ confined, compressive strength of the ice. Masterson (1996) gives a detailed description of the borehole jack and the strength that it provides. Strength tests were conducted at 0.30 m intervals to a depth of about two metres, or until the bottom of the ice was reached, whichever came first. Depth profiles of the ice borehole strength were plotted for each hole, from which the depth-averaged (full-thickness) strength of each was determined. Appendix A describes the sampling methodology in further detail, as well as the procedure used to analyze borehole strength data.
Air temperatures from October 2 to 8 (Julian Day 275 to 281) ranged from -5.9 to -13°C. Appendix B shows the mean daily air temperatures for 2003 and the 30-year normal for Resolute. On average, the mean daily temperatures for the five days of sampling were 2.5°C warmer than the 30-year normal (-8.2°C versus -10.7°C). Appendix C includes a daily account of the field program.
4.0
Site 1: Templeton Bay
The ice in Templeton Bay, Little Cornwallis Island was given top priority because it was believed to present a unique sampling scenario. Satellite imagery showed that the first-year ice in Templeton Bay had survived the summer of 2001, continued to grow in the fall and winter of 2001/02 and survived the summer of 2002. When measurements were conducted last year, in June and August 2002, the ice qualified as decayed, landfast second-year ice. Property measurement confirmed that the ice was indeed bona fide second-year ice (Johnston et al., 2003-b), with a gently undulating top surface (Figure 2 a/b).
(a) 19 June 2002 (b) 11 August 2002
Figure 2 Second-year ice in Templeton Bay during the summer of 2002
After measurements had been completed in Templeton Bay in August 2002, satellite images were examined periodically to track the history of the landfast second-year ice. Each image examined from the fall of 2002 to the fall of 2003 showed that Templeton Bay was ice-covered. Prior to leaving for the Arctic in October 2003, a satellite image from late-September 2003 was examined; it also showed that ice was present in Templeton Bay, however its microwave signature had changed dramatically in tone and texture, compared to the previous images. One of the main objectives of the 2003 field program was to sample the ice in Templeton Bay, since it provided a unique opportunity to measure the properties of what was believed to have been landfast, multi-year ice (of known origin and history).
Although it had been decided to take the ship to the entrance of Templeton Bay, the substantial effort and fuel needed to transit the severe ice conditions of McDougall Sound resulted in stopping the ship 16 km south of the Bay entrance. The helicopter was used to access Templeton Bay from that location.
Before landing at the targeted site, the coast of Templeton Bay was swept in search of polar bears. The aerial perspective of the Bay was shocking because it showed that dramatic changes in the ice had taken place since it had been sampled in August 2002. The gently undulating
surface of the ice that had been sampled the previous year, had transformed into the rubbled moonscape shown in Figure 3. In fact, the ice surface was so rough that it was difficult to find a level place to land the helicopter. The conditions of the Bay raised questions about whether the ice cover was the same one that had been sampled in 2002.
Figure 3 Site 3, Multi-year ice in Templeton Bay, October 2003
4.1 Origin of the Ice in Templeton Bay
Upon returning from the field, CIS was consulted to assist with a detailed examination of the history of the ice in Templeton Bay - had it remained intact from August 2002 to October 2003? Seventy satellite images were examined during that period, six of which are shown in Figure 4. Ice conditions in Templeton Bay were very dynamic during the summer of 2003, unlike the summer of 2002. The images show that ice in the Bay actually had cleared on two separate occasions, resulting in brief periods of open water from 18 to 23 August 2003 (Figure 4-d) and 2 to 7 September 2003 (not shown in Figure 4). During each of those five-day periods, the ice exited Templeton Bay and was quickly dispersed. It was unlikely that any remnants of the second-year ice sampled in August 2002 remained in the Bay after it cleared on 7 September. The ice that was sampled in Templeton Bay in October had likely moved into the Bay after rounding the northeastern and southwestern tips of LCI. After pack ice entered the Bay, it was further compacted by old ice moving north into McDougall Sound (see the yellow arrows in Figure 4-e). It was concluded that the ice sampled in Templeton Bay in October 2003 had not been landfast multi-year ice that had over-wintered 2002/03, as initially surmised. Rather, it was old ice that had moved into the Bay on 7 September 2003. That explains the different ice surface topographies (and satellite signatures) of the landfast second-year ice that was sampled in 2002 and the rubbled multi-year ice that was sampled in 2003.
(a) August 2 (b) August 6 (c) August 14 (e) August 26 (d) August 21 Templeton Bay (ice filled) Templeton Bay
(open) Templeton Bay (ice filled) Templeton Bay (ice filled) Templeton Bay
(ice filled) Templeton Bay (breakup)
(f) September 15 Figure 4 Templeton Bay during the summer of 2003
(RADARSAT images courtesy of CIS) 4.2 Property Measurements at Site 1
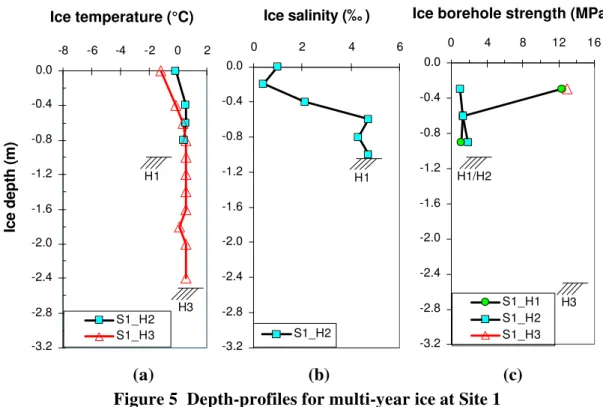
Once the perimeter of the Bay had been scouted aerially, the helicopter landed on a reasonably level area of ice near the site coordinates that had been sampled in 2002 (75°29.15´ N, 96°23.32´ W). Three boreholes were made in the ice; two in a level area of ice and a third on a hummock, roughly 0.30 m high, about 8 m from the other two holes. The level ice had a 140 to 150 mm thick snow cover whereas the hummocked ice had slightly less snow, 130 mm. Ice thickness at the three holes was 1.08 m, 1.08 m and 2.43 m. Air temperature at the site was –4.2°C.
Cores from the level ice fell apart quite easily upon handling (particularly the lower part of the core from the first hole). The uppermost 0.40 m of core from hole 1 was divided into puck-like fragments (an effect also seen when coring freshwater ice), whereas the lower part of the core was extremely porous. The core from hole 2 was also porous, but it was not as fragmented as the core from hole 1. In comparison, the core of hummocked ice was more competent.
Temperature: Temperature profiles are usually measured on the core from the first hole, but because that core was so fragmented, temperatures were measured on the core from the second hole. A second set of temperature measurements was made on the hummocked ice from hole 3, to examine potential temperature differences in the level ice and the hummocked ice. The two temperature profiles show that both cores had near melting temperatures throughout their full thickness. The uppermost 0.60 m of hummocked ice had slightly colder temperatures than the level ice (Figure 5-a). Note that, in the figure, ice temperatures above 0°C reflect the limited accuracy of the temperature probe (see Appendix A).
-3.2 -2.8 -2.4 -2.0 -1.6 -1.2 -0.8 -0.4 0.0 -8 -6 -4 -2 0 2 S1_H2 S1_H3 H1 H3 -3.2 -2.8 -2.4 -2.0 -1.6 -1.2 -0.8 -0.4 0.0 0 2 4 6 S1_H2 H1 Ice depth (m)
Ice temperature (°C) Ice salinity (‰ ) Ice borehole strength (MPa)
-3.2 -2.8 -2.4 -2.0 -1.6 -1.2 -0.8 -0.4 0.0 0 4 8 12 16 S1_H1 S1_H2 S1_H3 H1/H2 H3 (a) (b) (c)
Figure 5 Depth-profiles for multi-year ice at Site 1 (cross hatching denotes the ice thickness)
Salinity: Figure 5-b shows the salinity profile of level ice from the second hole. Salinity in the uppermost 0.40 m was less than 2‰ and increased to near 5‰ below a depth of 0.60 m. The depth-averaged salinity of the ice was 2.9‰.
Strength: Strength tests were conducted throughout the full thickness of level ice (holes 1 and 2). Figure 5-c shows that the borehole strength closest to the ice surface (depth of 0.30 m) was 12.4 and 1.3 MPa in those holes. Ice below a depth of 0.30 m in both those holes was uniformly
weak, with strengths less than 2.0 MPa. A strength test was also conducted in the surface layer of hummocked ice, the results of which are shown in Figure 5-c. The strength of the surface layer of ice in the hummock should be somewhat higher than reported, since the test was terminated prematurely due to an equipment failure (discussed in the daily log, Appendix C). During the test, the oil pressure continued to increase until equipment failure occurred, after an indentor penetration of 2.5 mm. Normally, the ice strength is reported at an indentor penetration of 3 mm, as discussed in Appendix A).
5.0
Site 2: Multi-year Ice in McDougall Sound
Once sampling in Templeton Bay had been completed, the ship was re-directed to one of the multi-year ice floes that had been observed during the transit north through McDougall Sound. Site 2 was a multi-year floe off the southern tip of Little Cornwallis Island (75°20.92´ N, 96°42.43´ W). The multi-year floe was about 300 m in diameter, had raised edges up to 8 m high and an extremely level interior (Figure 6), giving the floe a bowl-shaped appearance. The ship came to within about 200 m of the floe and the helicopter was used to access its interior. The intention was to test the repaired borehole jack at a site that was relatively close to the ship. The floe was sampled on the afternoon of 3 October, under clear skies and at an air temperature of –9.7°C. Sampling took about five hours. Upon concluding measurements at Site 2, the sky was overcast and the air temperature had fallen to –13.7°C.
Figure 6 Site 2, Multi-year ice in McDougall Sound
The 50 mm diameter auger was used to measure the approximate floe thickness before ice coring was undertaken. The ice auger showed the level ice in the interior of the floe to be about 2 m thick, whereas the ice was about 4.5 m thick, about 10 m away in a 2 m high hummock. The corer was used to make two boreholes in the level ice and third hole in the hummocked ice.
Full-thickness cores were retrieved from the level ice, where the ice was 2.01 m and 1.74 m thick and snow depth was 40 and 90 mm. Ice in the hummock was 4.5 m thick and its snow depth was 85 mm. Only the uppermost 2.5 m of ice was retrieved from the hummock. Photographs of the core from the first hole showed that the ice at depths 0.20 and 0.50 m did not hold together, and that the ice between depths 1.20 and 1.40 m was extremely porous. No observations were recorded about the consistency of cores from holes 2 and 3.
Temperature: Figure 7-a shows temperature profiles for the level ice (S2_H1) and the nearby hummock (S2_H3). The level ice was isothermal at near melting temperatures throughout its thickness, except for the slightly colder temperatures in the top ice surface (–1.1°C). In comparison, the hummocked ice had a temperature of –4.2°C at its surface, that increased to near melting, isothermal conditions at a depth of 0.80 m.
-3.2 -2.8 -2.4 -2.0 -1.6 -1.2 -0.8 -0.4 0.0 -8 -6 -4 -2 0 2 S2_H1 S2_H3 H1 -3.2 -2.8 -2.4 -2.0 -1.6 -1.2 -0.8 -0.4 0.0 0 2 4 6 S2_H2 H2 -3.2 -2.8 -2.4 -2.0 -1.6 -1.2 -0.8 -0.4 0.0 0 4 8 12 16 S2_H1 S2_H2 S2_H3 H1 H2 Ice depth (m)
Ice temperature (°C) Ice salinity (‰) Ice borehole strength (MPa)
(a) (b) (c)
Figure 7 Depth-profiles for multi-year ice at Site 2 (cross hatching denotes the ice thickness)
Salinity: The 1.8 m long ice core from hole 2 had ice salinities from 1.5 to 3.6‰ (S2_H2, Figure 7-b). The salinity of the top ice surface was 3.6‰ and decreased to 1.5‰ at a depth of 0.40 m. From depths 0.40 to 0.80 m, the salinity varied from 1.5 to 2.0‰ and then increased to 2.3 to 3.5‰ from depths 1.0 to 1.8 m. The depth-averaged salinity of the level ice was 2.6‰. Strength: The 19 strength tests at Site 2 showed that the repaired borehole jack functioned well. Figure 7-c shows strength profiles for the three boreholes made in Site 2. Ice in hole 1 had strengths less than 1.5 MPa at all depths except 0.90 m, where the strength increased to 4.0 MPa (S2_H1, 2.01 m thick). Strengths in the second hole ranged from 5.3 to 6.9 MPa, except for depths 0.60 and 1.50 m, where the strength was less than 1.0 MPa (S2_H2, 1.74 m thick). Both
holes made in level ice had a weak layer of ice at the 0.60 m depth. Strengths in the hummocked ice ranged from 3.0 to 14.0 MPa, with the strongest ice being closest to the top surface (0.30 m depth, S1_H3). The hummocked ice had a weak layer at a depth of 1.20 m, which was well above the bottom of the 4.5 m thick ice in that hole.
6.0
Site 3: Ice Island Fragment
During the summer of 2002, an Ice Island fragment had been sampled off the west coast of Little Cornwallis Island. The massive piece of ice was classified as an Ice Island1 fragment because of its size (Figure 8-a). Judging from its freeboard and bathymetric information of the area, the fragment from the Ice Island was about 30 m thick and, in all likelihood, had been grounded when it was sampled (Johnston et al., 2003-c). It was hoped that the Ice Island fragment would still be near Little Cornwallis Island and available for sampling when the 2003 field program was conducted, one year later, since that type of ice is not usually found in that area.
The helicopter reconnaissance that was conducted after completing measurements in Templeton Bay (2 October) showed that the piece of ice sampled in 2002 was no longer in the area, however an even more massive Ice Island fragment was seen east of LCI (75°18.37´ N, 96°37.10´ W). The newly found fragment was about 200 m long and had cleaved into three pieces (Figure 8-b). The largest of the trio was about 60 m wide and rose roughly 15 m above the surrounding level ice. The small hummocks produced a gently undulating surface, unlike the piece sampled in 2002 (which had an extremely level surface).
(a) fragment sampled in August 2002 (b) fragment sampled in October 2003 Figure 8 Ice Island fragments in vicinity of Little Cornwallis Island
1
The World Meteorological Association (WMO) defines an Ice Island as a large piece of floating ice that has broken away from an Arctic ice shelf, has a thickness from 30 to 50 m and is in excess of a few thousand square metres.
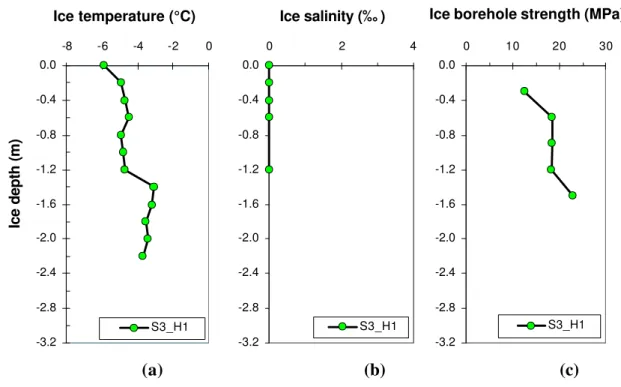
The Ice Island fragment was sampled on the morning of October 4, when the air temperature was –10°C. Since inclement weather was expected in the early afternoon, it had been agreed with the CO that measurements would be completed by noon. Because of reduced light levels, the helicopter was not able to depart the ship until 10:00 hrs, which allowed only two hours for sampling the Ice Island fragment; measurements were restricted to two boreholes. The first borehole was made in a level area of ice and the second hole was made in a hummock, about 5 m away. Both boreholes had an 80 mm thick snow cover and produced cores that were divided into puck like fragments.
Temperature: Ice temperatures were profiled on the core from hole 2. The ice surface was –5.9°C (Figure 9-a), and temperatures in the uppermost 1.20 m of ice ranged from –4.9°C to –4.5°C. The ice temperature increased to –3.1°C at a depth of 1.40 m, and remained at that level throughout the remainder of the 2.20 m long core.
Salinity: The Ice Island fragment had negligible salinity, as shown in Figure 9-b. The salinity profile, along with the thickness of the ice feature, confirmed that the massive piece of ice had indeed fragmented from an Ice Island.
-3.2 -2.8 -2.4 -2.0 -1.6 -1.2 -0.8 -0.4 0.0 -8 -6 -4 -2 0 S3_H1 -3.2 -2.8 -2.4 -2.0 -1.6 -1.2 -0.8 -0.4 0.0 0 2 4 S3_H1 -3.2 -2.8 -2.4 -2.0 -1.6 -1.2 -0.8 -0.4 0.0 0 10 20 30 S3_H1 Ice depth (m)
Ice temperature (°C) Ice salinity (‰ ) Ice borehole strength (MPa)
(a) (b) (c)
Figure 9 Depth-profiles of Ice Island fragment at Site 3
Strength: Due to time constraints, strength tests were only conducted in the uppermost 1.50 m of the first borehole. Strengths in that borehole ranged from 12.5 to 23.1 MPa (Figure 9-c). A considerable amount of cracking activity occurred when testing ice at the 0.30 m depth, which may have been responsible for the top ice surface having reduced strength (12.5 MPa), compared to ice at greater depths. The ice borehole strength was relatively constant at 18.5 MPa between depths 0.60 to 1.20 m (standard deviation of ± 0.1 MPa) and increased to 23.1 MPa at 1.50 m.
7.0
Site 4: Second-year Ice near Pioneer Bay
Since two of the sampling sites had been multi-year ice, efforts were directed towards finding a second-year ice floe to sample. Locating a suitable floe was not straightforward because discriminating second-year ice from multi-year ice is difficult, even for the trained eyes of a CIS Ice Service Specialist (R. DeAbreu, personal communication). In general, second-year ice has a gently undulating surface, has a thinner, more uniform thickness and a larger floe diameter than multi-year ice. Based upon those criteria, a second-year ice floe, several kilometres in diameter and having a gently undulating surface, was identified near Pioneer Bay, Cornwallis Island (Figure 10, 74°56.29´ N, 96°41.23´ W).
Figure 10 Second-year ice near Pioneer Bay, Site 4
Because inclement weather and reduced light levels made flying impossible, it was necessary to use the ship to access a level area of the floe. The ship passed through a considerable amount of upturned rubble that had accumulated along the perimeter of the floe (shown in the background of Figure 10). Once the ship had reached a suitable area of the floe, the gangway was used for site access. Sampling began at 18:00 hrs, and was terminated about 90 minutes later, due to reduced light levels and deteriorating weather (28 kt wind speed and -3.1°C temperature).
Two boreholes were drilled during those 90 minutes of sampling. Ice at the first hole was 1.20 m thick and had a 90 mm snow cover. The core from the first hole held together well in the uppermost 0.40 m, but was fragmented and showed evidence of decay between depths 0.80 to 1.0 m. The second hole was made about 20 m away from the first hole, in a 0.60 m high knoll.
rubbled ice
Initially, the raised surface appeared have been caused by wind blown snow. Upon closer inspection, it was found to be 1.60 m thick hummocked ice with a 130 mm thick snow cover. Obtaining accurate thicknesses for the second-year floe proved difficult because of the “false bottom” effect that caused the ice thickness rod to become caught in voids in the ice.
Temperature: Figure 11-a shows the temperature profile of the 1.20 m thick level ice from hole 1 (S4_H1). The full thickness of ice had near melting, isothermal temperatures. The minimum ice temperature of -0.8°C occurred at the upper surface of ice.
-3.2 -2.8 -2.4 -2.0 -1.6 -1.2 -0.8 -0.4 0.0 -8 -6 -4 -2 0 2 S4_H1 H1 -3.2 -2.8 -2.4 -2.0 -1.6 -1.2 -0.8 -0.4 0.0 0 2 4 S4_H2 H2 Ice depth (m)
Ice temperature (°C) Ice salinity (‰) Ice borehole strength (MPa)
-3.2 -2.8 -2.4 -2.0 -1.6 -1.2 -0.8 -0.4 0.0 0 10 20 S4_H1 S4_H2 H1 H2 (a) (b) (c)
Figure 11 Depth-profiles of second-year ice at Site 4
Salinity: The salinity profile shown in Figure 11-b was measured in hummocked ice from the second hole. The profile shows that the ice had three layers, each with measurably different salinities. The uppermost 0.60 m of ice comprised the first layer, which had salinities less than 0.1‰. The second layer extended from 0.60 to 1.0 m and had salinities from 1.0 to 1.5‰. The third layer consisted of bottom ice, from depths 1.2 to 1.8 m, and had salinities from 2.7 to 2.9‰.
Strength: Figure 11-c shows the borehole strengths of the level ice (S4_H1) and hummocked ice (S4_H2). In the level ice, the highest strength of 11.5 MPa was measured in the surface layer. Ice at depths 0.60 and 0.90 m was considerably weaker, with strengths of 3.4 and 1.4 MPa respectively. The surface layer of hummocked ice had a strength of 12.2 MPa, with higher strengths towards the interior of the ice (17.1 MPa at 0.60 m and 14.0 MPa at 0.90 m). The strength of the bottom layer of hummocked ice decreased to 5.0 and 5.3 MPa at depths 1.20 and 1.50 m, respectively.
8.0
Site 5: Multi-year, Allen Bay
On the evening of 4 October, a weather system had moved in while sampling Site 4. The blizzard-like conditions seriously hampered the fieldwork because they lasted until 8 October. The field program was scheduled to end just before crew change on 9 October. After being ship-bound in Allen Bay for three days, it was decided to try for one last sampling site. Due to the 30 kt winds, an air temperature of -13°C and a wind chill of -37°C it was agreed that, if sampling of the ice were possible, measurements would be completed within two hours. The helicopter departed from the ship’s position in southern Allen Bay on 8 October at 13:40 hrs. An aerial reconnaissance of the Bay was made over the coordinates of the site that had been sampled in August 2002. The reconnaissance showed that, because the ice cover had broken up since it was last sampled, it would not be possible to conduct a second year of measurements on the same ice: young, first-year ice had formed in its place. In lieu of that, the helicopter was re-directed to a resident multi-year ice floe (74°46.91´N, 95°19.83´W) that would allow both old ice and young ice to be sampled without having to move the equipment very far. Figure 12 shows the 50 m diameter, hummocked, multi-year ice floe that was selected as Site 5.
Figure 12 Sites 5 & 6, multi-year and young ice in Northern Allen Bay
There is no record of the floe thickness at Site 5. Since only two hours had been allowed for sampling; in the interest of time, the 50 mm diameter auger was not used to measure the floe thickness. Unfortunately, the floe thickness could not be determined from the ice freeboard because the freeboard was masked by the surrounding rubbled, first-year ice. Two boreholes were drilled in the uppermost two metres of ice. A 2.0 m long core was retrieved from the first hole and a 1.17 m long core from the second hole. The second hole produced a shorter core because parts of it dropped from the barrel after coring and were not able to be retrieved. A 40 mm layer of snow covered the ice at both holes.
Site 5: Multi-year ice
Site 6: Young ice
Temperature: The temperature profile of the floe was measured using the shorter core from the second hole (1.17 m long, Figure 13-a). The top ice had a temperature of -7.4°C. The core temperature increased with increasing thickness, until it reached an isothermal state of near melting temperatures at a depth of 0.80 m. Near melting temperatures persisted throughout the remainder of the core.
-3.2 -2.8 -2.4 -2.0 -1.6 -1.2 -0.8 -0.4 0.0 -8 -6 -4 -2 0 2 S5_H2 -3.2 -2.8 -2.4 -2.0 -1.6 -1.2 -0.8 -0.4 0.0 0 2 4 6 8 S5_H1 Ice depth (m)
Ice temperature (°C) Ice salinity (‰) Ice borehole strength (MPa)
-3.2 -2.8 -2.4 -2.0 -1.6 -1.2 -0.8 -0.4 0.0 0 10 20 30 S5_H1 S5_H2 (a) (b) (c)
Figure 13 Depth-profiles of multi-year ice at Site 5
Salinity: Salinity measurements were performed on the second core (Figure 13-b). The uppermost 0.20 m of ice had negligible salinity (less than 0.1‰). Below that depth the ice salinity was slightly higher, however it remained below 1.0‰.
Strength: The two borehole strength profiles for Site 5 are shown in Figure 13-c. Tests were conducted to a depth of 1.6 m in the first borehole. Tests were only conducted to a depth of 0.90 m in the second borehole, since deeper test depths were obstructed by remnants of the core that had dislodged from the core barrel. The two profiles reveal comparable strengths for each borehole, at similar test depths. Strengths in the first hole ranged from 12.6 to 18.3 MPa, compared to strengths of 13.3 to 21.0 MPa in the second hole. Strengths at two of the three test depths had a standard deviation of only 0.5 to 0.6 MPa (depths 0.30 and 0.90 m), whereas the standard deviation at the 0.60 m test depth was 4.0 MPa.
9.0
Site 6: Young Ice, Allen Bay
Upon completing two hours of sampling at Site 5, the ship sent a message that, due to the improved weather, sampling could continue for another 45 minutes (air temperature -12°C, with decreased wind). Efforts were directed towards sampling the young ice surrounding the multi-year ice floe (Site 6, 74°46.91´N, 95°19.83´W). The young ice was light grey and had considerable surface roughness, at the micro-scale. Because the ice was thin, three boreholes were able to be drilled and tested in the allotted 45 minutes. The holes were made about 10 m apart, in an arc-like pattern around the perimeter of the multi-year floe. The ice in holes 1 and 2 was 0.41 and 0.47 m thick, and 0.61 m thick in the third hole. The thicker ice in the third hole was likely due to rafting because, part way through the coring process, a void was encountered that caused the corer lurch downwards.
Temperature: An ice temperature profile was measured using the core from hole 2 (Figure 14-a). Because of the fragmented condition of the 0.40 m long core, temperatures were not measured at uniform intervals. The ice surface temperature was -4.9°C, whereas ice at depths 0.30 and 0.40 m was near melting.
-3.2 -2.8 -2.4 -2.0 -1.6 -1.2 -0.8 -0.4 0.0 -8 -6 -4 -2 0 2 S6_H2 H2 -3.2 -2.8 -2.4 -2.0 -1.6 -1.2 -0.8 -0.4 0.0 0 2 4 6 8 10 12 S6_H1 H1 Ice depth (m)
Ice temperature (°C) Ice salinity (‰) Ice borehole strength (MPa)
-3.2 -2.8 -2.4 -2.0 -1.6 -1.2 -0.8 -0.4 0.0 0 1 2 3 4 5 S6_H1 S6_H2 S6_H3 H1 H2 H3 (a) (b) (c)
Salinity: The 0.41 m long core from the first hole was used to profile the ice salinity (Figure 14-b). Again, the core was fragmented and did not allow measurements to be conducted at uniform intervals. The salinity of the top ice was 10.5‰, decreased to 6.3‰ at depth 0.10 m and to 2.9‰ at depth 0.20 m. Ice salinity increased towards the bottom of the ice, to 6.2‰2. Strength: Strength tests in each of the three boreholes could be performed at a depth of 0.30 m only (Figure 14-c). Strengths of 1.9, 0.7 and 0.2 MPa were measured in holes 1, 2 and 3 respectively, with the highest strength being recorded in the first hole. Although ice in the second hole was the thickest, its reduced strength likely resulted from the void that had been felt during coring.
10.0 Summary of Ice Property Measurements during Freeze-up
This report documents the properties of four different ice types: multi-year ice, second-year ice, first-year ice and an Ice Island fragment. Table 1 summarizes the maximum, minimum and standard deviation of the ice thickness, borehole strength, salinity and temperature for the six sites, which are categorized by ice type.
Multi-year ice (Sites 1, 2 and 5): The multi-year ice at Site 1, Templeton Bay, consisted of jumbled blocks of old ice. Since satellite imagery indicated that the ice cover had been present for about one month only (since 7 September 2003), the blocks were only beginning to consolidate. The thickness of the ice cover was not uniform, which is to be expected considering its rough surface topography. The ice thickness was 1.08 m in two boreholes, and 2.43 m thick only 8 m away. Temperatures throughout the full thickness of ice were near melting. The ice salinity ranged from 0.4 to 4.7‰. The strength profile shown in Figure 15-a was obtained by averaging the measured strengths at the same depth in each borehole. The average ice borehole strength at Site 1 ranged from 1.4 to 7.1 MPa, with a depth-averaged standard deviation of ±2.1 MPa. The recently consolidated multi-year ice at Site 1 was the thinnest, the warmest and the weakest of the multi-year floes sampled during the field program. Sites 2 and 5 consisted of multi-year ice floes with prescribed boundaries. The floe at Site 2 was 300 m in diameter and Site 5 was about 50 m in diameter. Ice thickness at Site 2 ranged from 1.74 to 4.5 m, salinities were from 1.5 to 3.6‰ and ice temperatures from -4.2°C to near melting. The profile of average borehole strength in Figure 15-b shows that the ice at Site 2 had strengths from 2.6 to 11.3 MPa, with a depth-averaged standard deviation of ±3.5 MPa.
2
Obtaining accurate salinity measurement from young ice is especially difficult, even at cold temperatures, since the brine drains from the ice quickly. As a result, the actual in situ salinity of the ice may be higher than measurements show.
Table 1 Properties Measured during Freeze-up Range (minimum / maximum) sampling date location ice thickness (m) borehole strength (MPa), ± standard deviation ice temp. (°C) salinity (‰) description
Site 1 2-Oct Templeton Bay (75°29.15N, 96°23.32W)
1.08 / 2.43 1.1 / 12.4 (±2.1)
-1.2 / 0 0.4 / 4.7 MYI: highly rubbled ice in central Templeton Bay that is in the process of consolidating
Site 2 3-Oct McDougall Sound (75°20.92N, 96°42.43W)
1.74 / 4.5 0.2 / 14.0 (±3.5)
-4.2 / 0 1.5 / 3.6 MYI floe in landfast ice in McDougall Sound; floe was 300 m in diameter; had a rubbled perimeter and smooth interior
Site 5 8-Oct Northern Allen Bay (74°46.91N, 95°19.83W)
1.98+ 12.6 / 21.1 (±1.4)
-7.4 / 0 0.0 / 0.9 MYI: northern Allen Bay; 50 m diameter piece of old ice; hummocked surface
Site 4 4-Oct McDougall Sound (74°56.29N, 96°41.23W)
1.20 / 1.60 0.3 / 17.1 (±5.6)
-0.8 / 0 0.0 / 2.9 SYI: ship passes through 200 m of rubbled ice, then into an area of level area of ice with some small hummocks where the sampling was done.
Site 6 8-Oct Northern Allen Bay (74°46.90N, 95°19.82W)
0.41 / 0.61 0.2 / 1.9 (±0.9)
-4.9 / 0 2.9 / 10.5 FYI: holes made in young ice about 10 m from MYI floe of Site 5. Holes 1 and 3 showed level ice and hole 2 showed rafted ice (with a smooth surface).
Site 3 4-Oct McDougall Sound (75°18.37N, 96°37.10W)
8.0+ 12.5 / 23.1 (±1.5)
-5.9 /
-3.1 0.0/0.0 Ice Island ice, about 200 m long. One side rises about 15 m above surrounding ice while other side sloped to ice edge; split into three pieces
-2.7 -2.4 -2.1 -1.8 -1.5 -1.2 -0.9 -0.6 -0.3 0.0 0 5 10 15 20 25 S1, 2 to 3 holes h = 1 to 2.5 m 3 measurements at 0.30 m depth -2.7 -2.4 -2.1 -1.8 -1.5 -1.2 -0.9 -0.6 -0.3 0.0 0 5 10 15 20 25 S2, 3 holes h = 1.7 to 4.5 m -2.7 -2.4 -2.1 -1.8 -1.5 -1.2 -0.9 -0.6 -0.3 0.0 0 5 10 15 20 25 S5, 2 holes h = 2.0+ m
Ice borehole strength (MPa)
Ice depth (m)
(a) Site 1 MYI (b) Site 2 MYI (c) Site 5 MYI Figure 15 Ice borehole strength profiles for three multi-year ice sites
The multi-year ice at Site 5 had the coldest ice surface temperature (-7.4°C) however, like the other floes, it approached near melting temperatures below a depth of 0.60 m. Site 5 had a salinity of less than 1.0‰ in its uppermost 1.2 m. The profile of averaged borehole strengths ranged from 12.6 to 21.0 MPa, with a depth-averaged standard deviation of ±1.4 MPa (Figure 15-c). Of the sampled multi-year floes, Site 5 was the most competent and had boreholes with similar strengths, for comparable depths. It is noteworthy that the multi-year ice at Site 5 had integrity, in spite of having near melting temperatures below a depth of 0.60 m.
Second-year ice (Site 4): The measured thickness of the second-year ice floe was 1.2 and 1.6 m. It had a minimum temperature of -0.8°C and salinities from 0 to 2.9‰. Those measurements are in agreement with other, limited data on second-year ice (Bjerklund et al., 1985, Johnston et al., 2003-c). The strength of the second-year ice at Site 4 ranged from 2.6 to 11.9 MPa and decreased steadily with increasing depth (Figure 16-e). Strength in the surface layer of ice was comparable in both boreholes (11.5 and 12.2 MPa at the 0.30 m depth), however strengths in the intermediate layers had the highest standard deviation of any of the ice sites sampled during the field program (±8.9 and ±9.7 MPa at the 0.60 and 0.90 m depths, respectively).
-2.7 -2.4 -2.1 -1.8 -1.5 -1.2 -0.9 -0.6 -0.3 0.0 0 5 10 15 20 25 S4, 2 holes h = 1.2 to 1.6 m -2.7 -2.4 -2.1 -1.8 -1.5 -1.2 -0.9 -0.6 -0.3 0.0 0 5 10 15 20 25 S6, 3 holes h = 0.4 to 0.6 m
Ice borehole strength (MPa)
Ice depth (m) -2.7 -2.4 -2.1 -1.8 -1.5 -1.2 -0.9 -0.6 -0.3 0.0 0 5 10 15 20 25 Island, 4 holes (2 years) h = 30+ m
(d) Site 3 Island (e) Site 4 SYI (f) Site 6 FYI Figure 16 Ice borehole strength profiles of sites sampled during freeze-up
Young, first-year ice (Site 6): Only young first-year ice was available for sampling during the field program (0.41 to 0.61 m thick). Although its top surface was cold (-4.9°C), the limited measurements showed that, by a depth of 0.30 m, the ice had near melting temperatures. The ice salinity ranged from 10.5 to 2.9‰. Strength tests were conducted at only one test depth (0.30 m). Figure 16-f shows the average borehole strength of 0.9 MPa, with a depth-averaged standard deviation of ±0.9 MPa.
Ice Island fragment (Site 3): An Ice Island fragment more than 30 m thick was sampled during the program. The uppermost two metres of ice had negligible salinity and temperatures from -5.9 to -3.1°C. Strength measurements were made in one hole only (Figure 16-d), however those results were in good agreement with strength measurements made on an Ice Island fragment in June 2002 (three boreholes tested). The depth-averaged borehole strengths shown in Figure 16-d take into account both sets of measurements. Strengths in the uppermost 0.60 m of ice ranged from 13.4 to 18.4 MPa and increased with increasing depth. The surface layer of ice had the lowest strengths, and showed considerable cracking activity during testing. The surface strength of the Ice Island fragment was comparable to multi-year ice at Site 5 (Figure 16-c). Below a depth of 0.90 m, strengths upwards of 21 MPa were measured. The depth-averaged standard deviation in strength was ±1.8 MPa based upon measurements from 2002 and 2003.
11.0 Compilation of Four Years of Strength Measurements
To date, three years of strength measurements have been made on decaying Arctic first-year ice and one season of strength measurements on decaying old ice. Figure 17 shows results from those past field programs, in terms of the depth-averaged strength for individual boreholes at each site. Circular markers were used to designate first-year ice data, without differentiating between individual sites, all of which were located in Barrow Strait and McDougall Sound. The summer strengths of second-year ice (square markers) were obtained from bona fide, landfast second-year ice in Templeton Bay. The summer measurements on multi-year ice (triangular markers) were from floes in Wellington Channel. Summer measurements on an Ice Island fragment were made in June only (square marker with cross).
The first-year ice and second-year ice both show a well-behaved trend of decreasing strength as the summer progressed. The multi-year ice measurements for June and August were from different floes, yet the limited results reveal a slight decrease in the strength of multi-year ice during summer, albeit much less than in first-year and second-year ice. Recent results from the measured strengths of first-year and old ice during freeze-up are also included in Figure 17. The October results illustrate the increased scatter in strength data that characterizes second-year and multi-year ice during freeze-up. In comparison, there was minimal scatter in strength measurements made in summer.
0 5 10 15 20 25 30 35 50 100 150 200 250 300
Ice borehole strength, depth-averaged (MPa)
.
June July Aug Sep April
Feb- Mar
mid-winter borehole strength
Julian Day FYI SYI MYI Ice Island Julian Day May Oct S5 S2 S1/S2
Figure 17 Four years of ice borehole strength measurements (individual multi-year ice sites referred to as S1, S2 and S5)
The October strengths of second-year ice reported in Figure 17 were obtained from two boreholes in the same floe. One of the boreholes had a strength comparable to the second-year ice sampled in August (5.4 MPa), while the other borehole had a higher strength (10.7 MPa) than past measurements. Measurements of multi-year ice during freeze-up showed the two highest strengths were associated with ice at Site 5 (16 to 18 MPa). The strength of hummocked, multi-year ice at Site 2 (9.3 MPa) was comparable to the strength of hummocked second-year ice at Site 4 (10.7 MPa). Multi-year ice with strengths below 5 MPa came from two boreholes in Site 2 and two boreholes in the recently consolidated multi-year ice at Site 1. Strengths of the Ice Island fragments were comparable in June and October (18.2 MPa).
12.0 Effect of Ice Decay on Strengths Measured during Freeze-up
This field study showed that the properties of multi-year ice and second-year ice can be very different. There can also be considerable variability in the same floe. The non-uniform properties between different types of ice, but also in the same ice types, partly resulted from the large voids that permeated the ice. Cores retrieved from second-year and multi-year ice floes during freeze-up were often riddled with voids. Quite surprisingly, the voids were not restricted to the uppermost layers of ice. The voids occurred well below the ice surface and, frequently, their long axis was oriented in the horizontal direction. Take, for example, the multi-year ice at Site 2, which had voids at a depth of 1.40 m (Figure 18-a). The decrease in ice strength that occurred at a depth of 1.50 m is believed due to those voids (Figure 18-b).
-2.0 -1.6 -1.2 -0.8 -0.4 0.0 0 4 8 12 16 20 Borehole strength (MPa)
Ice depth (m)
S2_H2
see core
ice thickness
(a) core showing porous ice at 1.40 m depth (b) strength of core shown at left Figure 18 Core of multi-year ice at depth 1.40 m and the corresponding strength profile
Another example of the effect that voids have on ice strength was observed in the second-year ice from Site 4. Ice in the first borehole was 1.20 m thick and had voids at a depth of 0.60 m. Ice from the second borehole, made about 20 m away, was 1.60 m thick but did not contain voids at that depth. The voids in the first borehole affected the its strength at a depth of 0.60 m, which was only 3.4 MPa, whereas the borehole without voids had a strength of 17.1 MPa at that same depth.
Ice cores provided an indication of the effect that small-scale voids (of the order of tens of centimetres in diameter) had on the ice strength. The cusps of ice overturned by the ship during transit revealed that some floes of old ice had large-scale chasms that were several metres long and extended horizontally into the ice. Figure 19 shows two examples of chasms that were present in 3.0 to 3.5 m thick multi-year ice. Note the black metre stick that was thrown over the edge of the ship to provide a scale. Interestingly, the extensive voids were not present at the same depth everywhere throughout the overturned cusps. That may explain why ice cores from the same floe, but only metres apart, were sometimes riddled with voids, whereas others were not. It also partly explains the large standard deviations in strength that characterized boreholes in the same floe.
One possible explanation for the large chasms is that they result from melt ponds whose surface has been covered with a crust of ice, up to 0.50 m thick. As the ship overturned the ice cusps, the pond water beneath the crust of newly formed ice would have drained, exposing the large, empty voids. The 0.40 to 0.60 m thick young, first-year ice at Site 6 showed that a comparable thickness of recently frozen ice could have also covered the surface of the melt ponds.
(a) 3.0 m thick cusp (b) 3.5 m ice cusp
Figure 19 Extensive decay shown in cusps of multi-year ice overturned in Allen Bay (metre stick shown for scale)
13.0 Conclusions
This study provided a first look at the properties of old ice during freeze-up. Temperature measurements showed that the uppermost 0.40 m of ice had begun to show signs of cooling. Although the previous month of subzero air temperatures had affected the ice surface layer, the ice remained at near melting, isothermal temperatures below that depth. Despite the warm ice temperatures, the old ice could be quite strong. One borehole made in second-year ice and two boreholes in multi-year ice showed strengths of 10 to 17 MPa. In comparison, nearby boreholes that were made in those floes had comparable temperatures, but strengths of only 1 to 5 MPa. One of the most useful outcomes of this study was to document the extreme variability that can characterize not only different floes of ice, but also the same floe. Results from the second-year ice floe and two of the three multi-year ice floes showed that competent and weak ice can, and do, co-exist during freeze-up. It is very important to note that surface conditions are not always indicative of ice strength; what appeared to be competent, multi-year ice had very different strengths in its three boreholes. That type of extreme variability was observed over just a few square metres of ice.
It was suggested that part of the observed variability resulted from summer ice decay. Small-scale voids, tens of centimetres wide, were frequently observed in the extracted ice cores. Large-scale chasms were evident in the overturned ice cusps. Both types of voids have direct bearing on ice strength. A rigorous explanation for them and how often they characterize old ice floes will require further study.
Information gathered during this field study showed that the decay process of second-year and multi-year ice is extremely complex. Multi-year ice in October can have strengths upwards of 18 MPa or less than 5 MPa, both of which characterized ice with near melting, isothermal temperatures. In addition, it was shown that second-year ice is not always weaker than multi-year ice. In one case, second-multi-year ice had a higher depth-averaged, borehole strength than the strengths measured in five boreholes in multi-year ice. In addition, the borehole strength profiles of second-year and multi-year ice showed that even competent ice can have weak layers of ice throughout its interior; layers that likely result from ice decay.
14.0 Future Work
In their report, Timco and Johnston (2003) stated that the three years of measurements on decaying year ice supported using a summer bonus for medium year and thick first-year ice in the Arctic Ice Regime Shipping System (AIRSS), provided the ice has 10% of its mid-winter strength (as indicated by the Ice Strength Charts). They suggested, tentatively, that the same approach be used to account for decayed second-year ice. Future work was needed to be more conclusive on the matter of second-year ice. With respect to multi-year ice, they stated there was no basis for using a summer bonus factor; there were not enough data to support it. Although it is beyond the scope of this study, data acquired on old ice properties during freeze-up will be used to assist in determining when the bonus factor for first-year ice and second-year ice should be removed in the fall. Realizing that the 2003 field program was one of the few studies that measured the strength of old ice during freeze-up, it is likely that suggestions relating to removing the summer bonus factor for second-year ice in AIRSS will also be tentative and that more measurements will be needed before the Regulations can address the decay of multi-year ice.
15.0 Acknowledgements
This work was funded by Transport Canada. Sincere thanks are extended to V. Santos-Pedro for the interest and support he has shown CHC during the three years of ice decay measurements. The October 2003 field program would not have been possible without the enthusiastic assistance of the Canadian Coast Guard. Particular thanks go to Commanding Officer Marsden, P. Mosher, M. Spates, ‘Jim’ and the entire crew of the LOUIS S. ST-LAURENT for making the fieldwork an enjoyable and unforgettable experience. Thanks also to J. Ouellet for his help during the planning stages of the program. Many thanks to D. Boudreau and the Design and Fabrication Services of the National Research Council for providing CHC with a first-rate ice corer that made the ice work run smoothly. Thanks also to the Canadian Ice Service for supplying the Radarsat imagery and expertise that allowed potential sites to be identified prior to conducting the fieldwork.
16.0 References
AIRSS (1996) Arctic Ice Regime Shipping System (AIRSS) Standards, Transport Canada, June 1996, TP 12259E, Ottawa. Ont., Canada.
Bjerkelund, C.A., Lapp, D.J., Ramseier, R.O. and Sinha, N.K. (1985) The Texture and Fabric of Second-Year Sea Ice Cover at Mould Bay, Prince Patrick Island, NWT, April 1983. Proc. IEEE Int. Geoscience and Remote Sensing Sym.(IGARRS), Amherst, Vol. 1, pp. 426 – 431. Johnston, M. and Sinha, N.K. (2001) Physical Properties of Natural Sea Ice: Implications for
Single- and Multi-polarization SAR Images. Proc. 16th International Symposium on Okhostk Sea and Sea Ice, Mombetsu, Japan, pp. 463-470.
Johnston, M., Frederking, R. and Timco, G.W. (2003-a) Properties of Decaying First-year Sea Ice at Five Sites in Parry Channel. Proc. 17th International Conference on Port and Ocean Engineering under Arctic Conditions, POAC’03, Trondheim, Norway, Vol. 1, pp. 131-140. Johnston, M., Timco, G. and Frederking, R. (2003-b) “In Situ Borehole Strength Measurements
on Multi-year Sea Ice” in Proc. 13th International Offshore and Polar Engineering Conference, Honolulu, Hawaii, 25 - 30 May 2003, pp. 445 - 452.
Johnston, M. Frederking, R., and Timco, G. (2003-c) Property Changes of First-year Ice and Old Ice during Summer Melt. NRC Report CHC-TR-010, TP14098E, Ottawa, Ont., Canada. Masterson, D (1996) Interpretation of In Situ Borehole Ice Strength Measurement Tests. Can. J.
Civ. Eng. Vol. 23. pp. 165- 179.
Timco, G.W. and Johnston, M. (2003) Ice Decay Boundaries for the Ice Regime System: Recommendations from a Scientific Analysis. NRC Report CHC-TR-009, Ottawa, Ont., Canada.
Timco, G.W., Kubat, I. and Johnston, M. (2004) Scientific Basis for the Ice Regime System: Final Report. Technical Report CHC-TR-20, March, 2004, 37 p.
Sampling Methodology
Measurements conducted at each of the sites included freeboard (where applicable), snow thickness, ice surface temperature, ice thickness, ice salinity, ice temperature and ice borehole strength. A motor driven, fibreglass corer was used to make three boreholes in the ice (150 mm diameter) about 1.5 to 2.0 m apart (see Figure A-1). The ice thickness, freeboard and snow depths were measured at each borehole. When possible, a full thickness core was retrieved from the ice. When the ice was too thick to core completely, a two-metre long ice core was taken. Core 1
The first ice core was used to obtain a profile of ice temperature. The contents of the core barrel were emptied into a wooden holder. A thermal probe was inserted into small holes made in the core at depth intervals of 200 mm. Since the length of the core barrel was only 0.90 m, thicker ice was retrieved by taking multiple cores. Temperatures of the individual core pieces were measured as soon as they had been removed from the core barrel to minimize the effects of air temperature and solar radiation on the core. A Fluke 73 multimeter with an attached 80T-150U temperature probe was used measure the ice temperature (accuracy of ±0.5°C).
0.15 m bore hole test depths ICE ICE freeboard snow depth snow depth ice thickness ice coreremoved from borehole borehole #1: ice temperature profile borehole #2: salinity profile borehole #3: microstructure
Individual Test Station (profile view) Test Matrix (plan view) 0.30 m 0.60 m 0.90 m 1.20 m 1.50 m 1.80 m 2.10 m 2.40 m
Figure A-1. Test matrix for ice borehole strength measurements
The core from the second borehole was used to profile the ice salinity. Discs about 20 mm thick were cut from the core at intervals of 200 mm. The sections were cut as quickly as possible to minimize brine drainage. Samples were promptly bagged, transported to the ship and left to melt at room temperature. The salt content of the melt water was later measured with a calibrated, Orion model 105A portable conductivity meter (accuracy 0.5%).
Core 3
The core from the third borehole was not used for measurements. When possible, the third core was placed in a cooler and transported to the ship. At the end of the field program, the cores were shipped to the laboratory at the Canadian Hydraulics Centre of the National Research Council in Ottawa, Ontario. Upon arriving in Ottawa, the cores were checked and placed in cold storage, where they remain for future microstructural studies.
Borehole Jack Tests
Each time a core was removed from the ice, each remaining hole was used to profile the ice strength. The in situ confined compressive strength of the ice was measured using a borehole jack system. The borehole jack system had two opposing mobile platens (indentors) that penetrate the ice (Figure A-2). The displacement of the indentors is measured by two linear variable displacement transducers (LVDT) and the oil pressure needed to extend the indentors is measured with a pressure transducer.
Borehole jack tests were conducted at depth intervals of 0.30 m until the bottom of the ice (or core hole) was reached, as shown in Figure A-1. In general, borehole jack tests were only conducted a maximum depth of 2.4 m in each hole. When positioned at the specified test depth, the borehole jack indentors were extended. A data logger was used to record the platen displacement and oil pressure, which was displayed on a keypad to monitor each test (to avoid extending the indentors too far, thereby damaging the end plates).
Normally, borehole strength tests at each depth continued until the pressure gauge showed that the oil pressure had stabilized, the pressure had decreased or the full extension of the jack had been approached. The indentor platens were then fully retracted, the jack was rotated 90° and lowered to the next test depth. The jack was rotated 90° between tests to avoid the region of ice that was damaged during the previous test.
Details of Strength Analysis
Borehole jack data from each test were used to generate three plots, (a) in situ ice pressure versus time, (b) indentor penetration versus time and (c) in situ ice pressure versus indentor penetration. Ice pressure is defined as 60% of the oil pressure and indentor penetration is defined as one-half the diametrical displacement of the borehole jack (an average of the two indentor displacements).
A standardized approach was needed to compare results from the borehole jack tests. Since the maximum pressure may not be captured during the tests (due to the limit of the stroke ram and/or concern about excessively high oil pressures), a common factor was used to compare all tests. That factor was defined as the pressure at a standard indentor penetration of 3 mm. That methodology was appropriate for quantifying the decay of first-year sea ice (Johnston et al., 2001) however comparing borehole strengths of decaying second-year and multi-year ice may not be so straightforward, as discussed subsequently.
Figure A-3 shows ice pressure-penetration curves for multi-year ice from Site 2 (hole 3) for depths 0.30 to 2.40 m. A vertical line was used to show the ice pressure at a penetration of 3 mm, since that was the value used to compare results from the different borehole jack tests in this report. The figure illustrates the increase in pressure that occurs as the indentor penetrates the ice. Tests at every depth resulted in a steady increase in pressure during the first 3 mm of indentor penetration. In each case, the well-behaved pressure-penetration curves and measured strengths are typical of competent multi-year ice, in which the pressure at 3 mm is a good representation of the maximum pressure.
Figure A-4 shows three ice pressure-penetration curves for recently consolidated multi-year ice in Templeton Bay (Site 1, hole 2). During the tests, the pressure increased erratically as the indentor penetrated the ice. That type of behavior shows the reduced integrity of the ice and the ease with which it was compressed during indentation. Two of the strength tests (0.30 and 0.60 m depths) reached a maximum pressure before the indentor penetrated 3 mm, whereas ice pressure at a depth of 0.90 m steadily increased after a penetration of 3 mm was reached.
-1 4 9 14 19 24 0 5 10 15 20 25 Penetration (mm)
Ice Pressure (MPa)
30 60 90 120 150 180 210 240
Figure A-3 Pressure-penetration curves for multi-year ice at Site 2 (hole 3)
-1 0 1 2 3 4 5 6 0 5 10 15 20 25 Penetration (mm)
Ice Pressure (MPa)
30 60 90
Figure A-4 Pressure-penetration curves for multi-year ice at Site 1 (hole 2, recently consolidated ice)
After plotting pressure-penetration curves for each borehole, the ice pressure was documented for a penetration of 3 mm, realizing that the pressure may have been greater or less than the maximum pressure measured during testing.
Since the borehole jack did not have a servo control, tests conducted during the field program resulted in a wide range of stress rates. It was necessary to compensate the measured strengths for the rate-effect, since rate has been shown to have direct bearing on the strength measurements (Sinha, 1986; 1997). The pressure at 3 mm penetration was then compensated for the rate-effect. The exponential effect of stress rate on ice strength is described by Equation (1), after Sinha (1986); θ σ σ = m c m c SR SR (1) where
σc = compensated ice strength
σm = measured ice strength (in situ ice borehole strength)
SRc = stress rate used for standardization SRm = measured stress rate
θ = exponent governing the rate-effect
Because borehole jack tests in decaying first-year ice resulted in stress rates clustered around 1.0 MPa/s (Johnston et al., 2003) that was the rate selected for applying Equation (1) to results presented in this report. The exponent used in Equation (1) was 0.25, which is a value between that representative of cold and temperate ice (Johnston et al., 2003). Because the strength of decaying first-year ice did not lie neatly along a single curve, it was concluded that the seasonal decrease in ice strength was predominantly due to changes in the ice properties, rather than a stress rate-effect.
Johnston, M., Frederking, R. and Timco, G.W. (2003) Properties of Decaying First-year Sea Ice at Five Sites in Parry Channel. Proc. 17th International Conference on Port and Ocean Engineering under Arctic Conditions, POAC’03, Trondheim, Norway, Vol. 1, pp. 131-140. Sinha, N.K. (1986) The Borehole Jack: Is it a Useful Tool? Proc. of 5th Int. Offshore
Mechanics and Arctic Engineering Symposium (OMAE). Tokyo, Japan. 13 – 17 April 1986. Vol. IV. pp. 328 – 335.
Sinha, N.K. (1997) Borehole In Situ Indentation Tests in Floating Sea Ice at High Temperatures. Proc. 9th Int. Conf. on Fracture (ICF9), 1 – 5 April 1997. Sydney, Australia. Vol. 5. pp. 2595 – 2602.