• Aucun résultat trouvé

Influence of Tasks Duration Variability on Task-Based Runtime Schedulers

N/A
N/A
Protected

Academic year: 2021

Partager "Influence of Tasks Duration Variability on Task-Based Runtime Schedulers"

Copied!
19
0
0

Texte intégral

(1)

HAL Id: hal-01716489

https://hal.inria.fr/hal-01716489v2

Submitted on 28 Feb 2018

HAL is a multi-disciplinary open access

archive for the deposit and dissemination of

sci-entific research documents, whether they are

pub-lished or not. The documents may come from

L’archive ouverte pluridisciplinaire HAL, est

destinée au dépôt et à la diffusion de documents

scientifiques de niveau recherche, publiés ou non,

émanant des établissements d’enseignement et de

Influence of Tasks Duration Variability on Task-Based

Runtime Schedulers

Olivier Beaumont, Lionel Eyraud-Dubois, Yihong Gao

To cite this version:

Olivier Beaumont, Lionel Eyraud-Dubois, Yihong Gao. Influence of Tasks Duration Variability on

Task-Based Runtime Schedulers. [Research Report] INRIA. 2018. �hal-01716489v2�

(2)

Influence of Tasks Duration Variability on

Task-Based Runtime Schedulers

Olivier Beaumont, Lionel Eyraud-Dubois, Yihong Gao

Inria Bordeaux Sud-Ouest

LaBRI, Universit´

e de Bordeaux

Email: firstname.lastname@inria.fr

February 28, 2018

Abstract

In the context of HPC platforms, individual nodes nowadays consist

in heterogenous processing resources such as GPU units and multicores.

Those resources share communication and storage resources, inducing

complex co-scheduling effects, and making it hard to predict the exact

duration of a task or of a communication. To cope with these issues,

runtime dynamic schedulers such as StarPU have been developed. These

systems base their decisions at runtime on the state of the platform and

possibly on static priorities of tasks computed offline. In this paper, our

goal is to quantify performance variability in the context of HPC

hetero-geneous nodes, by focusing on very regular dense linear algebra kernels.

Then, we analyze the impact of this variability on a dynamic runtime

scheduler such as StarPU, in order to analyze whether the strategies that

have been designed in the context of MapReduce applications to cope

with stragglers could be transferred to HPC systems, or if the dynamic

nature of runtime schedulers is enough to cope with actual performance

variations.

1

Introduction

In the context of HPC platforms, accelerators such as GPUs are more and more

commonplace in processing nodes due to their massive computational power,

usually beside multicores.

This induces a dramatic increase in the number

and variety of HPC nodes, due to the combination of available resources and

the use of both multicores and accelerators. In this context, developing and

maintaining optimized hand-tuned applications for all these architectures turns

out to be extremely costly. Moreover, CPUs and GPUs of the same node share

many resources (caches, buses,...) and exhibit complex memory access patterns

(due to NUMA effects in particular). Therefore, it becomes extremely difficult

to predict precisely the durations of both tasks and data transfers, on which

(3)

traditional static offline schedulers rely to allocate tasks, even for very regular

applications such as linear algebra kernels.

This situation favors dynamic scheduling strategies where decisions are made

at runtime based on the (dynamic) state of the machine and on the (static)

knowledge of the application. The state of the machine can be used to allocate

a task close to its input data, whereas the knowledge of the application can be

used to favor tasks that are close to the critical path. In the recent years,

sev-eral such task-based runtime systems have been developed, such as StarPU [1],

StarSs [2], or PaRSEC [3]. All these runtime systems model the application as

a Directed Acyclic Graph (DAG), where nodes correspond to tasks and edges

to dependencies between these tasks. These runtime systems are typically

de-signed for linear algebra applications, and the task typically corresponds to a

linear algebra kernel whose granularity is well suited for all types of resources.

At runtime, the scheduler knows (i) the state of the different resources (ii) the

set of tasks that are currently processed by all non-idle resources (iii) the set of

ready (independent) tasks whose dependencies have all been resolved (iv) the

location of all input data of all tasks (v) possibly an estimation of the

dura-tion of each task on each resource and of each communicadura-tion between each

pair of resources and (vi) possibly priorities associated to tasks that have been

computed offline using heuristics like HEFT [4] or HeteroPrio [5, 6].

In the context of MapReduce Applications running in datacenters, the

vari-ability of task running time is a well identified problem, for which several

sophis-ticated strategies have been designed. They are in general based on the

identifi-cation of slow tasks and their re-execution [7–9]. Re-execution is made easy by

the use of distributed file systems based on replication such as HDFS [10]. The

impact of stragglers and more generally of tasks that last longer than expected

has been recently analyzed in [11] and our goal is to build the counterpart of

this study in the context of HPC platforms. Indeed, this phenomena has been

the object of very few studies in the context of dynamic schedulers on HPC

platforms. It has however been observed and studied in the context of static

schedulers. In [12, 13], it has been proved both in theory and practice that

when the allocation and the schedule of tasks onto resources are computed in

advance, the impact of unexpectedly long tasks is important. Dynamic runtime

schedulers have been designed to cope with this variability and to overcome the

limitations of static schedules, and are expected to perform much better in

pres-ence of tasks duration variability, since a long task will delay tasks that depend

upon it, but not independent tasks statically allocated onto the same resource.

Nevertheless, in runtime dynamic systems, the performance on a given kernel

on a given resource is assumed to be constant [14], although it has already been

noticed in [15] that some variability can be observed on task durations.

Our goals in this paper are (i) to study the variability of task durations

using a dynamic scheduler like StarPU [1], on an typical HPC node consisting

of GPUs and CPUs and (ii) to understand the impact of this variability on the

makespan of an application. In our context and in order to deal with

applica-tions that consist in a large number of tasks belonging to few categories, and

therefore to rely of significant statistics, we choose to concentrate on Cholesky

(4)

and LU factorizations, for which very efficient implementations over StarPU are

provided in the Chameleon library [16]. Due to lack of space, we only present

Cholesky results in present paper and we refer the interested reader to [17].

Moreover, to understand the impact of task length variability on the makespan,

we rely of the ability [14] to simulate accurately the execution on StarPU

appli-cations on top of Simgrid [18], a versatile simulator of distributed systems.The

rest of this paper is organized as follows. We briefly survey related works and

HPC background in Section 2. We analyze in detail tasks duration variability

in Section 3 and Section 4, and its impact on the makespan in Section 5, before

giving concluding remarks in Section 6.

2

Background

Related Works:

The problem of tasks duration variability has received

sig-nificant attention in the context of distributed computing, first in Grid

plat-forms [19] and later in Cloud computing platplat-forms in the context of MapReduce

environment [20]. Some of the work in this area consists one one hand in

analyz-ing the variability of task execution times and tryanalyz-ing to explain it [21, 22]. On

the other hand, several strategies have been designed to mitigate the effect of

variability. Some works propose improved static scheduling strategies [9, 23, 24]

to find an assignment of tasks onto resources that minimizes the influence of

variability. Others advocate the use of preventive task replication [25, 26] for

some or all tasks of a job. Finally, studies have shown the interest of relying on

duplication for tasks which last longer than expected [27, 28]. HPC platforms

are thought of as being more predictable than Grid or Cloud platforms, and this

problem has not been studied as much in HPC contexts. Stochastic task model

where task durations are modeled with a (often Gaussian) distribution [12, 29],

and the objective is to compute static schedules with minimal makespan and/or

standard deviation [13]. Recent work [30] has analyzed the interest of two-phase

robust scheduling, where the first phase is static and the second phase may react

dynamically to actual execution times. However, to the best of our knowledge,

there has been no attempt at characterizing the effect of the unpredictability

of task execution times on the performance of dynamic schedulers as they are

used in HPC runtime systems.

Runtime Systems:

In this paper, we consider applications that use the

StarPU [1] runtime system, and we execute them on a heterogeneous node,

consisting of several CPU and GPU units. StarPU uses a Sequential Task Flow

representation of applications, in which the computations are described as a set

of tasks, with input and output data that describe dependences between tasks.

The application developer provides different implementations for each task, so

that they can be executed on a CPU or on a GPU. StarPU automatically

in-fers dependencies between tasks based on which data they require, and uses this

information both to schedule tasks on the appropriate processing unit, and to

organize data transfers between the different memory units (main memory and

(5)

memory of the GPUs). The execution times of tasks on the different resource

types are monitored during execution, and the average execution time is used

as a predictor for scheduling purposes. There is one such history-based model

for the CPUs, and one for each of the GPUs. The default scheduling strategy in

StarPU is called dmdas: it considers each task when all its dependencies have

been satisfied, and assigns it to the processing unit that completes it the earliest

(based on the current loads and estimated data transfer and execution times).

Tasks assigned to the same processing unit are executed in priority order, where

the priorities are provided by the application developer. Once a task has been

assigned to a processing unit, but possibly before it starts executing if the

re-source is busy, the required data is prefetched to the memory of the processing

unit if necessary. In the applications we consider, this allows to automatically

overlap most of the communications with the computations.

3

Task Durations

Experimental Settings:

In this section, we present some observations on

the duration of tasks. We aim at providing a general experiment environment

to study the variability of task durations on the different resources and the

influence of this variability on the behavior of runtime schedulers. We consider

a typical HPC node consisting of both multicore and accelerators. We made

our experiments on the sirocco platform, which is made of 2 Dodeca-core Intel

Xeon E5-2680, providing a total of 24 CPU cores, and 4 Nvidia GK110BGL

GPU units. In StarPU, each GPU unit is managed by a dedicated CPU core,

leaving 20 cores available for computation. In the rest of the experiments of this

paper, GPUs are numbered from 0 to 3 and CPUs are numbered from 4 to 23.

As mentioned in the introduction, in order to perform meaningful statistics,

we rely on regular applications that involve a large number of tasks belonging to

few categories only and for which efficient implementation within StarPU exist

in the Chameleon library. The release versions that we use for experiments are

StarPU 1.2.3 and Chameleon is 0.9.1. For both algorithms, we use the tiled

implementation, which is obtained by dividing the input matrix in a certain

number of tiles of fixed sizes, and applying the (Cholesky or LU) algorithm on

tiles rather than on elements. Cholesky relies on 4 kernels, namely POTRF

(Cholesky factorization) on the diagonal tiles, TRSM (triangular elimination),

SYRK (symmetric matrix multiplication), and GEMM (matrix multiplication).

For most experiments, we set the size of the matrix to 48000 × 48000 and the

block size to 960, what leads to 50×50 blocks matrices. The tile size is chosen so

as to achieve good performance both on CPUs and GPUs. In order to compute

statistics on the duration of factorizations, we perform both Cholesky and LU

factorization 10 times each. In the case of Cholesky factorization, with N = 50

blocks in each dimension, we therefore consider a total of 500 POTRF tasks

(N ∗ 10), 12500 SYRK and TRSM tasks (

N (N −1)

2

∗ 10) and 196000 GEMM

tasks (

N (N −1)(N −2)

6

∗ 10), what is large enough to perform meaningful statistics

of individual kernel durations.

(6)

GEMM

POTRF

SYRK

TRSM

GPU

1.73

11.6

1.28

3.42

CPU

87.6

11.3

47.8

44.0

ratio

50.6

0.975

37.4

12.9

GEMM

GETRF

TRSM

GPU

1.68

16.6

3.05

CPU

91.8

31.9

45.0

ratio

54.5

1.92

14.7

Table 1: Median task durations for Cholesky (top) and LU (bottom)

factoriza-tions, in ms.

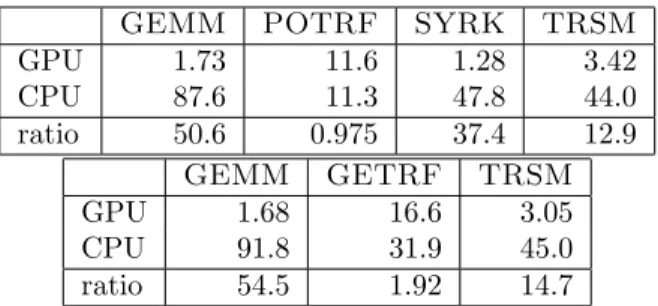
Median Durations and Resource Allocation:

The median values of tasks

duration for each kernel of both LU and Cholesky factorization on each type of

resource are given in ms in Table 1. We can observe that, as expected, a GPU is

in general much faster than a CPU core. On the other hand, we can also observe

that resources are highly unrelated, in the sense that some kernels are highly

accelerated on GPUs (up to 50 times for GEMM) whereas POTRF kernel is

(slightly) slower on a GPU than on a CPU. In order to evaluate the overall

computational power of the 2 Dodeca-core Intel Xeon E5-2680 and the 4 Nvidia

GK110BGL GPU, we can estimate the time to perform all the kernels of a 50×50

Cholesky factorization without dependencies and without communication costs

on 20 CPUs and 4 GPUs. We obtain 91.6s on the 20 CPUs and 10.1s on 4 GPUs,

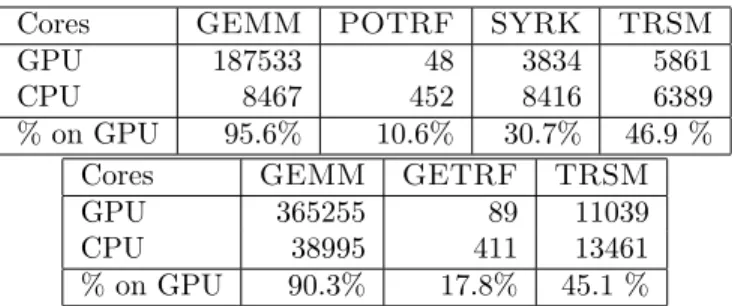
so that we can expect the 4 GPUs to perform about 90% of the work. In Table 2,

we can observe that in a Cholesky run, StarPU allocates almost all GEMM

tasks on GPUs, where they are highly accelerated, whereas it allocates almost all

POTRF tasks on CPUs. Without dependencies, we can write a linear program

(in rational numbers) to determine the optimal share between resources. This

linear program proves that the processing time cannot be smaller than 8.25s.

In the LP solution, CPUs perform all POTRF, SYRK and TRSM tasks, and

GPUs perform 97.1% of GEMM tasks. Of course, due to dependencies, there

may not be enough GEMM tasks to feed the GPUs, especially at the beginning

and the end of the execution, what explains why GPUs also perform some

POTRF, SYRK and GEMM tasks in an actual execution of the Cholesky

factorization.

Tasks duration on CPUs:

We focus on the case of CPUs, in particular in

order to analyze NUMA (Non Uniform Memory Access) effects and the

variabil-ity of task durations. Given the architecture of the 2 Dodeca-core Intel Xeon

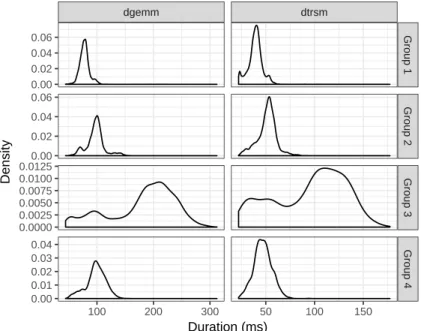
E5-2680, we split the CPUs into 4 groups, depending on their shared caches.

In Figure 1, we depict the probability density function, i.e. the probability,

for a kernel on a group to have for a given duration. We can observe several

interesting phenomena on the GEMM plots. First, all groups exhibit a peak

around 70ms, that corresponds to the processing time once data is in the cache.

If data is not in the cache, then the necessary time to load it strongly depends

(7)

Cores

GEMM

POTRF

SYRK

TRSM

GPU

187533

48

3834

5861

CPU

8467

452

8416

6389

% on GPU

95.6%

10.6%

30.7%

46.9 %

Cores

GEMM

GETRF

TRSM

GPU

365255

89

11039

CPU

38995

411

13461

% on GPU

90.3%

17.8%

45.1 %

Table 2: Task Sharing in Cholesky (top) and LU (bottom) factorizations.

on the group. In particular, for cores in group 3, we can observe a second peak

around 175ms, that corresponds to the processing and data transfer durations.

The same phenomenon, that will be denoted as NUMA effect in what follows,

can also be observed on SYRK and TRSM kernels (we did not display the

re-sults for POTRF since we do not have enough tasks to perform this statistics).

The second observation is related to duration variability. Indeed, even within

the same group, we can observe that the time to process a given kernel onto

a core varies from one execution to another. Note that the duration of a task

is defined as the time between the end of the processing of this task and the

end of the processing of the previous task allocated to the same resource. Note

that for GPUs, StarPU uses data prefetching to overlap communications with

computations, but not yet for CPU cores, that are seen as identical resources.

Observed duration may include time spent to load the data. We expect that

data prefetching and co-scheduling are responsible for task duration variability,

but our focus in this paper is to observe variability and to measure its impact

on the makespan, and we leave for future work the justification of observed

phe-nomena. All these observations are very similar in the case of LU factorization,

as shown on Figure 2.

Tasks duration on GPUs:

Contrarily to the case of CPUs, we did not

observe a significant variability between the 4 GPUs, so that we depict the

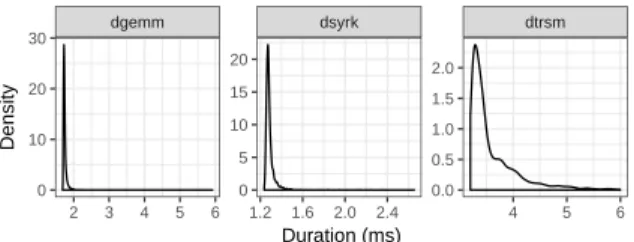
aggregated statistics for all 4 GPUs. Figure 1 depicts the probability density

functions for GEMM, SYRK and TRSM kernels in Cholesky factorization (we

omit the results for POTRF for the same reason as before). We can observe

a strong concentration of durations around the median value, showing that

StarPU prefetching mechanism is efficient and that data transfers are in general

well overlapped with processing. On the other hand, we can observe variability

in task durations. The phenomenon is stronger for TRSM than SYRK than

GEMM, but in all cases, we can observe that there are tasks whose duration

is significantly larger than the median time. We will study in detail these long

tasks in Section 4 and their impact on the overall processing time in Section 5.

The density functions for tasks in LU factorization are shown in Figure 4.

The density of GEMM tasks behaves very similarly to the same kernel in

Cholesky factorization, however the TRSM tasks show a very clear bimodal

(8)

dgemm

dsyrk

dtrsm

Group 1

Group 2

Group 3

Group 4

100

200

50

100

150

50

100

150

0.00

0.02

0.04

0.06

0.00

0.01

0.02

0.03

0.04

0.000

0.005

0.010

0.00

0.01

0.02

0.03

0.04

0.05

Duration (ms)

Density

Figure 1: PDF of Cholesky task durations on CPU Cores

dgemm

dtrsm

Group 1

Group 2

Group 3

Group 4

100

200

300

50

100

150

0.00

0.02

0.04

0.06

0.00

0.02

0.04

0.06

0.0000

0.0025

0.0050

0.0075

0.0100

0.0125

0.00

0.01

0.02

0.03

0.04

Duration (ms)

Density

(9)

dgemm

dsyrk

dtrsm

2

3

4

5

6

1.2

1.6

2.0

2.4

4

5

6

0.0

0.5

1.0

1.5

2.0

0

5

10

15

20

0

10

20

30

Duration (ms)

Density

Figure 3: PDF of Cholesky task durations on GPUs

dgemm

dtrsm

2

3

4

5

6

3

4

5

6

0.0

0.5

1.0

1.5

2.0

2.5

0

10

20

30

40

50

Duration (ms)

Density

Figure 4: PDF of LU task durations on GPUs

distribution. This does not come from a behavior of the platform, but is rather

a feature of the LU algorithm itself, which contains two different types of TRSM

tasks (either on the L or on the U part of the solution). These tasks use

dif-ferent parameters of the TRSM kernel, and this results in sligthly difdif-ferent

performance on the platform we consider. Technical limitations prevented us

from considering both types of tasks separately.

4

Long Delay Tasks Phenomenon

In the context of MapReduce applications (see Section 2), it has been observed

that beyond the intrinsic variability of task durations, there also exists tasks

with abnormal duration, called stragglers. These tasks are critical and several

works have been devoted to their early detection and to strategies to cope with

them, based on re-execution, what is made possible by the use of distributed file

systems based on replication such as HDFS. In the context of runtime systems

such as StarPU, ad-hoc strategies would have to be added to the runtime

system to cope with stragglers, what is out of the scope of this paper. Indeed,

our goal is to identify if such phenomenon takes place in HPC systems and to

quantify its impact on the application makespan, so as to evaluate the need for

such solutions.

Detailed Statistics:

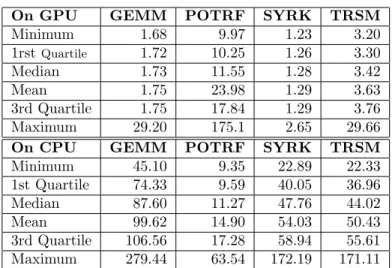
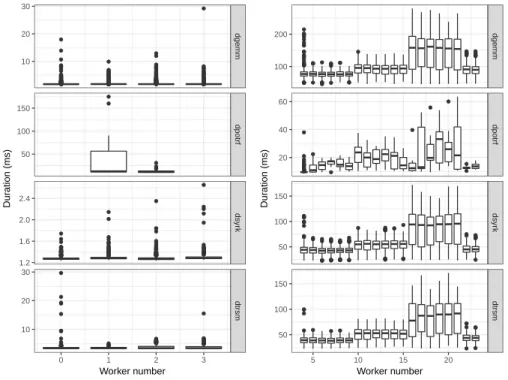
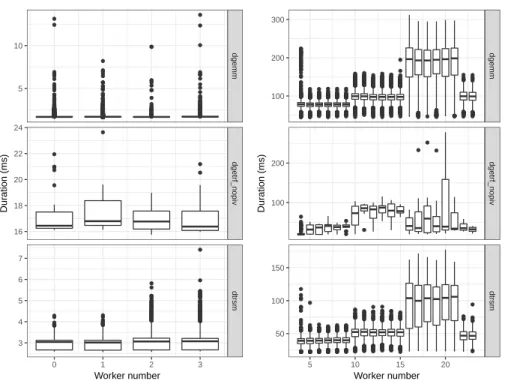
The detailed distributions for task durations are shown

in Table 4 for Cholesky factorization and in Table 4 for LU factorization. In

addition, boxplots for each core and each GPU are depicted in Figures 4 and 4.

(10)

On GPU

GEMM

POTRF

SYRK

TRSM

Minimum

1.68

9.97

1.23

3.20

1rst

Quartile

1.72

10.25

1.26

3.30

Median

1.73

11.55

1.28

3.42

Mean

1.75

23.98

1.29

3.63

3rd Quartile

1.75

17.84

1.29

3.76

Maximum

29.20

175.1

2.65

29.66

On CPU

GEMM

POTRF

SYRK

TRSM

Minimum

45.10

9.35

22.89

22.33

1st Quartile

74.33

9.59

40.05

36.96

Median

87.60

11.27

47.76

44.02

Mean

99.62

14.90

54.03

50.43

3rd Quartile

106.56

17.28

58.94

55.61

Maximum

279.44

63.54

172.19

171.11

Table 3: Statistics of Cholesky Task Duration (in ms) on GPU (top) and CPU

(bottom).

In both Figures, we can clearly observe the CPU groups that we used in

Sec-tion 3. Note that the fourth group is made of 2 cores only (instead of 6 for

other groups) since StarPU dedicates 1 core per GPU to organize data

trans-fers between the memory of the CPUs and the memory of each GPU, and the

4 cores have been chosen in this group. The boxplots show the minimum value,

the first quartile, the median, the third quartile, the maximum value and the

outlier values of tasks duration for each CPU core and GPU. The outliers can

either be very slow tasks (negative outliers) or very fast tasks (positive outliers)

in the experiments.

Outliers Identification:

Based on the experiments depicted in Tables 4

and 4 and Figures 4 and 4, we can observe long delay tasks on both types

of resources, but more outliers on GPUs. For instance, in the case of GEMM

tasks for Cholesky factorization, on GPU, the largest processing time is almost

17 times larger than the median time, and on CPUs, it is ”only” 3 times larger.

If Q

1st

and Q

3rd

denote respectively the value of the first quartile and the

third quartile, outliers are classically identified in statistics with two threshold

Outlier

+

and Outlier

defined as Outlier

+

= Q

1st

− 1.5 × (Q

3rd

− Q

1st

) and

Outlier

= Q

3rd

+ 1.5 × (Q

3rd

− Q

1st

). Using this definition, we obtain the

percentage of positive and negative outliers on both types of resources for all

kernels, which are depicted in Tables 5 and 6. We can observe that the number

of positive outliers is always small, as expected, and that the fraction of negative

outliers is much larger on GPUs than on CPUs.

Figure

Table 1: Median task durations for Cholesky (top) and LU (bottom) factoriza- factoriza-tions, in ms.
Table 2: Task Sharing in Cholesky (top) and LU (bottom) factorizations.
Figure 2: PDF of LU task durations on CPU Cores
Figure 3: PDF of Cholesky task durations on GPUs
+7

Références

Documents relatifs

represents an irrational number.. Hence, large partial quotients yield good rational approximations by truncating the continued fraction expansion just before the given

Florian Lemaitre 1,2,3 , Camille Tron 1,2,3 , Caroline Jezequel 4 Marie-Clémence Verdier 1,2,3 , Michel Rayar 2,4.. 1 Service de Pharmacologie Clinique et épidémiologique,

We conjecture that the right choice of weights could help to improve matrix factorization results on analogy questions, where skip- gram with negative sampling (SGNS) remains

For our study, we analyzed reproductive success of female and male Barbary macaques living in 1 group in the provisioned, free-ranging colony on Gibraltar over a period of 6 yr

They showed that the problem is NP -complete in the strong sense even if each product appears in at most three shops and each shop sells exactly three products, as well as in the

When examining the between methods RV coefficients (e.g., metabolic profiling convergence between NMR and LCMS), the values decreased from *0.75 in Test #1 (urine samples) to 0.54

The phasing of precession and obliquity appears to influence the persistence of interglacial conditions over one or two in- solation peaks: the longest interglacials are

[r]