Publisher’s version / Version de l'éditeur:
Vous avez des questions? Nous pouvons vous aider. Pour communiquer directement avec un auteur, consultez la première page de la revue dans laquelle son article a été publié afin de trouver ses coordonnées. Si vous n’arrivez pas à les repérer, communiquez avec nous à [email protected].
Questions? Contact the NRC Publications Archive team at
[email protected]. If you wish to email the authors directly, please see the first page of the publication for their contact information.
https://publications-cnrc.canada.ca/fra/droits
L’accès à ce site Web et l’utilisation de son contenu sont assujettis aux conditions présentées dans le site LISEZ CES CONDITIONS ATTENTIVEMENT AVANT D’UTILISER CE SITE WEB.
Internal Report (National Research Council of Canada. Institute for Research in Construction), 1992
READ THESE TERMS AND CONDITIONS CAREFULLY BEFORE USING THIS WEBSITE.
https://nrc-publications.canada.ca/eng/copyright
NRC Publications Archive Record / Notice des Archives des publications du CNRC :
https://nrc-publications.canada.ca/eng/view/object/?id=5999297c-16dc-4dee-9556-5b4f7662f391 https://publications-cnrc.canada.ca/fra/voir/objet/?id=5999297c-16dc-4dee-9556-5b4f7662f391
NRC Publications Archive
Archives des publications du CNRC
For the publisher’s version, please access the DOI link below./ Pour consulter la version de l’éditeur, utilisez le lien DOI ci-dessous.
https://doi.org/10.4224/20375596
Access and use of this website and the material on it are subject to the Terms and Conditions set forth at Computer Modelling of Compartment Fires
Internal Report No. 613 Date of issue: August 1991
ANALYZED
""
1
L I B R A R Y
B l B L l b
Y~ E O U E ~
I
I R CcE,lnc~Lrn--,
COMPUTER MODELLING O F COMPARTMENT FIRES by
G.V. Hadjisophocleous and A.C. Yakan
ABSTRACT
This report briefly describes a two-dimensional transient computational fluid
dynamics model for compartment fire simulations. The model is based on the numerical
control volume solution of the governing partial differential equations for mass, momentum
and energy conservation and it models fire as a heat and mass source. The governing
equations are solved over a boundary-fitted coordinate system which allows the application of the model to rooms with complex geometries.
This report also presents numerical predictions obtained by this model for a variety
of fire scenarios, as well as comparisons with experimental data. These comparisons show
that the model can predict compartment fires with reasonable accuracy. Results for other
cases are presented to demonswdte the effect ~f fire intensity, fire location and compartment openings on the flow characteristics in the room.
1.
INTRODUCTIONThe air flow characteristics, resulting from a fire in a compartment, are influenced
by factors such as the fire intensity and location, the compartment openings and the
surrounding environmental conditions. An understanding of the conditions in a room
during a
fire
is important as it allows for better designs for fire safety in addressing suchissues as optimum locations for sprinklers and smoke detectws and smoke control vents.
These conditions
are
especially critical when dealing with structures with complexgeometries.
In recent years, considerable research, using both physical experiments and
mathematical models, has been dedicated to understanding the dynamics of fire in a
compartment. Full-scale c o m p m e n t fire experiments have been conducted by several
research establishments, such
as
the Fire Research Station (FRS) [I], the National Instituteof Standards and Technology (NIST) [2,3], Factory Mutural Research Corporation
(FMRC) [4] and the Technical Research Centre of Finland [5,6]. These experiments
investigated the flow characteristics resulting from a fire in a compartment under a variety
of fire intensities, fire locations, room dimensions and openings and made significant
contributions to the enhancement of our understanding of how fires begin and propagate.
Full-scale experiments, however, are costly and require considerable time and effort for
their preparation. An alternative to some full-scale experiments is computer simulation of
full-scale fire scenarios using numerical models.
Computer models require extensive effort for their development and validation but,
once validated, they can be used with minor modifications to simulate a variety of fire
scenarios. Computer models
are
of particular importance when dealing with largebuildings with complex geometries for which full-scale experiments
are
not feasible.Several computer models for fire simulations have been developed and used to solve a ~
In this project, a two-dimensional computer model has been modified so that it can be used to simulate compartment fires for different conditions. The numerical predictions
obtained by this model are compared with available experimental data to examine the ability
of the model to predict events during a fire. Several simulations have been performed to
study the effect of fire intensity, fire location and compartment openings on the airflow
characteristics in the room. This report gives a brief description of the model and presents the results obtained.
2 . PROGRAM DESCRIPTION
The model used to simulate compartment fues consists of two programs. The fust program (RMFIRE) solves the equations governing free convection over a boundary-fitted
coordinate system and the second (GRIDGN) generates
t
h
i
s
coordinate system. Thissection briefly describes these two programs. Additional details can be found in Ref. 8.
2.1 Program W F I R E
The free convective flows resulting from a fue in a compartment
are
governed bythe conservation equations for mass, momentum and energy. These equations were simplified using the Boussinesq approximation and were normalized using the initial air
properties and compartment height as reference parameters. The normalized equations
are
solved on a boundary-fitted curvilinear coordinate system using numerical methods. The boundary-fitted coordinate system is employed to allow the use of this model for problems with complex geometries without major modifications.
To solve the governing equations on the boundary-fitted coordinate system, it is
necessary to transform them to this system. This transformation was made using the chain
rule of mathematics and a method described by Maliska and Raithby [9]. In this method,
the Cartesian velocity components are maintained as the dependent variables. The
equations resulting from this method can be solved using a solution procedure similar to the
SIMPLE algorithm.
The equations were discretized following the control volume formulation, in which the solution domain is divided into a number of small volumes. The transformed equations were then integrated over each control volume. A typical control volume, centred at node P
and surrounded by the four nodes E,W,N, and S, is shown in Figure 1. The staggered
grid approach was used for the locations at which the variables were computed. The Cartesian and Contravariant velocity components were computed at the centre of the control volume faces (e, w, n, s), while pressure and temperature were computed at the centre of
the control volume (P).
The solution algorithm follows the SIMPLE Consistent method (SIMPLEC). In this method, a pressure correction equation is derived from the continuity and momentum
equations. The solution to this equation yields the pressure corrections which are used to
correct the pressure field and to correct the velocities
so
that they satisfy continuity.2.1.1 mod ell in^ the F&
The fire in the compartment was modelled as a heat source and a mass source at the
control volumes where the fire was located. The values given for the heat generated were
obtained from experimental heat release data. The mass source was determined by the combustion equation and the quantity of fuel burned.
2 . 2 Program GRIDGN
This program generates the boundary-fitted coordinate system. The method employed for grid generation is the method developed by Thompson et al [lo]. This method generates boundary-fitted coordinate systems in any arbiaarily shaped domain by solving the following system of Poisson equations;
V x x + V y y =
Q(h)
where P and Q are functions which provide control of the mesh concentration.
The boundary conditions required for the solution of these equations are the values of 5 and q at the boundaries.
Since it is desired to perform all numerical computations in the transformed plane, the above equations were transformed from the Cartesian system to the ( 5 4 system using the chain rule. The transformed equations were then solved using numerical methods. The boundary conditions for the transformed equations are the values of the Cartesian
coordinates x and y at the boundaries. The solution of these equations yields the values of x and y at discrete
5
and q locations. The x and y values at the grid pointsas
well as their derivatives in both directions are computed and stored as they are needed by the program RMFIRE.2 . 3 Solution Procedure
The main computational steps of the method can be s ed
as
follows: 1. Generate the boundary-fitted coordinate system;2 . Guess values for all dependent variables; 3. Calculate heat release rate and mass source; 4. Solve the energy equation;
5. Solve the momentum equations to obtain the cartesian velocities u and v;
6 . Calculate the connavariant velocities U and V from the cartesian velocities u and v; 7. Solve the pressure correction equation;
8. Update U and V using the computed pressure corrections; 9. Compute new u and v from the corrected U and V velocities;
10. Treat all computed values as guessed values, return to 3 and continue until the specified convergence is obtained,
1 1. Proceed to the next time step, go to 3 and continue until maximum time is reached.
3 . DISCUSSION OF RESULTS
Model RMFIRE is still in its early stages of development and requires extensive validation using experimental data before it can be used with confidence to model
compartment fms. Two comparisons are given in this study using the experimental data reported in 121.
Some preliminary runs were carried out to demonstrate how this model can be used. These simulations were directed at investigating the effect of fire intensity, fire
location and openings on the flow characteristics in the compartment. All simulations performed for this study are summarized in Table 1. The mom dimensions and fire
iocations are shown in Agures 2 and 3.
3 . 1 Comparisons with experimental data
In this section, the results predicted by the numerical model are compared to experimental data obtained by Steckler et al[2], who carried out a series of compartment fires using various configurations. Two sets of data are used. one for a room with a door on one wall and the second with a window. The fue room for these experiments, shown in Figure 3, was square with walls 2.8 m long and a height of 2.18 m. The burner was located near the rear wall and the fm intensity was 62.9 kW. The ambient temperature during the experiments was 27°C. Velocities and temperatures were measured at steady state along two vertical lines; one at the opening and the other inside the room 0.3 m from the door (Figure 4).
The experimental geomehic, fire and ambient data were used as input into the model. Simulations were carried out until steady state conditions were reached For these simulations, the walls, floor and ceiling of the room were assumed to be adiabatic and no radiation heat transfer is considered. To be able to observe the flow of gases from the room, the computational domain was extended outside the room as shown in Figure 4. '
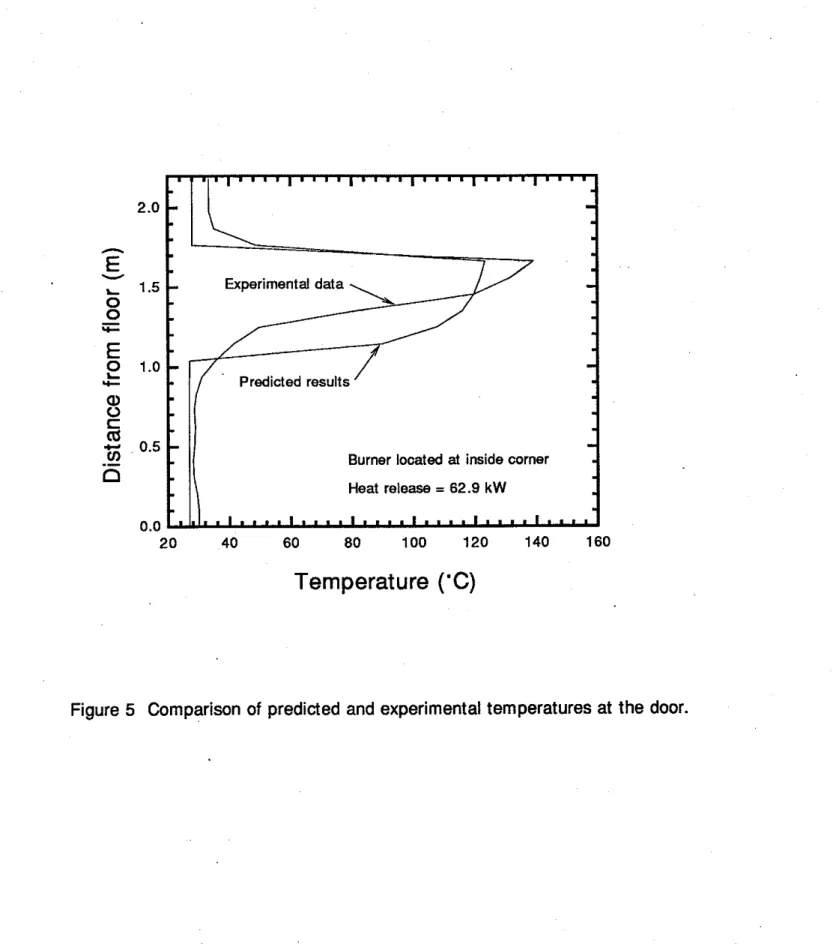
The predicted velocity and temperature distributions for this run are discussed in Section 3.2. This section presents only the comparisons between predictions and experiments. Figure 5 depicts a comparison between the predicted and experimental temperature profiles at the door. The temperature near the floor is that of the incoming air, hence, is near ambient temperature. The temperature is constant up to about 1.0 m. At that height, the predicted temperature rises sharply while the experimental change is more gradual. The maximum predicted temperature at the door is 125°C while the maximum experimental temperature was 138°C.
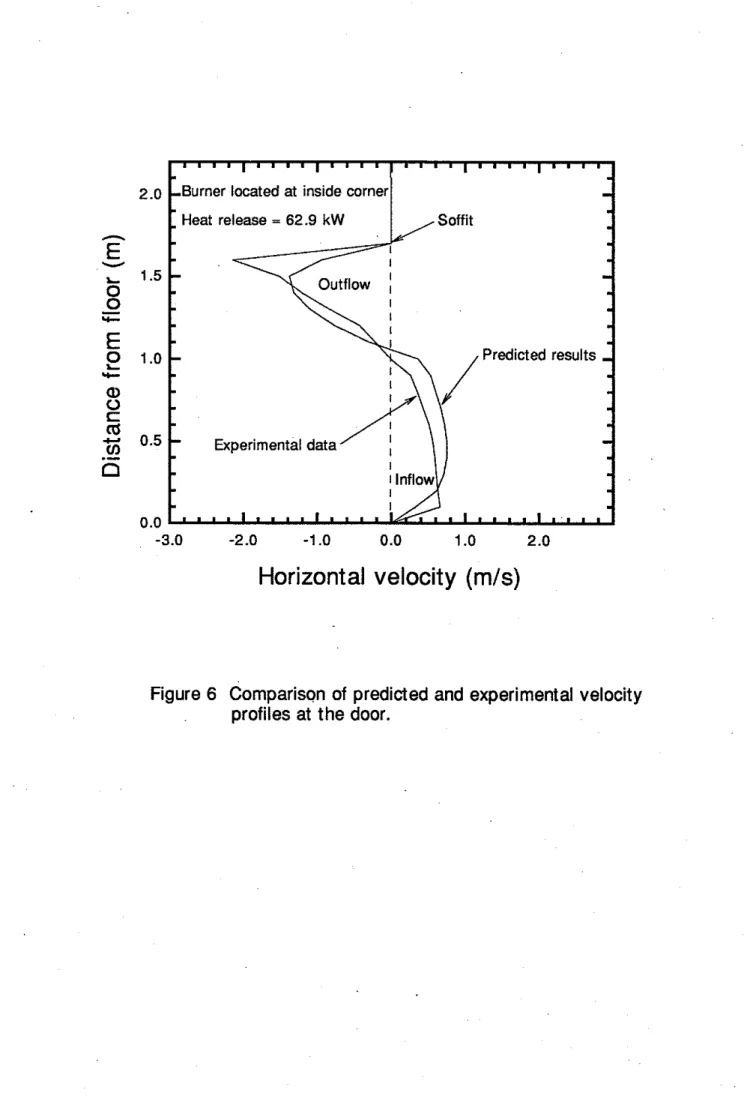
The velocity profiles near the door are shown in Figure 6. The maximum velocity measured during the experiment is greater than the predicted one and its location is higher than the location of the predicted maximum velocity. The neutral plane, however, is at almost the same height for both. The predicted height of the neutral plane is 1.1 m while the measured height in the experiment was 1.05 m.
A comparison of the temperature profiles 0.3 m inside the room is shown in Figure 7. The predicted thickness of the hot layer is slightly greater than the experimental one. The maximum predicted hot layer temperature, however, is lower than the experimental. An interesting point is that the predicted temperature near the floor is the ambient one while the experimental is at about 10 degrees higher. This increase of the temperature near the floor might be due to mixing of the two layers and radiation from the hot gases to the lower layer. Radiation heat aansfer is not considered by the model at this stage.
3.1.2 Room with Window
The comparisons between the predicted and experimental temperatures and
velocities when the opening is a window are shown in Figures 8,9 and 10. The results for this case are similar to the ones discussed for the door case. Despite the difference in the
profiles, it is interesting to
see
that the height of the neutral plane is almost the same for both data. This interface height is an important factor in compartment fues. The lqwer theinterface, the higher the
risk
to the occupants trying to evacuate the building.3.2 Effect of room opening on flow characteristics.
In this section, the predicted results of the two simulations used for the
comparisons with experiments are analyzed further to examine the effect of openings on the flow characteristics. Figure 11 depicts the velocity vectors in the room and the adjoining space outside the room for the door case. The hot plume generated by the fire moves upward along the wall, then follows the ceiling and moves towards the door. At the door, it exits the room creating a hot plume along the exterior wall. This motion of the hot gases creates a negative pressure inside the room causing cold air to enter the room. The
temperature contours in O C for this case are shown in Figure 12.
Figures 13 and 14 depict the velocity vectors and isotherms for the window case.
The flow pattern in the room
&
slightly different from the door case as now there are, at thecentre of the room, secondary recirculating vortices causing an increase in the thickness of
the hot layer (Figure 14). This increase in the hot layer thickness is also affected by the
decrease of the quantity of hot gases leaving the room, a result of the smaller opening. This can be seen in Table 2, which shows a summary of the results for these two
simulations. The mass flow rate through the door is 0.76 kgls, and through the window,
0.68 kgls. The maximum inflow velocity, also shown in Table 2, is 0.75 d s for the door
case and 1.14 d s for the window case. The maximum outflow velocity, however is about
the same for the two cases at 1.38 d s . As shown in Table 2, the maximum and mean
temperatures in the room with the window
are
higher than for the room with the door. Thisresult is caused by the difference in the mass flowrates out of the compartment
3.3 Effect of fire location on flow characteristics
Three simulations were performed to study the effect of fire location on the flow
characteristics, the first was with the burner at the inner comer, the second with the burner in the middle of the room and the thud with the burner near the opening, which was a door
for all cases. Table 3, which summarizes the results of these simulations, indicates that the
mass flow rate decreases as the burner moves towards the door. The decrease'of the incoming air causes an increase of the mean temperature in the room. The maximum temperature at the door increases as the burner moves from the back comer to the door. The velocity profiles at the door for the three cases are shown in Figure 15. The profiles
are
similar for the cases with the burner located near the door and in the middle of theroom, with a maximum incoming velocity of about 0.8 m/s. When the burner is located at the comer, the maximum incoming velocity increases to about 1.4 mls and the height of the neutral plane decreases.
3.4 Effect of fire size on flow characteristics.
Four simulations were performed to study the effect of fire size on the flow
behaviour in the fire compartment The heat release rates used were 19,39,63 and 97 kW.
For all cases, the burner was located near the back wall (Location C ) and the room opening
was a door.
As expected, the mean temperature in the room and the maximum temperature at the
door increase as the fire size increases (Figure 16). Figure 17 indicates that the mass flow
rate in and out of the compartment increases as the fire size increases. This is due to the
The velocity pmfiles at the door for the four heat release raies used are shown in Figure 18. The velocities increase with the increase in the heat release rate, however, it is interesting to note that the elevation of the neutral plane does not change.
4 . CONCLUSIONS
The air flow characteristics resulting from a fire in a compartment are modelled using a two dimensional field model. The results predicted by the model are compared with experimental data. The comparisons show reasonable agreement for velocities, temperatures and mass flow rates. The model, however, needs further improvements and validation before it can be used to accurately predict compartment fires.
To demonstrate some potential applications of such a field model, a number of simulations have been carried out to investigate the effect of openings, fire location and fue size on the flow characteristics and temperarature dismbution &the r&m The predicted results show that:
1 . The size of the openings affects the mass flow rates in and out of the room which, in turn, affect the room temperature and the height of the hot layer. As the combustion process is not modelled, the effect of ventilation on the fire itself cannot be seen. 2. Fire location has a significant effect on the flow characteristics in the room. The closer the fue is to the door, the lower the mass flow rates in and out of the room, causing higher mom temperatures.
3. The fire size simulations indicate that a larger fire will create larger flow rates in and out of the room and higher room temperatures.
These simulations were done to illustrate that the model is capable of predicting compartment fires, and to determine the modifications necessary to improve the model. As a first step towards improving the model the following are recommended:
1 . modify the model to account for three dimensional effects;
2. incorporate radiation heat transfer from the hot gases to the walls, floor and ceiling; 3. incorporate convection heat transfer from the hot gases to the room w a l k and 4. incorporate the k-E turbulence model.
REFERENCES
1. Heselden, A.J.M.,
"Fi
Problems of Pedestrian Precints. Part 1. The Smoke Production of Various Materials", Joint Fire Research Organization, Fire Research Station, Fire Research Note 856,197 1.2. Steckler, K. D., Quintiere, J. G. and Rinkinen W. J., "Flow Induced by Fire in a Compartment", NBSIR 82-2520, National Bureau of Standards, Washington, D.C., 1982
- -
3. Quintiere, J. G. and McCaffrey, B. J., "The Burning of Wood and Plastic Cribs in an Enclosure: Volume I", NBSIR 80-2054, National Bureau of Standards,
Washington, D.C., 1980.
4 . Heskestad, G. and Hill, J. P., "Experimental Fires in Multiroom/Comdor
Enclosures", NBS-GCR-86-502, National Bureau of Standards, Gaithersburg, MD,
-
(January 1986).5 . Ahomen, A., Holmlund, C. and Kokkala, M., "On the Influence of Ignition Power and Burner Size on the Fire Growth in Room Fire Experiments", Technical Research Cenae of Finland, Research Report 383, 1986.
6. Ahomen, A., Kokkala, M. and Weckman, H., "Burning Characteristics of Potential Ignition Sources of Room Fires", Technical Research Centre of Finland, Research R e ~ o r t 285. -.., 1984. -
7 .
~ d e a ,
E. "On the Field Modelling Approach to the Simulation of Enclosure Fires",J. of Fire Rot. Engr., Vol. 1, pp 11-22, 1989.
8. Hadjisophoclwus, G.V., "Numerical Modelling of LPG Horizontal Cylindrical Tanks Subjected to Heating Environments", Ph.D. Thesis, University of New - ~runswick, 1989.
9. Maliska, C.P. and Raithby, G.D., "A Method for Computing Three Dimensional Flows Using Non-orthogonal Boundary Fitted Coordinates", Int. J. Numerical Methods in Fluids, Vol. 4. DR. 519-537. 1984.
10. Thompson, J.F., Thames, FG. and ~ a & n , C.W., "Automatic Numerical
Generation of Body Fitted Cuwilinear Coordinate System for Field Containing any Number of Arbitrary Two Dimensional Bodies", J. Comput. Physics, Vol. 15,
LIST OF FIGURES Figure 1. Figure 2. Figure 3. Figure 4. Figure 5. Figure 6. Figure 7. Figure 8.
Typical conwl volume
Three dimensional view of the fire compartment Burner locations
Solution domain and locations where temperature and velocities are computed for model validation
Comparison of predicted and experimental temperatures at the
door
Comparison of predicted and experimental velocity profiles at the door ~omuarison of d c t e d and exi~rimental temPe&&s inside mom neardoor- - .
Comparison of predicted and experimental temperature profiles at the
urinrlnw 7 . Am.--
..
Figure 9. Comparison of predicted and experimental velocity profiles at the window Figure 10. Comparison of predicted and experimental temperature profiles inside the Figure 1 1. Figure 12. Figure 13. Figure 14. Figure 15. Figure 16. Figure 17. Figure 18.
roo& (with window opening) - .
Velocity vectors for the door case and burner located at the inside comer Temperature contours for the door case and burner located at the inside comer
Velocity vectors for the window case and burner located at the inside comer Temperature contours for the window case and burner located at the inside comer
Predicted velocity profiles at the door for various fire locations
Predicted mean room temperature and maximum temperature at opening as a function of fire size
Predicted mass flow rate through door as a function of fire size Predicted velocity profiles at the door for various fire sizes
LIST OF TABLES
Table 1. Summary of cases simulated
Table 2. Comparison of results between window and door opening;
fire
intensity 62.9 kW, location inner comer of room.Table 3. Comparison of results for different burner locations; fire intensity 19 kW, opening door.
Table 1 Summary of cases simulated
Cases opening Fire
Fire
Simulated Intensity Location
kW 1
Door
62.9 Comer 2 Window 62.9 Comer 3 Door 19.0 Comer 4 Door 19.0 Entrance5
Door 19.0 Center 6 Door 19.0 Entrance 7 Door 19.0 Entrance 8 Door 19.0 Entrance 9 Door 19.0 EntranceTable 2 .Comparison of results between window and door opening; fire intensity 62.9 kW, fire location inner comer of room.
Opening Maximum Maximum Mass Flow MeanRoom Maximum Inflow Outflow Rate Out
Velocity Velocity kids at Opening
d s d s O C
Door 0.75 1.38 0.76 55.6 123.4
Table 3 Comparison of results for different burner locations; fire intensity 19 kW, opening door.
Fire Maximum Maximum Mass Flow Mean Room h 4 a x h - n ~ Location Inflow Outflow Rateout Tem rature T e m t u r e
Velocity Velocity kg/s
g
at Openingm/s m/s
0°C
Entrance
0.52 0.95 0.51 40.5 71.7Center 0.74 1.07 0.66 40.3 63.5
Burner:
0.3m dia.
Doorway
extended solution
14- 2.8 A
CEILING
Predicted and experimental temperatures and velocities are compared along these
two lines. 2.8
FLOOR
14
Figure 4 : Solution domain and locations where temperature and velocities are computed for model validation.
-
.
1.5-
-
Experimental data-
-
.
-
Predicted results.
.
.
.
.
0.5-
-
Burner located at inside corner Heat release = 62.9 kW
" ~ " ' ~ ~ " " 1 " " 1 ' ~ " 1 " " 1 ~ " '
20 40 60 80 100 120 140 160
Temperature
('C)
1 " " l " " " " I " " I " "
-
-Burner located at inside corner
-
.
-
Heat release = 62.9 kW.
.
.
.
-
.
.
-
-
.
-
.
.
-
Predicted results- -
-
.
.
.
-
.
-
Experimental data-
.
.
.
.
.
.
.
.
.
. I . .. .
.
Horizontal velocity (mls)
Figure 6 Comparison of predicted and experimental velocity profiles at the door.
Temperature ('C)
1 ' ~ " 1 " ' ' 1 " ' ' 1 " '
2.0 -Burner located at inside corner
.
Heat release =62.9 kW
Figure
7Comparison of predicted and experimental temperatures inside room
near door.
hE
V 1.5z
0-
LCE
-
Experimental data.
-
.
Predicted results.
'5
-
.
.
.
" ' l " " l " ~ ' l " " l " " f " " 20 40 60 80 100 120 140 1602.2
H.R.
-
62.9 kW &mer Location: 'CFigure 8 Comparison of predicted and experimental temperature profiles at the window.
H.R. = 62.9 kW
h e r Location: 'C'
Figure 9 Comparison of predicted and experimental velocity profiles at the
window.
Figure1
0
Comparison of predicted and experimental temperature profiles inside the room (with window opening).Heat Release = 62.9 kW
'
Door Fire location /Figure 11 Velocity vectors for the door case and burner located at the inside corner.
S o f f i t Level
Tern "C
8 532.2 7 461.1 6 390.1 5 319.1 4 248.1 I 3 177.0 I I 2 106.0 I I 1 35.00Heat Release = 62.9 kW
'
Door Fire location /Figure 12 Temperature contours for the door case and burner located at the inside corner.
Heat release 62.9 kW \window Fire location
/
Figure 13 Velocity vectors for the window case and burner located at the inside corner.
Level Tern ' C 6 328.8 5 270.0 4 211.3 3 152.5 2 93.77 1 35.00
Heat release 62.9 kW \window Fire location/
Figure 14 Temperature contours for the window case and burner located at the inside corner.
h
E
V 1.5 0 0-
Y-E
1.0 0 L +a
0 0.5 .c..rn
.-
Heat release = 19 kW In
0.0 -1.5 -1 .O -0.5 0.0 0.5 1 .OVelocity
(mls)
1 ' " ' 1 " " ~ " " ~ '
-
-
rn Maximum temperature at opening
-
A Mean room temperature-
-
-
-
-
-
-
-
-
-
-
-
-
-
-
-
-
-
A-
-
A-
-
A-
-
A Fire located at inner corner-
-
Opening; door.
1 1 1 . . 1 . . . . l . ~ ~ . ~ .
Fire
size (kW)
Figure 16 Predicted mean room temperature and maximum temperature at opening as a function of fire size.
50 7 5
Fire size (kW)
1 " " 1 " " 1 " " 1 '-
-
-
-
-
.
-
-
-
-
-
-
-
-
-
-
-
-
-
.
m.
-
-
-
-
-
-
-
-
-
-
-
-
-
-
-
Fire located at inner corner
-
-
-
I . . . . 1 .
- .