1
Socio-environmental stressors encountered during spaceflight partially
affect the murine TCR repertoire and increase its self-reactivity
Coralie Fonte1, Sandra Kaminski1, Anne Vanet2,3, Laurence Lanfumey4, Charles Cohen-Salmon5, Stéphanie Ghislin1† and Jean-Pol Frippiat1†*.
1 EA 7300, Stress Immunity Pathogens Laboratory, Faculty of Medicine, Université de Lorraine, F-54500 Vandœuvre-lès-Nancy, France.
2 Paris Diderot University, University Sorbonne Paris Cité, F-75013 Paris, France.
3 Epôle de Génoinformatique, Institut Jacques Monod, UMR7592, CNRS, F-75013 Paris, France. 4 INSERM UMR894, Centre de Psychiatrie et Neuroscience, F-75014 Paris, France.
5 INSERM U1141, PROTECT, Université Paris Diderot, Sorbonne Paris Cité, Hôpital Robert Debré, France.
† Codirected this study.
Short title: Space socio-environmental stress and TCR diversity.
*Correspondence: Pr J.-P. Frippiat, EA 7300, Stress Immunity Pathogens Laboratory, Faculty of Medicine, Université de Lorraine. 9 Avenue de la Forêt de Haye. F-54500 Vandœuvre-lès-Nancy, France. E-mail: jean-pol.frippiat@univ-lorraine.fr. Telephone : + 33 3 72 74 62 86
2 NONSTANDARD ABBREVIATION:
3 ABSTRACT
Spaceflights are known to affect the immune system. In a previous study, we demonstrated that hypergravity exposure during murine development modified 85% of the TCR repertoire. Here, we investigated whether socio-environmental stressors encountered during space missions affect T lymphopoiesis and TCR
repertoire. To address this question, pregnant mice were subjected to CUMS, a model used to mimic socio-environmental stresses encountered during space missions, throughout gestation. Then, newborn T
lymphopoiesis and TCR repertoire were studied by flow cytometry and high-throughput sequencing, respectively. No change in thymocytes maturation or TCR expression were noted. TCR repertoire analysis revealed that 75% of neonate TCR sequences resulted from the expression of 3 V segments and that this core repertoire is not affected by CUMS. However, the minor repertoire, representing 25% of the global repertoire, was sensitive to CUMS exposure. We also showed that the V(D)J recombination process is unlikely affected. Finally, we noted that CUMS neonatal minor repertoire is likely more self-reactive than the one of control pups. These findings show that socio-environmental stressors such as those encountered during space missions affect a fraction (25%) of the TCR repertoire and that these stressors could increase self-reactivity.
4 INTRODUCTION
Space is an adverse environment in which astronauts encounter different stressors (radiations, change in gravity force, socio-environmental perturbations). Medical and biological findings from space missions have demonstrated that this extreme environment negatively affects the immune system (1, 2). Indeed, 15 of the 29 astronauts involved in Apollo missions developed bacterial or viral infections during, immediately after, or within one week of landing (3). Furthermore, medical data collected on 46 astronauts who spent six months onboard the International Space Station (ISS) revealed that 46% of them faced immunological problems (4). It is therefore important to determine how these conditions affect the development of immune cells required to mount an immune response.
Some studies have been performed in that direction. A decreased number of bone marrow myeloid progenitors, as measured by colony-forming assays, was observed in space (5, 6). The culture of human CD34+ bone marrow progenitors during spaceflight confirmed the inhibitory effect of microgravity on erythropoiesis and myelopoiesis (7). Changes in the maturation of granulocytic cells in the bone marrow of C57BL/6 mice were also reported after a 13-day spaceflight (8). Concerning lymphocyte development, it was shown that hindlimb unloading, a model frequently used to simulate spaceflight conditions, leads to decreased murine B lymphopoiesis similar to aging (9). T lymphopoiesis was also shown to be sensitive to gravity changes because reductions in CD4+, CD8+ and CD4+CD8+ thymocyte populations were reported when murine fetal thymuses were cultured under clinorotation (10). Furthermore, it was shown that hypergravity exposure during gestation modify 85% of the TCR repertoire of newborn mice (11).
TCR diversity is essential for host protection as 95% of T cells found in secondary lymphoid organs harbor a TCRαβ receptor (12, 13). This diversity is generated by the random association of different gene segments: a variable (V) and a joining (J) segment for the α chain; a variable (V), a diversity (D) and a joining (J) segment for the β chain. These associations happen during T lymphopoiesis thanks to the V(D)J recombination process which join a D with a J segment and then a V segment with the DJ pair. V(D)J recombination requires several effectors such as RAG proteins that interact with recombination signal sequences (RSS) located 3’ of V, on both sides of D and 5’ of J segments and inflict DNA single-strand breaks between coding V, D or J segments and noncoding RSS, leading to the formation of hairpin-sealed coding ends (14). In further steps, Artemis opens hairpin loops, eventually creating palindromic sequences corresponding to short inverted repeats of the segment terminal sequence (15). This is followed by
nucleotide deletions and insertions at the junctions and ends with ligation. The end product is the third complementarity-determining region (CDR3) of TCR chains, a short and highly variable region that interacts with antigenic peptides presented by MHC molecules.
In this study, we investigated whether socio-environmental stressors encountered during space missions affect T lymphopoiesis and TCR repertoire diversity. To address this question, we exposed pregnant mice, throughout gestation, to chronic unpredictable socio-environmental stressors of various
5 nature and mild intensity separated by resting periods (CUMS model). Indeed, we recently showed that this model mimics some spaceflight-induced immunological changes (16). Then, newborns’ T lymphopoiesis and TCR repertoire were studied by flow cytometry and high-throughput sequencing, respectively. We decided to work on pups conceived and born under this combination of stressors to ensure that T
lymphopoiesis and the creation of TCR repertoire diversity occurred exclusively under these conditions, as both processes start in utero, thereby eliminating the potential effects of previous development under
standard conditions.
MATERIALS AND METHODS
Animals
Experiments were conducted on 10-week-old C57BL/6N mice provided by Charles River Laboratories (Bois des Oncins, France). On arrival, animals were housed for 2 weeks in standard cages under controlled conditions in the animal facility of the INSERM UMR894 laboratory (Paris). These conditions were as follows: animals were provided food and water ad libitum in a quiet room with constant temperature (22°C), 50% relative humidity and 12 h light/dark cycles (dark period 8 pm - 8 am). Females and males were then mated by placing four females with a different male every day for 3 days. Females were then randomly divided into two groups: one control group housed in standard cages in groups of two, and one group of mice individually subjected to CUMS. CUMS exposure extended up to the postpartum day. This experiment was performed twice. The first experiment generated 28 control pups and 29 CUMS pups. The second experiment generated 24 control pups and 31 CUMS pups. Experimental procedures were conducted in accordance with the National Legislation. Furthermore, the French Ministry of Research approved the CUMS procedure (authorization 00966.02).
CUMS exposure
Mice of the CUMS groups were subjected to six different unpredictable mild socio-environmental stressors: 30° cage tilt for 1 h, 2 h or 15 h; confinement in a small cage (11 x 8 x 8 cm) for 1 h or 2 h; paired housing for 2 h; one 15 h overnight period with difficult access to food without a reduction in the daily food ration; one 15 h overnight period with permanent light and one 15 h overnight period in a soiled cage (50 ml of water in 1000 ml of bedding). These stressors were delivered according to Pardon et al. (17) and Gaignier et al. (16). Stress periods that lasted 1 h in the morning, 2 h in the afternoon and 15 h at night (6 pm - 9 am) were always separated by stress-free intervals of at least 2 h to avoid any habituation process. Animals were also placed on a reversed light/dark cycle between Friday evening and Monday morning. This procedure was scheduled over a 1-week period and repeated throughout the three weeks of experimentation. The control group was left undisturbed in another room of the animal facility, with two mice per standard cage (37.5 x 21.5 x 18 cm).
6 Sample collection
At birth, pups were weighed and put to death by decapitation between 8 and 10 am to avoid fluctuations of corticosterone concentrations due to the circadian rhythm. Blood samples collected during decapitation were allowed to clot at ambient temperature for 15 min and then centrifuged at 4°C and 4000 rpm for 20 min to collect serum samples that were stored at -80°C until analysis. Tails were frozen at -80°C until analysis. Thymuses were immediately dissociated in PBS-FBS 2% buffer. Thymocytes were then counted using a Scepter™ 2.0 Cell Counter (Merck Millipore, St-Quentin-en-Yvelines, France); 1.5 x 10⁶ cells were used for flow cytometry analyses and 107 cells for RNA extraction.
Genotyping
To determine the gender of each pup, tail genomic DNA was extracted using the NucleoSpin® Tissue kit (Macherey Nagel, Hoerdt, France). This DNA was used to amplify the Foxl2 gene present in female and male genomes and the Sry gene present only in the male genome. PCR was performed using 100-200 ng of genomic DNA, 0.6 units of Taq Polymerase (ThermoFisher Scientific, Villebon-sur-Yvette, France) and 0.7 µM of specifics primers (Table 1). PCR products were run on a 1% agarose gel to identify males (Foxl2+ Sry+) and females (Foxl2+ Sry-).
Corticosterone quantification
Corticosterone was quantified in serum samples using the Corticosterone Enzyme Immunoassay kit (ArborAssays, Ann Arbor, MI, USA). All samples were analyzed in duplicate. Calibrators were included in the plate. Absorbance at 405 nm was measured and concentrations, calculated from a standard curve, were expressed as ng/ml.
Flow cytometry
A total of 5 x 10⁵ thymocytes were stained with the following combinations of antibodies: PE (RM4-5), anti-CD8a-PE-Cy7 (53-6.7), anti-CD25-FITC (3C7) and anti-CD44-APC (IM7) or anti-CD4-PE (RM4-5), anti-CD8a-anti-CD4-PE-Cy7 (53-6.7) and anti-TCR-FITC (H57-597). Cells populations were
identified based on the expression of the following markers: DN1 (CD4- CD8- CD25- CD44+), DN2 (CD4 -CD8- CD25+ CD44+), DN3 (CD4- CD8- CD25+ CD44-), DN4 (CD4- CD8- CD25- CD44-), DP (CD4+ CD8+ CD25- CD44-), ISP8 (CD8+ CD3lo TCRlo), SP4 (CD4+ CD8- CD25- CD44-) and SP8 (CD4- CD8+ CD25 -CD44- CD3hi TCRhi). Cells were analyzed using the Beckman-Coulter CyAn ADP flow cytometer from the ImagoSeine platform (CNRS UMR7592, Institut Jacques Monod, Paris Diderot University, Sorbonne Paris Cité). Thymocytes from 20 control and 26 CUMS newborns of the first experiment and 15 control and 20 CUMS newborns of the second experiment were analyzed using the FlowJo software (Tree Star Inc, OR, USA). Anti-CD4-PE (RM4-5), anti-CD25-FITC (3C7), anti-rat IgG2a isotype control FITC (RTK2758)
7 and anti-TCR-FITC (H57-597) were purchased from BioLegend (Ozyme, Saint Quentin Yvelines, France). Anti-CD8a-PE-Cy7 (53-6.7), CD44-APC (IM7), rat IgG2a isotype control Pe-Cy7 (eBR2a), anti-rat IgG2a isotype control PE (eBR2a) and anti-anti-rat IgG2b isotype control APC (eB149/10H5) were purchased from eBioscience (eBioscience, Paris, France).
Quantitative RT-PCR
Total RNA was extracted form thymocytes using the Nucleospin® RNA plus kit (Macherey Nagel, Hoerdt, France). RNA was reverse transcribed using random primers, RNaseOUT and MML-V reverse transcriptase (Invitrogen, Cergy Pontoise, France). qPCRs were performed using Takyon No ROX SYBR 2X MasterMix blue dTTP (Eurogentec, Angers, France) and a Mastercycler® realplex2 real-time PCR machine (Eppendorf, Hamburg, Germany). The cycling protocol was as follows: 3 min at 95 °C, followed by 40 cycles of 15 s at 95 °C and 30 s at the annealing temperature indicated in Table 1. Each qPCR was done in triplicate. NR3C1 and 11HSD1 relative expressions by comparison to 3 housekeeping transcripts (Ef1a, GUSB and TBP) were performed as previously described (18). Primer pairs were designed in different exons to ensure that they could not hybridize to potential traces of genomic DNA, and their specificity was checked using a BLAST search through the U.S. National Center for Biotechnology Information (Bethesda, MD, USA).
Illumina sequencing
VDJ rearrangements contained in newborn TCR heavy chain mRNAs were amplified by 5'-RACE PCR using the SMARTerTM RACE cDNA amplification kit (Clontech, Palo Alto, CA, USA). Briefly, for the two CUMS and control experiments, equal amounts of total RNA extracted from the thymus of 6 CUMS males (3 randomly chosen in 2 different litters) were mixed and reverse transcribed according to the instructions of the manufacturer. The same was done using RNA extracted from the thymus of 6 CUMS females, 6 control males and 6 control females. Then, two successive PCRs were performed to amplify TCR VDJ associations in control and CUMS samples of both genders. The first PCR was done using a gene-specific primer, GSP1 (Table 1), which anneals to the first constant domain of C1 and C2 and the UPM primer of the kit. The second PCR was performed on an aliquot of the first PCR using another gene-specific primer, GSP2 (Table 1), which anneals upstream of GSP1 in the first constant domain of C1 and C2, and the NUP primer, which anneals to UPM. PCR products generated by this second PCR were separated on an agarose gel, and those of the expected size were purified using the Nucleospin® Gel and PCR Clean-up kit (Macherey Nagel, Hoerdt, France). Finally, libraries were prepared by adding Illumina adapter sequences (NEBNext® Index Primer for Illumina) by PCR. High-throughput sequencing of these libraries was conducted from both ends to get the entire sequences of VDJ rearrangements using the MiSeq Illumina apparatus of the FR3209 research federation (Vandœuvre-lès-Nancy, France) following Illumina’s standard protocol. Sequencing data were analyzed using the IMGT/High V-quest software (19)
8 (http://www.imgt.org). Then, obtained data were analyzed using a software specifically designed for this project. Sequencing data have been deposited to the NCBI Sequence Read Archive
(https://www.ncbi.nlm.nih.gov/sra) under accession numbers SRP116396 (first experiment) and SRP116369 (second experiment).
Software dedicated to the analysis of VDJ sequences
A software written in Perl, an efficient editing language, was created to calculate the parameters necessary for our studies. This software parsed eight different files, corresponding to eight different samples, produced by IMGT/High V-quest. Two to four seconds of execution was necessary to analyze a file. This execution time was proportional to the number of lines to process, each line corresponding to one sequence. For the first experiment, there was 391106 lines for control females, 203078 lines for control males, 321252 lines for CUMS females and 172252 lines for CUMS males. For the second experiment, there was 350000 lines for control females, 442121 lines for control males, 350000 lines for CUMS females and 375190 lines for CUMS males. The software examined each row and defined those having a CDR3 and a productive functionality. The redundancy of this set of CDR3 sequences was then calculated. A new set of results consisting of one representative of each CDR3 sequence expressed one or more times was then generated. The number of sequences with unique CDR3s was 16242 and 12674 for control females, 10054 and 21106 for control males, 14400 and 14156 for CUMS females, 9775 and 15378 for CUMS males, the first value corresponding to the first experiment and the second one to the second experiment. From this set of results, the following were calculated: the frequency of each V, D and J segment; the length of D; the number of nt deleted at 3’-V and 5’-J extremities; the number of sequences having added non-genomic nt; the frequencies of palindromes at V-D and D-J junctions, and finally associations of all V segments with all J segments for combinations having no D, D1 or D2 segment.
Statistics and dispersion indexes
The StatView software (SAS Institute Inc, Cary, NC, USA) was used to perform statistical analyses of newborn body and thymus weights, corticosterone serum concentrations and RT-qPCR results.
Homogeneity of variance was determined using the Levene test and the normality of distribution was determined using the Kolmogorov-Smirnov test. When homogenous variances and distributions were observed, two-way ANOVAs were done. When the variance and distribution were not homogeneous, Mann-Whitney non-parametric tests were performed. p-values <0.05 indicate significance. All results are shown as means ± SEM.
Indexes of dispersion were used to determine if differences in TCR gene segment expression, or other criteria, exist between groups. The following formula shows, for example, how were calculated these indexes for TCR gene segment expression:
9 n
I(group A –group B) = 0.5* ∑ ǀ F of segmenti from group A – F of segmenti from group B) ǀ
i=1
Where F is the frequency of a given V segment in one group of animals and n is the number of V segments present in the murine TRB locus located on chromosome 6.
These indexes are comprised between 0 and 1. Two tests were performed to analyze obtained indexes. First, we determined if indexes were statistically superior to a 0.05 threshold (which corresponds to a 5% variation of indexes) using a unidirectional non-parametric Mann-Whitney test and p-values <0.05 to indicate
significance. When more than two groups of indexes were considered, Kruskal Wallis non-parametric tests and its post-hoc associated test were performed. Secondly, we compared CUMS vs control indexes as well as female vs male indexes to evaluate the effects of CUMS exposure or gender. In this case, statistical analyses were performed using paired tests. For comparison of two groups of indexes, Wilcoxon tests were performed. For comparison of more than two groups of indexes, Friedman test and its post-hoc associated test we performed. All these statistical analyses were performed using the Anastats website
(http://www.anastats.fr/outils.php).
RESULTS
Evaluation of stress in newborn mice
To evaluate stress in newborn mice, we first determined body and thymus weights. As shown in Figure 1A-B, no difference could be observed between the different groups of pups. We also quantified serum corticosterone (Fig. 1C), the most studied stress hormone in rodents, and transcripts coding for proteins involved in corticosterone action within the thymus (Fig. 1D-E) because circulating and locally produced glucocorticoids can impact T lymphopoiesis (20). Again, no statistically significant difference could be detected between groups, suggesting that maternal CUMS exposure did minimally stress newborns.
T lymphopoiesis in newborns
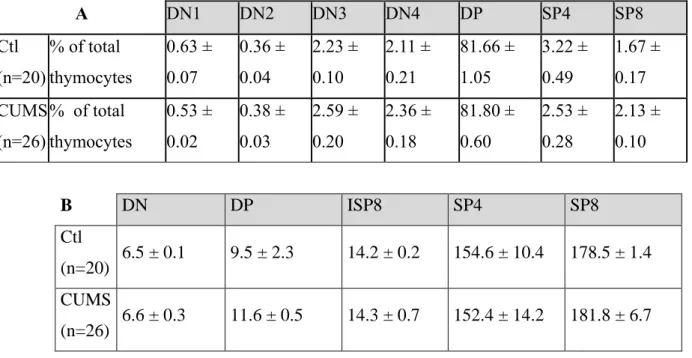
To be sure that T lymphopoiesis was not affected by CUMS exposure, we determined the percentages of pups’ thymocytes according to their maturation stage. Control and CUMS pups were randomly selected for these analyses because it was not possible to genotype them before performing flow cytometry analysis. Later on, when genotyping data were available, we noted that we did not obtain a balanced number of males and females between the different litters. Consequently, flow cytometry data could not be analyzed according to gender. As expected, Table 2A shows that the double positive (DP) population was predominant in newborns’ thymus, while the DN1 and DN2 double negative populations were the less abundant cell types. DN3 and DN4 were as abundant as more mature SP4 and SP8 stages. These low amounts of mature T cells are age-related. No significant difference between CUMS and control
10 newborns was observed at any stage of T cell maturation. We also determined TCR expression levels in DN, DP, ISP8, SP4 and SP8 cells (Table 2B). Again, no difference were observed between groups. These data, combined with those presented above, demonstrate that exposure to chronic unpredictable mild socio-environmental stressors during gestation did not influence neonatal T cell development.
Consequences of CUMS exposure on newborn TCRβ repertoire
While CUMS exposure did not impact thymocyte subpopulations and TCR expression on these cells, we could not exclude that it did not affect the repertoire of TCR chains. To examine this possibility, we constructed TCRβ cDNA libraries, which were subjected to high-throughput (HTS) sequencing, using RNA extracted from the thymus of six males and six females belonging to two different litters for each group of pups and for both experiments. The aim of this strategy was to reduce inter-individual variability. Then, we extracted unique sequences from HTS data to eliminate potential PCR biases and clonal
expansions. This selection was based on CDR3 nucleotide sequences because it is the most diverse part of TCR transcripts. We obtained 9775 to 21106 unique sequences per group of which 15-18% were
nonfunctional and not analyzed.
TCRβ segment usages
As functional TCR genes are created by the assembly of V, D and J segments during T
lymphopoiesis, we analyzed V, D and J segment usages in our libraries. The analysis of Vβ segment usage (Fig. 2A) revealed that the newborn TCR repertoire can be divided into a core repertoire resulting from the expression of three V segments (V12-2, V13-2 and V13-3) and a minor repertoire resulting from the expression of the other 19 V segments available in the TRB locus located on murine chromosome 6. According to Figure 2A, core and minor repertoires represented 75% and 25% of the total repertoire, respectively. Furthermore, V dispersion indexes (Fig. 2B) revealed that the core repertoire was very stable because its indexes were below the 5% threshold. Additionally, this figure showed that the core repertoire was not affected by gender or CUMS exposure as no statistically significant difference could be noted between both comparisons. On the opposite, the minor repertoire was more variable as its indexes were statistically above the 5% threshold. Moreover, a statistically significant difference was observed between core and minor repertoires for the female vs male comparison and a trend towards statistical significance was observed for the CUMS vs control comparison.
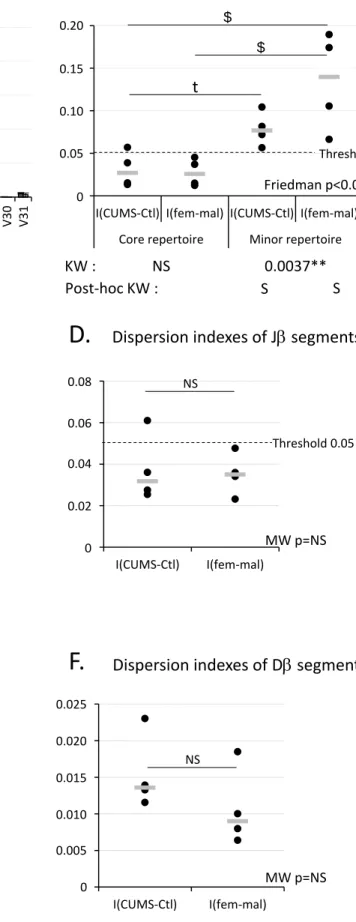
Concerning other gene segments, we noted that Jβ segments belonging to subgroup 2 were more frequently used than those belonging to subgroup 1 (Fig. 2C). In the same way, we noted that the two
available D segments were used by control and CUMS pups with a preference for D1 (Fig. 2E). The analysis of J and D dispersion indexes (Fig. 2D and 2F) showed that variations were always below the 5%
11 Thus, while no change in J or D segment usages could be noted, our data revealed differences between core and minor V repertoires and suggested that CUMS exposure during gestation could affect the minor repertoire.
Associations between TCR gene segments
To precise these results, we studied associations between V and J segments in core and minor repertoires (Fig. 3). D were not taken into account as only two D segments exist in the murine TRB locus and Figures 2E and 2F did not reveal any changes of their expression. In agreement with Figure 2B, Figure 3 showed that VJ associations are stable within the core repertoire, regarding both the 5% threshold and the two types of comparisons. Again, we noted that minor repertoire dispersion indexes were above the 5% threshold but in this case, a statistically significant difference was only observed for the CUMS vs control comparison. A difference was also observed between core and minor repertoires for the CUMS vs control but not for the female vs male comparison.
These data confirm that the core repertoire does not depend on gender and is not affected by CUMS exposure during gestation while the minor repertoire is more variable and sensitive to this combination of socio-environmental stressors.
Impact on V(D)J recombination
Given that the TCR repertoire is created by V(D)J recombination during T cell maturation, we wondered whether this process could be altered. To address this question, we first examined signatures left by RAG proteins. When RAG proteins cut DNA between coding segments and RSS, some nucleotides (nt) can be deleted at the 3’-end of V, on both sides of D and at the 5’-end of J segments. Consequently, we determined the length of D and the number of nucleotides (nt) trimmed off V and J segments to
determine if the position of RAG cleavage sites could be affected by gender or CUMS exposure (Fig. 4). We observed that 27% of V (Fig. 4A) and 13.5% of J (Fig. 4C) sequences did not present deleted nt and that the maximum number of missing nt was 17 for V and 24 for J. These observations indicate that the area subjected to RAG action was wider on J than on V segments. Furthermore, V missing 1 nt were less frequent than those missing 2 nt. In the same way, J missing 1 or 2 nt were less frequent than those missing 3 or 4 nt. These observations suggest either that VDJ associations missing the last nt of V and the two first nt of J could be less frequently selected or that RAG proteins could less easily cut close to recombination signals. Figures 4B, 4D and 4F also showed that variations in the number of deleted nucleotides were not statistically different from the 5% threshold for the three types of segments, even if some statistical differences were noted between comparisons.
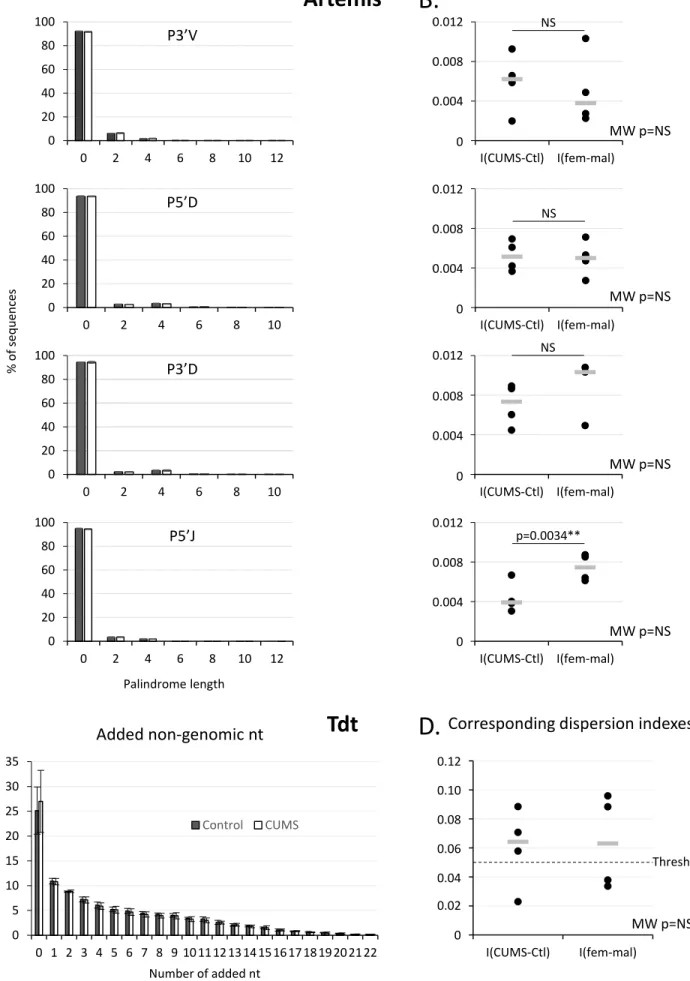
Signatures left by two other proteins involved in V(D)J recombination, Artemis responsible for palindrome appearance and Tdt responsible for nt additions, were similarly analyzed. We noted (Fig. 5A) that on average 93% of the sequences did not present palindromes at their V-D or D-J junctions and that
12 corresponding dispersion indexes (Fig. 5B) were below the 5% threshold. In the same way, dispersion indexes of sequences with or without added nt (Fig. 5D) were not significantly different from the threshold.
These data indicate that RAG, Artemis and Tdt activities, and the consequently the V(D)J recombination process, are unlikely affected by gender or CUMS exposure.
Potential impact on immunity
Finally, we wondered what could be the impact of minor repertoire changes on host immunity. To address this question, we searched for 34 CDR3 known to have self-reactive properties and 91 CDR3 associated with 3 other categories of immune reactions (immunity to foreign pathogens, allograft reactions or tumor-related T cells) in healthy C56BL/6 mice (21) in our sets of neonatal CDR3 sequences. Despite the inherent limitation of such approach (it is limited by the number of CDR3s whose specificities have been established in healthy mice of the same strain), Figures 6A and 6C clearly showed that CUMS and female neonatal minor repertoires contained statistically more self-reactive CDR3 than the minor repertoire of control or male pups, respectively. Moreover, Figures 6B and 6D showed that both repertoires contained CDR3 that can contribute mounting an immune response.
DISCUSSION
In this study, we investigated the impact of prenatal exposure to the CUMS model, used to mimic socio-environmental stressors encountered during space missions (16), on newborn T lymphopoiesis and TCR repertoire.
We first noted that this model, that does not modify gestation duration, litter size or litter weight (22) but alters maternal pup care behavior (17) and sensitizes the offspring to neonatal excitotoxic brain lesions (23), does not affect T cell maturation or thymocytes TCR expression.
Reaching the second objective required the characterization of the neonatal TCR repertoire of C57BL/6 mice. Comparison of this repertoire with the one previously described for adult mice (24–26) revealed a set of characteristics already fixed at birth such as the preference for D1 over D2 and the marked preference for J segments belonging to subgroup 2 over those belonging to subgroup 1 that was shown to be independent of repertoire selection events (24). Other parameters were different between
newborns and adults, such as the frequency of nonfunctional TCR transcripts (∼2% in adults vs. 15-18% in newborns) and V segment usage (TCR repertoire dominated by 3 V in newborns which is not the case in adults). Such differences between neonatal and adult repertoires have already been reported. It was shown, for example, that the number of expressed human V segments increases between the prenatal period and the age of 1-2 years and that the expression of some V segments is age-related (27), indicating that the diversity of the TCR repertoire is age-dependent. In the same way, Sethna and colleagues (28) reported that
13 the choice of murine Vβ segments varies with age. These differences can be attributed to selection events. Indeed, it was shown that differences in thymic selection in young versus adult mice skew the TCR repertoire (29). Another explanation could be epigenetics, as it was shown that the selection of gene segments for V(D)J recombination depends on chromatin conformation (25) and that epigenetic changes control recombinase recruitment (30).
Concerning the effects of chronic exposure to unpredictable mild socio-environmental stressors during gestation on newborn TCR repertoire, we noted that the core TCR repertoire is not affected by CUMS while the minor TCR repertoire representing 25% of the global repertoire, is sensitive to this combination of socio-environmental stressors. This observation strongly suggests, in agreement with Wooldridge et al. (31), that the core repertoire is important for newborn immunity. Furthermore, as we previously showed that hypergravity exposure during murine development modified 85% of the TCR repertoire (11) it appears that socio-environmental stressors have less impact on this repertoire than gravity changes.
In a search for an explanation to CUMS-induced minor repertoire changes, we examined imprints left by enzymes involved in V(D)J recombination. However, analyses of deleted nucleotides at segment ends as well as of palindromes and non-genomic added nucleotides did not highlight alterations of this genetic process. Ward et al. (32) deduced a similar conclusion from their study of the immunoglobulin repertoire of 35-week-old unimmunized mice embarked in a short trip and stay on the ISS. Note that this conclusion does not preclude that differences in repertoires could not be seen upon antigen challenge. Changes in DNA accessibility could perhaps explain CUMS-induced changes. Indeed, epigenetic modifications are sensitive to stressing events as it was shown that early life events interfere with normal developmental evolution of DNA methylation profile in T cells (33). Furthermore, it was shown that chromatin structure impacts segment usage, that recognition of recombination signals and RAG efficacy require the eviction of two histones (H2a and H2b) and that RAG2 recognizes lysine 4 trimethylation on histone H3 before initiating V(D)J recombination (25, 34, 35).
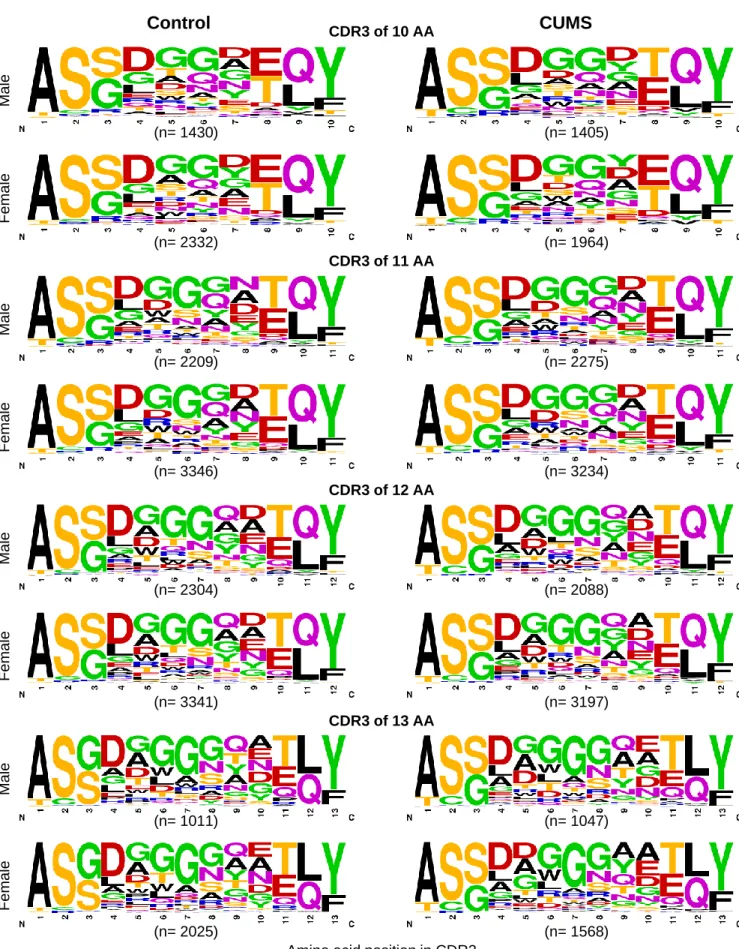
Finally, to evaluate the potential impact of minor repertoire changes on host immunity, we searched for CDR3 associated with different immune reactions in our sets of sequences. This study revealed that the neonatal repertoire contains self-reactive CDR3 and that the frequency of these CDR3 is higher in the minor repertoire of CUMS pups. Previous reports have already demonstrated that neonatal TCR repertoire has cross-reactive properties (29). Wooldridge et al. (31) suggested that a high level of receptor degeneracy, enabling each TCR to recognize multiple peptides, was encouraged during evolution. According to these authors, this would allow the limited peripheral T cell compartment to successfully provide immunity to the vast array of possible different peptides. Our analysis of CDR3 amino acid composition (Fig. 7) supports this hypothesis as it revealed an overrepresentation of glycine residues, known to be associated to
conformational plasticity/flexibility, in these regions implicated in antigenic peptide recognition. Interestingly, this glycine-based plasticity is also present in antibodies from lower vertebrates as it was
14 shown that amphibian IgM heavy chain CDR3s contain 1.6-2.2 times more Gly than corresponding murine CDR3s (37).
In conclusion, despite the fact that CUMS involves only mild socio-environmental stressors and does not modify cell numbers at the various stages of T lymphopoiesis or TCR expression on neonate
thymocytes, it affects the minor TCR repertoire representing 25% of the global repertoire, and increases the frequency of self-reactive CDR3 in that repertoire. This observation will deserve further investigations because during prolonged missions (Mars, asteroids, etc.), more prolonged-development diseases such as autoimmunity could occur (4). To precise the consequences of these changes on host immunity, it will be necessary to determine if CUMS exposure during gestation influences TCR repertoire diversity and immune responses of offspring at an adult age. Several studies have evidenced stress-induced brain epigenetic imprinting and have shown the long-term impact of prenatal stress exposure on offspring behavior (reviewed in 38). It is therefore conceivable that such imprinting exists also for immune cells. Finally, note that the results of this study go beyond astronaut health protection because the CUMS model can also be used to study the impact of everyday life stresses and it is now well established that stress can contribute to the development, or aggravation of several pathologies (39).
ACKNOWLEDGMENTS
The authors thank T. Marday, N. Boggetto and G. Wentzinger for their efficient technical support and assistance. This work was supported by the French Space Agency, the French Ministry of Higher Education and Research, the Université de Lorraine, the Région Lorraine and the Institut National de la Santé et de la Recherche Médicale. Members of the Stress Immunity Pathogens Laboratory acknowledge support by the "Impact Biomolecules" project of the "Lorraine Université d'Excellence" (Investissements d’avenir – ANR). We also acknowledge the ImagoSeine core facility of the Institut Jacques Monod, a member of France BioImaging (ANR-10.INBS-04), and the support of La Ligue Contre le Cancer (R03/75-79). The authors declare no conflicts of interest.
AUTHORSHIP CONTRIBUTIONS
J.-P. Frippiat, C. Cohen-Salmon and S. Ghislin designed research; C. Fonte, S. Kaminski, L. Lanfumey and S. Ghislin performed experiments; A. Vanet conceived the specific software required for this project; C. Fonte, S. Kaminski, A. Vanet and S. Ghislin analyzed data; C. Fonte, S. Ghislin and J.-P. Frippiat wrote the manuscript in conjunction with other authors.
15 REFERENCES
1. Gueguinou, N., Huin-Schohn, C., Bascove, M., Bueb, J.-L., Tschirhart, E., Legrand-Frossi, C., and Frippiat, J.-P. (2009) Could spaceflight-associated immune system weakening preclude the expansion of human presence beyond Earth’s orbit? J. Leukoc. Biol. 86, 1027–1038
2. Frippiat, J.-P., Crucian, B. E., de Quervain, D. J.-F., Grimm, D., Montano, N., Praun, S., Roozendaal, B., Schelling, G., Thiel, M., Ullrich, O., and Choukèr, A. (2016) Towards human exploration of space: The THESEUS review series on immunology research priorities. npj Microgravity 2, 16040.
3. Kimzey, S. L. (1977) Hematology and immunology studies. In Biomedical Results from Skylab (Johnson, R. S., and Dietlein, L. F., eds) pp. 248-282, NASA, Washington, DC.
4. Crucian, B., Babiak-Vazquez, A., Johnston, S., Pierson, D. L., Ott, C. M., and Sams, C. (2016) Incidence of clinical symptoms during long-duration orbital spaceflight. Int. J. Gen. Med. 9, 383–391 5. Vacek, A., Michurina, T. V., Serova, L. V., Rotkovská, D., and Bartonícková, A. (1991) Decrease in the
number of progenitors of erythrocytes (BFUe, CFUe), granulocytes and macrophages (GM-CFC) in bone marrow of rats after a 14-day flight onboard the Cosmos-2044 Biosatellite. Folia Biol. (Praha) 37, 35–41
6. Ichiki, A. T., Gibson, L. A., Jago, T. L., Strickland, K. M., Johnson, D. L., Lange, R. D., and Allebban, Z. (1996) Effects of spaceflight on rat peripheral blood leukocytes and bone marrow progenitor cells. J.
Leukoc. Biol. 60, 37–43
7. Davis, T. A., Wiesmann, W., Kidwell, W., Cannon, T., Kerns, L., Serke, C., Delaplaine, T., Pranger, A., and Lee, K. P. (1996) Effect of spaceflight on human stem cell hematopoiesis: suppression of
erythropoiesis and myelopoiesis. J. Leukoc. Biol. 60, 69–76
8. Ortega, M. T., Pecaut, M. J., Gridley, D. S., Stodieck, L. S., Ferguson, V., and Chapes, S. K. (2009) Shifts in bone marrow cell phenotypes caused by spaceflight. J. Appl. Physiol. 106, 548–555
9. Lescale, C., Schenten, V., Djeghloul, D., Bennabi, M., Gaignier, F., Vandamme, K., Strazielle, C., Kuzniak, I., Petite, H., Dosquet, C., Frippiat, J.-P., and Goodhardt, M. (2015) Hind limb unloading, a model of spaceflight conditions, leads to decreased B lymphopoiesis similar to aging. FASEB J. 29, 455–463
10. Woods, C. C., Banks, K. E., Gruener, R., and DeLuca, D. (2003) Loss of T cell precursors after spaceflight and exposure to vector-averaged gravity. FASEB J. 17, 1526–1528
11. Ghislin, S., Ouzren-Zarhloul, N., Kaminski, S., and Frippiat, J.-P. (2015) Hypergravity exposure during gestation modifies the TCRβ repertoire of newborn mice. Sci. Rep. 5, 9318.
12. Morahan, G., Malcolm, L., and Miller, J. F. (1987) Expression of T cell antigen receptor and
immunoglobulin genes in lymphoid organs visualized by in situ hybridization. EMBO J. 6, 3679–3685 13. Hunter, M. C., Teijeira, A., and Halin, C. (2016) T Cell Trafficking through Lymphatic Vessels. Front.
16 14. Schatz, D. G., and Swanson, P. C. (2011) V(D)J recombination: mechanisms of initiation. Annu. Rev.
Genet. 45, 167–202
15. Ma, Y., Pannicke, U., Schwarz, K., and Lieber, M. R. (2002) Hairpin opening and overhang processing by an Artemis/DNA-dependent protein kinase complex in nonhomologous end joining and V(D)J recombination. Cell 108, 781–794
16. Gaignier, F., Legrand-Frossi, C., Stragier, E., Mathiot, J., Merlin, J.-L., Cohen-Salmon, C., Lanfumey, L., and Frippiat, J.-P. (2018) A model of chronic exposure to unpredictable mild socio-environmental stressors replicates some spaceflight-induced immunological changes. Front. Physiol. 9, 541
17. Pardon, M., Gérardin, P., Joubert, C., Pérez-Diaz, F., and Cohen-Salmon, C. (2000) Influence of
prepartum chronic ultramild stress on maternal pup care behavior in mice. Biol. Psychiatry 47, 858–863 18. Huin-Schohn, C., Gueguinou, N., Schenten, V., Bascove, M., Gauquelin-Koch, G., Baatout, S.,
Tschirhart, E., and Frippiat, J.-P. (2013) Gravity changes during animal development affect IgM heavy-chain transcription and probably lymphopoiesis. FASEB J. 27, 333–341
19. Alamyar, E., Duroux, P., Lefranc, M.-P., and Giudicelli, V. (2012) IMGT® tools for the nucleotide analysis of immunoglobulin (IG) and T cell receptor (TR) V-(D)-J repertoires, polymorphisms, and IG mutations: IMGT/V-QUEST and IMGT/HighV-QUEST for NGS. In Immunogenetics (Christiansen, F. T., and Tait, B. D., eds) Vol. 882, pp. 569–604, Humana Press, Totowa, NJ
20. Taves, M. D., Hamden, J. E., and Soma, K. K. (2017) Local glucocorticoid production in lymphoid organs of mice and birds: Functions in lymphocyte development. Horm. Behav. 88, 4–14
21. Madi, A., Shifrut, E., Reich-Zeliger, S., Gal, H., Best, K., Ndifon, W., Chain, B., Cohen, I. R., and Friedman, N. (2014) T-cell receptor repertoires share a restricted set of public and abundant CDR3 sequences that are associated with self-related immunity. Genome Res. 24, 1603–1612
22. Misdrahi, D., Pardon, M. C., Pérez-Diaz, F., Hanoun, N., and Cohen-Salmon, C. (2005) Prepartum chronic ultramild stress increases corticosterone and estradiol levels in gestating mice: Implications for postpartum depressive disorders. Psychiatry Res. 137, 123–130
23. Rangon, C.-M., Fortes, S., Lelièvre, V., Leroux, P., Plaisant, F., Joubert, C., Lanfumey, L., Cohen-Salmon, C., and Gressens, P. (2007) Chronic mild stress during gestation worsens neonatal brain lesions in mice. J. Neurosci. 27, 7532–7540
24. Candéias, S., Waltzinger, C., Benoist, C., and Mathis, D. (1991) The V beta 17+ T cell repertoire: skewed J beta usage after thymic selection; dissimilar CDR3s in CD4+ versus CD8+ cells. J. Exp. Med. 174, 989–1000
25. Ndifon, W., Gal, H., Shifrut, E., Aharoni, R., Yissachar, N., Waysbort, N., Reich-Zeliger, S., Arnon, R., and Friedman, N. (2012) Chromatin conformation governs T-cell receptor Jβ gene segment usage. Proc.
Natl. Acad. Sci. U.S.A. 109, 15865–15870
26. Madi, A., Poran, A., Shifrut, E., Reich-Zeliger, S., Greenstein, E., Zaretsky, I., Arnon, T., Laethem, F. V., Singer, A., Lu, J., Sun, P. D., Cohen, I. R., and Friedman, N. (2017) T cell receptor repertoires of
17 mice and humans are clustered in similarity networks around conserved public CDR3 sequences. Elife 6, e22057.
27. Murray, J. M., Messier, T., Rivers, J., O’Neill, J. P., Walker, V. E., Vacek, P. M., and Finette, B. A. (2012) VDJ recombinase-mediated TCR β locus gene usage and coding joint processing in peripheral T cells during perinatal and pediatric development. J. Immunol. 189, 2356–2364
28. Sethna, Z., Elhanati, Y., Dudgeon, C. S., Callan, C. G., Levine, A. J., Mora, T., and Walczak, A. M. (2017) Insights into immune system development and function from mouse T-cell repertoires. Proc.
Natl. Acad. Sci. U.S.A. 114, 2253–2258
29. Dong, M., Artusa, P., Kelly, S. A., Fournier, M., Baldwin, T. A., Mandl, J. N., and Melichar, H. J. (2017) Alterations in the thymic selection threshold skew the self-reactivity of the TCR repertoire in neonates. J. Immunol. 199, 965–973
30. Subrahmanyam, R., Du, H., Ivanova, I., Chakraborty, T., Ji, Y., Zhang, Y., Alt, F. W., Schatz, D. G., and Sen, R. (2012) Localized epigenetic changes induced by DH recombination restricts recombinase to DJH junctions. Nat. Immunol. 13, 1205–1212
31. Wooldridge, L., Ekeruche-Makinde, J., van den Berg, H. A., Skowera, A., Miles, J. J., Tan, M. P., Dolton, G., Clement, M., Llewellyn-Lacey, S., Price, D. A., Peakman, M., and Sewell, A. K. (2012) A single autoimmune T cell receptor recognizes more than a million different peptides. J. Biol. Chem. 287, 1168–1177
32. Ward, C., Rettig, T. A., Hlavacek, S., Bye, B. A., Pecaut, M. J., and Chapes, S. K. (2018) Effects of spaceflight on the immunoglobulin repertoire of unimmunized C57BL/6 mice. Life Sci. Space Res. 16, 63–75
33. Massart, R., Nemoda, Z., Suderman, M. J., Sutti, S., Ruggiero, A. M., Dettmer, A. M., Suomi, S. J., and Szyf, M. (2016) Early life adversity alters normal sex-dependent developmental dynamics of DNA methylation. Dev. Psychopathol. 28, 1259–1272
34. Matthews, A. G. W., Kuo, A. J., Ramón-Maiques, S., Han, S., Champagne, K. S., Ivanov, D., Gallardo, M., Carney, D., Cheung, P., Ciccone, D. N., Walter, K. L., Utz, P. J., Shi, Y., Kutateladze, T. G., Yang, W., Gozani, O., and Oettinger, M. A. (2007) RAG2 PHD finger couples histone H3 lysine 4
trimethylation with V(D)J recombination. Nature 450, 1106–1110
35. Bevington, S., and Boyes, J. (2013) Transcription-coupled eviction of histones H2A/H2B governs V(D)J recombination. EMBO J. 32, 1381–1392
36. Crooks, G. E., Hon, G., Chandonia, J.-M., and Brenner, S. E. (2004) WebLogo: a sequence logo generator. Genome Res. 14, 1188–1190
37. Fonte, C., Gruez, A., Ghislin, S., and Frippiat, J.-P. (2015) The urodele amphibian Pleurodeles waltl has a diverse repertoire of immunoglobulin heavy chains with polyreactive and species-specific features.
18 38. Bale, T. L. (2015) Epigenetic and transgenerational reprogramming of brain development. Nat. Rev.
Neurosci. 16, 332–344
39. Glaser, R., and Kiecolt-Glaser, J. K. (2005) Stress-induced immune dysfunction: implications for health.
19 FIGURE LEGENDS
Figure 1. Evaluation of stress in control and CUMS newborns. A, B Newborn body and thymus weights. C Corticosterone concentrations in newborn sera determined by ELISA. D, E Quantification, by RT-qPCR, of NR3C1 and 11HSD1 mRNAs in newborn thymocytes. These transcripts encode respectively the
glucocorticoid receptor and 11β-hydroxysteroid dehydrogenase type 1 involved in corticosterone activation. mRNA levels were normalized to three housekeeping transcripts. The relative value obtained with control males was set to 1. Error bars reflect the standard error of the mean. No statistically significant differences were found using two-way ANOVA tests. Results representative of the two CUMS exposures.
Figure 2. TCRβ gene segment usages in control and CUMS newborns. A, C, E Vβ, Jβ and Dβ segment usages in TCRβ transcripts of pups. Means of 4 independent measures from 2 independent experiments. Standard deviation are shown. B, D, F Dispersion indexes of Vβ, Jβ and Dβ segments for CUMS vs control and for female vs male comparisons. Each dot corresponds to one measure and the gray line indicates the median. Statistically significant differences by comparison to the 0.05 threshold were observed for the minor V repertoire for both comparisons using the Kruskal Wallis (KW) test and its post-hoc associated test. For J and D indexes, no statistically significant differences by comparison to the threshold were noted using the Mann-Whitney (MW) test. Furthermore, for Vβ dispersion indexes, statistically significant variations between comparisons were identified using the Friedman test and its associated post-hoc test while no such difference could be noted for J or D using the Wilcoxon test. $ indicates a statistically significant
difference, t a tendency, and NS no statistical difference between comparisons.
Figure 3. Dispersion indexes of combinations between V and J segments in core and minor repertoires. Indexes were calculated for CUMS vs control and for female vs male comparisons in both repertoires. Each dot corresponds to one measure and the gray line indicates the median. Statistically significant variations by comparison to the 0.05 threshold were determined using the Kruskal Wallis (KW) test and its post-hoc associated test whose results are indicated underneath the graph. A statistically significant difference, by comparison to the threshold, was only noted for the CUMS vs control comparison within the minor repertoire. Furthermore, using the Friedman test and its post-hoc test, we noted that dispersion indexes for both CUMS vs control comparisons were statistically different. $ indicates a statistically significant difference.
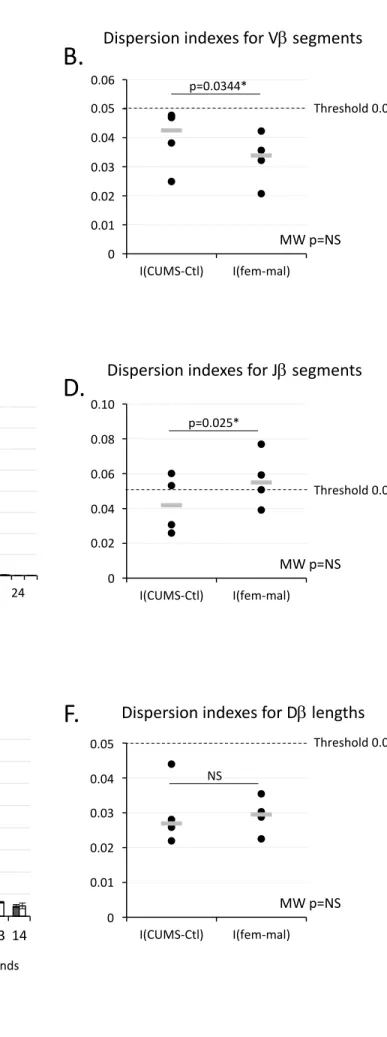
Figure 4. Nucleotides trimmed off V J and D segments. A, C, E Distribution of sequences according to the number of genomic nucleotides removed at the 3’-end of Vβ, at the 5’-end of Jβ or at both ends of D segments during V(D)J recombination. Means of 4 independent measures from 2 independent experiments.
20 Standard deviation are shown. B, D, F For each analysis, indexes of dispersion for CUMS vs control and for female vs male comparisons were calculated. Each dot corresponds to one measure. Gray lines indicate medians. Mann-Whitney (MW) tests did not reveal statistically significant differences by comparison to the 0.05 threshold for the three kind of dispersion indexes. Wilcoxon tests showed that dispersion indexes for CUMS vs control comparisons are different from those for female vs male comparisons regarding the number of nucleotides deleted at the 3’-end of Vβ or at the 5’-end of Jβ segments.
Figure 5. Palindromes created by Artemis and nucleotides added by Tdt during V(D)J recombination. A, C Distribution of sequences according to palindrome length and location or to the number of added
non-genomic nucleotides. Means of 4 independent measures from 2 independent experiments. Standard deviation are shown. P3’V, palindromes in 3’ of V segments. P5’D, palindrome in 5’ of D segments. P3’D,
palindromes in 3’ of D segments. P5’J, palindromes in 5’ of J segments. B, D Corresponding dispersion indexes for CUMS vs control and female vs male comparisons. Each dot corresponds to one measure and the gray line indicates the median. Mann-Whitney (MW) tests did not reveal statistically significant differences by comparison to the 0.05 threshold. Wilcoxon tests showed that dispersion indexes for the CUMS vs control comparison are different from those for the female vs male comparison regarding the number of palindromes at J 5’-end.
Figure 6. Occurrences of CDR3s associated with immune functions in neonatal core and minor
TCR repertoires. A, C Variations of occurrence frequency of CDR3s associated with self-reactivity in CUMS newborns by comparison to controls or in female newborns by comparison to males. B, D Variation of occurrence frequency of CDR3s associated with other immune reactions in CUMS newborns by
comparison to controls or in female newborns by comparison to males. Frequencies were determined by aligning sequences obtained in this study with 34 CDR3s associated with self-reactivity or 91 CDR3s associated with other immune reactions (immunity to foreign pathogens, allograft reactions or tumor-related T cells) in healthy C57BL/6 mice. Analyses performed on CDR3 of 10, 11, 12 and 13 AA. Criteria for CDR3 comparison: ≤ 2 AA difference; e-value ≤ 0.002; identity ≥ 80 %; matching ≥ 80 %; no gap.
Figure 7. Amino acid frequencies at each position within TCRβ CDR3 regions. CDR3s were defined
according to the international ImMunoGeneTics information system®. The height of each letter indicates the relative frequency of the corresponding amino acid at that position. CDR3s have been classified according to their size. Amino acids were grouped into six categories: polar GYC (green), polar amide group QN
(purple), polar alcohol group ST (yellow), basic KRH (blue), acidic DE (red) and hydrophobic AVLIPWFM (black). Panels constructed using Weblogo (36). ‘n’ indicates the number of sequences used to generate each panel.
Figure 1
0 1 2
Control CUMS Control CUMS
Males Females Body w e ight (g) Body weight A n=11 n=17 n=17 n=12 0 10 20 30 40 50 60 70
Control CUMS Control CUMS
Males Females Conce ntra tion (ng/m l) Corticosterone C n=10 n=12 n=10 n=10 0 1 2
Control CUMS Control CUMS
Males Females Re lativ e expres sion NR3C1 D n=8 n=12 n=11 n=11 0 1 2 3 4 5 6 7 8
Control CUMS Control CUMS
Males Females Thy mus w eight (mg ) Thymus weight B n=11 n=17 n=17 n=12 n=8 0 1 2
Control CUMS Control CUMS
Males Females Re lativ e expres sion 11βHSD1 n=8 n=12 n=11 n=11 E NS NS NS NS NS NS NS NS NS NS
Figure 1
Figure 2
0 10 20 30 40 50 V1 V2 V3 V4 V5 V12 -1 V12 -2 V13 -1 V13 -2 V13 -3 V14 V15 V16 V17 V19 V20 V21 V23 V26 V29 V30 V31 % of sequenc es Control CUMSA.
S indicates statistically significant differences from the threshold. $ indicates statistically significant differences between comparisons (post-hoc Friedman test).
C.
0 5 10 15 20 25 J1 -1 J1 -2 J1 -3 J1 -4 J1 -5 J1 -6 J2 -1 J2 -2 J2 -3 J2 -4 J2 -5 J2 -7 % of sequenc es control CUMS Jb VbE.
0 10 20 30 40 50 60 No D D1 D2 % of sequenc es control CUMS DbF.
Subgroup 1 Subgroup 2B.
KW : NS 0.0037** S S Post-hoc KW : 0 0.05 0.1 0.15 0.2I(CUMS-Ctl) I(fem-mal) I(CUMS-Ctl) I(fem-mal)
Core repertoire Minor repertoire
Dispersion indexes of Vb segments $ Threshold 0.05 $ t Friedman p<0.001*** 0.20 0.15 0.10 0.05 0 0 0.02 0.04 0.06 0.08 I(CUMS-Ctl) I(fem-mal)
Dispersion indexes of Jb segments
MW p=NS Threshold 0.05 NS
D.
0.08 0.06 0.04 0.02 0 0 0.005 0.01 0.015 0.02 0.025 I(CUMS-Ctl) I(fem-mal) MW p=NS Dispersion indexes of Db segmentsNS 0.025 0.020 0.015 0.010 0.005 0
Figure 2
Figure 3
0 0.05 0.1 0.15
I(CUMS-Ctl) I(fem-mal) I(CUMS-Ctl) I(fem-mal)
Core Minor
Dispersion indexes of VbJb combinations
KW : NS 0.0345* S NS Post-hoc KW : Friedman p=0.0015** $ $ Threshold 0.05 0.15 0.10 0.05 0
S indicates statistically significant differences from the threshold. $ indicates statistically significant differences between comparisons (post-hoc Friedman test).
Figure 4
0 5 10 15 20 25 30 0 1 2 3 4 5 6 7 8 9 10 11 12 13 14 15 16 17 % of se qu en cesNumber of nt deleted at Vb 3’-end
Control CUMS Vb 0 2 4 6 8 10 12 14 16 0 2 4 6 8 10 12 14 16 18 20 22 24 % of sequenc es
Number of nt deleted at Jb 5’-end Control CUMS Jb 0 2 4 6 8 10 12 14 16 0 1 2 3 4 5 6 7 8 9 10 11 12 13 14 % of se qu en ces
Db length reflecting the nb of nt deleted at both ends
Control CUMS Db
A.
C.
E.
0 0.01 0.02 0.03 0.04 0.05 0.06 I(CUMS-Ctl) I(fem-mal)Dispersion indexes for Vb segments
MW p=NS Threshold 0.05 p=0.0344*
B.
0.06 0.05 0.04 0.01 0 0.03 0.02 0 0.02 0.04 0.06 0.08 0.1 I(CUMS-Ctl) I(fem-mal) MW p=NS Dispersion indexes for Jb segmentsThreshold 0.05 p=0.025*
D.
0.10 0.06 0.04 0 0.02 0.08 0 0.01 0.02 0.03 0.04 0.05 I(CUMS-Ctl) I(fem-mal) MW p=NS Dispersion indexes for Db lengthsThreshold 0.05 NS
F.
0.05 0.04 0.01 0 0.03 0.02Figure 4
Figure 5
C.
0 5 10 15 20 25 30 35 0 1 2 3 4 5 6 7 8 9 10 11 12 13 14 15 16 17 18 19 20 21 22 % of se qu en ces Number of added nt Control CUMS Added non-genomic nt 0 0.02 0.04 0.06 0.08 0.1 0.12 I(CUMS-Ctl) I(fem-mal) MW p=NS Corresponding dispersion indexesThreshold 0.05
D.
0.10 0.06 0.04 0 0.02 0.08 0.12A.
0 20 40 60 80 100 0 2 4 6 8 10 0 20 40 60 80 100 0 2 4 6 8 10 12 0 20 40 60 80 100 0 2 4 6 8 10 P3’V P5’D P3’D P5’J % of se qu en ces Palindrome length 0 20 40 60 80 100 0 2 4 6 8 10 12 0 0.004 0.008 0.012 I(CUMS-Ctl) I(fem-mal) 0 0.004 0.008 0.012 I(CUMS-Ctl) I(fem-mal) 0 0.004 0.008 0.012 I(CUMS-Ctl) I(fem-mal) 0 0.004 0.008 0.012 I(CUMS-Ctl) I(fem-mal)Corresponding dispersion indexes
MW p=NS MW p=NS MW p=NS MW p=NS NS NS NS p=0.0034**
B.
0.012 0.008 0.004 0 0.012 0.008 0.004 0 0.012 0.008 0.004 0 0.012 0.008 0.004 0Artemis
Tdt
Figure 5
Figure 6
CUMS / Control
Female / Male
(Ffem al e -Fmal e ) / Fmal e (FCUMS -Fcon tr ol ) / Fcon tr ol S S SA.
C.
B.
D.
Variati o n rate of CUMS rel ativ e to con trol Variati o n rate of fem ale rel ativ e to mal e -2 -1 0 1 2 3 V12-2 V13-2 V13-3 19 other Vb Self-reactivity 19 other Vb -1 0 1 2 V12-2 V13-2 V13-3 19 other Vb Other immune reactions 19 other Vb -2 -1 0 1 2 3 4 V12-2 V13-2 V13-3 19 other Vb Self-reactivity 19 other Vb -1 0 1 2 V12-2 V13-2 V13-3 19 other Vb Other immune reactions 19 other VbCore Minor Core Minor
Core Minor Core Minor
S indicates values significantly different from 0 as revealed using Mann-Whitney tests.
Figure 6
Control CUMS Male Female CDR3 of 10 AA (n= 1430) (n= 1405) (n= 2332) (n= 1964) Male Female CDR3 of 11 AA (n= 2209) (n= 2275) (n= 3346) (n= 3234) Male Female CDR3 of 12 AA (n= 2304) (n= 2088) (n= 3341) (n= 3197) Male Female CDR3 of 13 AA
Amino acid position in CDR3
(n= 1011) (n= 1047)
(n= 2025) (n= 1568)
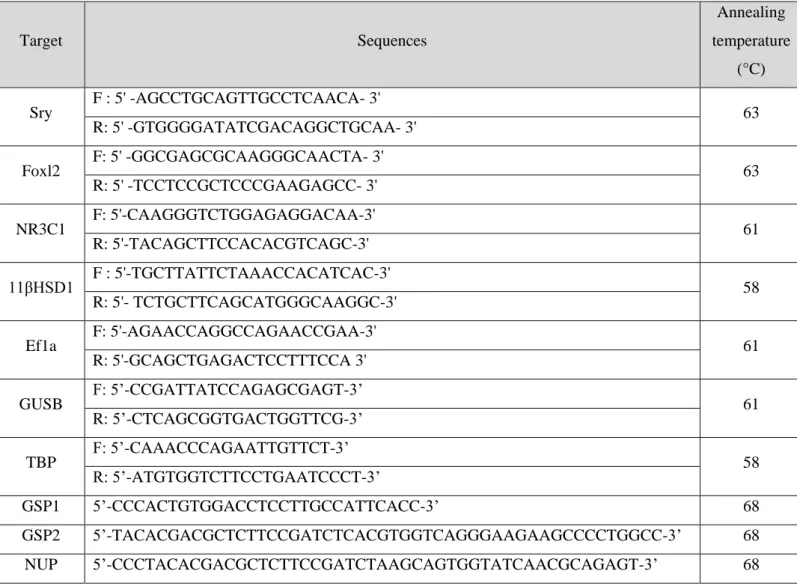
Table 1. Primers used in this study. Target Sequences Annealing temperature (°C) Sry F : 5' -AGCCTGCAGTTGCCTCAACA- 3' 63 R: 5' -GTGGGGATATCGACAGGCTGCAA- 3' Foxl2 F: 5' -GGCGAGCGCAAGGGCAACTA- 3' 63 R: 5' -TCCTCCGCTCCCGAAGAGCC- 3' NR3C1 F: 5'-CAAGGGTCTGGAGAGGACAA-3' 61 R: 5'-TACAGCTTCCACACGTCAGC-3' 11βHSD1 F : 5'-TGCTTATTCTAAACCACATCAC-3' 58 R: 5'- TCTGCTTCAGCATGGGCAAGGC-3' Ef1a F: 5'-AGAACCAGGCCAGAACCGAA-3' 61 R: 5'-GCAGCTGAGACTCCTTTCCA 3' GUSB F: 5’-CCGATTATCCAGAGCGAGT-3’ 61 R: 5’-CTCAGCGGTGACTGGTTCG-3’ TBP F: 5’-CAAACCCAGAATTGTTCT-3’ 58 R: 5’-ATGTGGTCTTCCTGAATCCCT-3’ GSP1 5’-CCCACTGTGGACCTCCTTGCCATTCACC-3’ 68 GSP2 5’-TACACGACGCTCTTCCGATCTCACGTGGTCAGGGAAGAAGCCCCTGGCC-3’ 68 NUP 5’-CCCTACACGACGCTCTTCCGATCTAAGCAGTGGTATCAACGCAGAGT-3’ 68 F, forward. R, reverse.
1 Table 2. Analysis of T lymphopoiesis in pups produced by control or CUMS exposed mice.
A DN1 DN2 DN3 DN4 DP SP4 SP8 Ctl (n=20) % of total thymocytes 0.63 ± 0.07 0.36 ± 0.04 2.23 ± 0.10 2.11 ± 0.21 81.66 ± 1.05 3.22 ± 0.49 1.67 ± 0.17 CUMS (n=26) % of total thymocytes 0.53 ± 0.02 0.38 ± 0.03 2.59 ± 0.20 2.36 ± 0.18 81.80 ± 0.60 2.53 ± 0.28 2.13 ± 0.10 B DN DP ISP8 SP4 SP8 Ctl (n=20) 6.5 ± 0.1 9.5 ± 2.3 14.2 ± 0.2 154.6 ± 10.4 178.5 ± 1.4 CUMS (n=26) 6.6 ± 0.3 11.6 ± 0.5 14.3 ± 0.7 152.4 ± 14.2 181.8 ± 6.7
A Percentages of newborn thymocytes in the different maturation stages determined using anti-CD25, anti-CD44, anti-CD4 and anti-CD8 antibodies. B TCRβ expression on DN, DP, ISP8, SP4 and SP8 cells (geometric mean of fluorescence intensity) determined using anti-CD4, anti-CD8 and anti-TCR antibodies. Data shown as means ± SEM. Two-way ANOVA did not reveal statistically significant differences. DN: Double Negative cells; DP: Double Positive cells; ISP8: Immature Simple Positive cells; SP: Simple Positive cells. Results representative of the two CUMS exposures.