Publisher’s version / Version de l'éditeur:
ASHRAE Transactions, 101, 1, pp. 239-248, 1995-09-01
READ THESE TERMS AND CONDITIONS CAREFULLY BEFORE USING THIS WEBSITE. https://nrc-publications.canada.ca/eng/copyright
Vous avez des questions? Nous pouvons vous aider. Pour communiquer directement avec un auteur, consultez la
première page de la revue dans laquelle son article a été publié afin de trouver ses coordonnées. Si vous n’arrivez pas à les repérer, communiquez avec nous à PublicationsArchive-ArchivesPublications@nrc-cnrc.gc.ca.
Questions? Contact the NRC Publications Archive team at
PublicationsArchive-ArchivesPublications@nrc-cnrc.gc.ca. If you wish to email the authors directly, please see the first page of the publication for their contact information.
NRC Publications Archive
Archives des publications du CNRC
This publication could be one of several versions: author’s original, accepted manuscript or the publisher’s version. / La version de cette publication peut être l’une des suivantes : la version prépublication de l’auteur, la version acceptée du manuscrit ou la version de l’éditeur.
Access and use of this website and the material on it are subject to the Terms and Conditions set forth at
On the accuracy and repeatability of the pulse and step- down tracer
gas methods for measuring mean ages of air
Zhang, J. S.; Shaw, C. Y.; Magee, R. J.
https://publications-cnrc.canada.ca/fra/droits
L’accès à ce site Web et l’utilisation de son contenu sont assujettis aux conditions présentées dans le site LISEZ CES CONDITIONS ATTENTIVEMENT AVANT D’UTILISER CE SITE WEB.
NRC Publications Record / Notice d'Archives des publications de CNRC:
https://nrc-publications.canada.ca/eng/view/object/?id=32877c61-3278-4032-b8bc-b0d04b874ec4 https://publications-cnrc.canada.ca/fra/voir/objet/?id=32877c61-3278-4032-b8bc-b0d04b874ec4Ser
TH1
N21d no,3256
c . 2 BLDGNational Research Conseil national
1*1
Council Canada de recherches CanadaInstitute for lnstitut de Research in recherche en Construction construction
- -
On the Accuracy and Repeatability
of the Pulse and Step-Down 7Pacer
Gas Methods for Measuring Mean
Ages of Air
by
Jianshun
S.
Zhang,
C.Y.
Shaw, RobeB
..I.Maaee
Reprinted from:
ASHRAE
Transactions: Research
Vol. 101, Part 1, 1 995, pages 239-248
(IRC Paper No. 3256)
ON THE ACCURACY AND
REPEATABILITY OF THE PULSE AND
*
STEP-DOWN TRACER GAS METHODS
FOR MEASURING MEAN AGES OF AIR
Jianshun S. Zhang, Ph.D.
Chia Y. Shaw, Ph.D., P.E.
Robert J.
Magee
Associate Member ASHRAE Member ASHRAE
ABSTRACT The objective of this study was to quantify the accuracy
Tests were conducted in a full-scale ofice mom with internal heat loads and furnishings to analyze and estimate the accuracy and repeatability of the pulse and step-down tracer gas methods for measuring mean ages of air: It was found that the error band due to the combined effect of the limited accuracy and repeatability war wider for the pulse method than for the step-down method. An example is pro- vided to illustrate how these results can be used to interpret the measurements of mean ages of air in evaluating the per- formance of ventilation systems.
INTRODUCTION
The local mean age of air for a local point (location) in a room is defined as the average time needed for the outdoor air to reach that point. The room mean age of air is defined as the average time needed for the outdoor air to reach all local points in the room and is the spatial average of the local mean ages of air for all local points. Three tracer gas pulse and step-down methods have been introduced by Sandberg and Sjoberg (1983) for measuring the local and room mean ages of air in buildings. Although these methods have been used for laboratory and field studies of ventilation and air
distribution in rooms, little information is available regard- ing the accuracy and repeatability of these methods when applied to practical conditions.
Some studies have been conducted using small or full- size chambers to evaluate the repeatability of the tracer gas methods for measuring local and room mean ages of air (Sandberg and Sjoberg 1983; Niemela et al. 1989; Sutcliffe and Waters 1990; Breum 1992). However, these studies were limited to isothermal and empty room conditions. The accu-
L
racy of the tracer gas methods was not clearly addressed in these studies. Therefore, there is a need to evaluate the accu- racy and repeatability of these tracer gas methods under real-
I
istic ventilation conditions so that the results of tracer gas
and repeatability of the pulse and stegdown <decay) tracer gas methods for measuring mean ages of air in a realistic office room with internal heat loads and furnishings.
TEST FACILITY AND EXPERIMENTAL CONDITIONS Test Room
Tests were conducted in a full-scale test room (4.9 m by 4.8 m by 2.9 m [16 ft by 15.7 ft by 9.4 ft]) fitted with a mock-up workstation (Figure 1). The internal heat loads were generated by the lights at the ceiling, a computer, and two light bulbs--one 60 W and one 10 W. The two light bulbs were used to simulate the sensible heat of an office worker. The furnishings included the partition, a desk, a table, a bookcase, a file cabinet, a personal computer, and a chair. The room was equipped with slot ceiling diffusers and returns (recessed air-light fixtures). The supply air was con- ditioned by an independent heating, ventilating, and air-con- ditioning (HVAC) system (Figure 2). Dampers were used to adjust the airflow rates in the outdoor air duct and total sup- ply air through the diffusers and return slots. These airflow rates were monitored during the tests using orifice plates. During all the tests, the outdoor and total airflow rates were maintained at 2 k 0 . 5 U s ( 4 2 ~ 1 cfm) and 10021 U s ( 2 1 2 ~ 2 cfm), respectively. The supply air temperature was main- tained at 23OC~0.4~C (73.4OFk0.7OF) and the return air tem- perature was 24.4°C+0.80C (75.g°F+1.40F) due to the total internal heat loads (about 152 W [519 Btulh]). The test room was kept under neutral pressure conditions to minimize the air exchange between the test room and its surrounding area. The average and instantaneous flow rate differences between the supply diffusers and return grilles during a test period were less than 1% and 2% of the total airflow rates, respec- tively, which indicated that there was very little air leakage through the walls, floor, and ceiling of the test room.
Sampling Systems
methods can be properly interpreted (Fisk and ~aulkner Two SF6 (sulfur hexafluoride) tracer gas sampling and
1992). analyzing systems were used in the measurements. Each sys-
Jianshun S. Zhang is a research associate, Chia Y. Shaw is a senior researcher, and Robert J. Magee is a technical officer at the Building- Performance Laboratory, Institute for Research in Construction, National Research Council Canada. Ottawa.
1: Partltlons <1.78x9.47x0.07 n) 21 Desk (0.77~1.54~0.76 n) 3: Chalr 41 Desk <0.86x1.54x0.79 n) 51 Conputer 61 Bookshelf (0.30~0.96~1.23 n) 7: Flllng Cablnet (0.71~0.49~1.30 n> 01 Sanpllng Locotlon (1.10 n hlgh)
Figure 1 Test room configuration.
tem included sampling pumps, a sampling valve and control- ler, a gas chromatograph, and data-acquisition equipment. A personal computer was used to automate the entire data-
#
acquisition process (Figure 3).
The minimum sampling interval for both sampling sys- tems is 0.25 minutes (Evans and Shaw 1988). As shown in Figure 4, the variation in the measured mean age of air due
to different sampling intervals was much larger for the pulse method than the step-down method. One main reason is that the pulse method requires a smaller sampling interval in order to catch the initial peak of the tracer gas concentration. For practical applications, no significant difference (less than
2 minutes) in mean age of air would be expected if the sam-
pling interval were less than 5 and 15 minutes for pulse and stepdown methods, respectively. In the present study, sam- pling intervals from 0.25 to 1.4 minutes and 0.25 to 4 min- utes were used for the pulse and decay methods, respec- tively, depending on the number of locations sampled. This means that the error due to the variation in the sampling interval is negligible (less than 1 minute) for the measured results in this study.
Air samples were taken from the supply air duct, return air duct, exhaust air duct (Figure 2), and within the room (location 0 in Figure 1) using small air pumps. The gas chro- matograph was calibrated before each test to ensure that a
21% repeatability in the concentration measurements for the
range of 15 to 350 ppb occurred during the tests. The calibra- tion was performed by using two mass flow controllers (with
A and C: Injection section at fresh and total air supply ducts. respectively
B. D and 8: Sampling section at total. return and exhaust air supply ducts, respstively
A n C O r n T E R S Am CONTRCL MODULE DIGITAL I/D B W
'+--
-9
tom*?
SIGN& COND!TIUNERSAIR SAMPLES
+?
AIR PATH --+I SIGNAL PATH AIR AIR
AIR
Figure 3 Schematic of the sampling and data acquisition system.
0
- .
-.
- - -
-
Oh
by pulse method-.--
fl T,,,, by pulse methodby step-down method
-
T,,,, by stepdown method5
10Sampling Interval, min.
Figure 4 Efect of the sampling interval on measured mean ages of aiz
inaccuracy less than 1%) to mix ultra-zero air (i.e., 0 ppb SF6) with 400-ppb SF6 air contained in a stainless steel cyl- inder with an internal volume of 1,059 cc. The 400-ppb SF6 cylinder was prepared in the laboratory by injecting 45 pL, of pure SF6 (99.99%) into the cylinder and pressurizing to 1,547 psig using ultra-zero air. The same 400-ppb SF6 cylin- der was used in the calibrations performed for the present study to eliminate the inaccuracy (within k3%) in the 400- ppb SF6 cylinder itself on the repeatability of the concentra- tion measurements.
EXPERIMENTAL METHODS Pulse Method
In the pulse method, a pulse of SF6 (14
mL)
was injected at a section of the supply air ducts (Figure 2). Two types of injection schemes were tested: (1) at the center of the injection section of the total air supply duct and (2) at the center plus four other locations inside the outdoor air supply duct 25 mm (1 in.) from the duct wall. In the latter, the tracer gas was pumped to a manifold and then distributed to the five locations.The time needed for the tracer gas to travel from the injection locations to the diffusers was less than 0.5 minutes for the flow rate tested. Therefore, the time when the tracer gas was injected was assumed to be the starting time for cal- culating the mean ages of air. The following equations were used to calculate the mean ages of air (Sandberg and Sjoberg
1983):
For local mean age of air,
and for room mean age of air,
tion. The time at which the fan was turned off was used as the starting time for calculating the mean ages of air in the following equations (Sandberg and Sjoberg 1983):
For local mean age of air,
and for room mean age of
air,
-
t e a
( 1
d./
rera
( 0
dt= 0
'rm =
t e e ,
t n d t [ c r a ( t ) d t.
During the measurements, the SF6 concentration was allowed to decay to less than 15 ppb for both pulse and step- down methods. Exponential decay was used to approximate the cut-off tail (i.e., the decay curve below 15 ppb) in calcu- lating the integration in Equations 1 through 4 (NTWS047 1985; NTVVS019 1988).
DEFINITIONS Accuracy
A reference (true) value is needed to quantify the accu- racy of the measured results; this reference value must be determined in a way that is independent of the tracer gas methods. Theoretically, the local mean age of the exhaust air (2,) is equal to the nominal time constant (t,) of the ventila- tion system (Sandberg and Sjoberg 1983), assuming that the air leakage effect is negligible as in the tests conducted in this study. In this study, the accuracy of the measured local mean age of the exhaust air (qea) is defined as
' e a
-
' nqea =
-
t " x looc:cea
( t ) d t-
E?cra
( O d t' r m =
-
(2) which also applies to the returnair
sincez,
= z, for the2 6 t ~ , ( t ) d t 2 f t ~ , ( t ) d t ' studied ventilation system. The nominal time constant (t,) is
since the concentration in the return air duct is the same as that in the exhaust air duct for the present ventilation system. Step-Down Method
In the step-down method, a small amount of SF6 (14
rnL) was injected through a manifold to eight locations within the room (four inside and four outside the work- station, 1.1 m t3.6 ft] above floor), and four small mixing fans were placed on the floor (0.6 m [2 ft] from each wall, centered) to enhance the mixing of the tracer gas with the room air. The mixing fans were turned on before the injec- tion of SF6 and then turned off five minutes after the injec-
equal to the total volume of the air space, including the-test room and the ducts of return and supply air, divided by the flow rate of outdoor air. For the present study, the total vol- ume of the air space was 66.94 m3 and the flow rate of out- door air was 20 Us. Therefore, the nominal time constant
(t,) was 55.8 minutes.
The air spaces in the return and supply air ducts were t
included in the calculation of the nominal time constant because Equations 1 through 4 are valid only when these air spaces are also considered. Previous studies, such as those of s
Sandberg and Sjoberg (1983). Niemela et al. (1989), Sut- c.liffe and Waters (1990), and Breum (1992), did not need to deal with this problem because the ventilation systems they studied did not have recirculation or return air ducts. The air
volume in the supply and return ducts is about 5% of the where i = p, ra, rm, or ea for local, return, room, or exhaust room air volume. The nominal time constant would have air, respectively; and
o
= standard deviation of the mean been underestimated by 5% if the air volume in the duct was ages ofair.
q not included in the calculation. The repeatability (ki) defined by Equation 6 means that
Unfortunately, no reference value is available for the the measured mean ages of air are repeatable within
ki
of the local (zp) and room (2,) mean ages of air. However, it can measured mean age of air at a 95% confidence level (Box et be assumed that the accuracy of the measured local and room al. 1978).mean ages of air (zp and 2,) have the same order of magni-
tude as the accuracy of the measured local mean age of the RESULTS AND DISCUSSION exhaust
air
(z,,) since they are affected by the same system-atic error factors involved in the measurement procedures (e.g., the nonuniform spatial distribution of the tracer gas concentration at the beginning of the concentration decay process associated with the step-down method).
Repeatability
Poor repeatability of the tracer gas methods for measur- ing the local and room mean ages of air is due to random error factors involved in the measurement procedure (e.g., the random fluctuations of the airflow rate and the random error in measuring tracer gas concentrations). The repeat- ability can therefore be estimated statistically by conducting repetitive tests. In this study, the repeatability (ti) is defined as follows:
Eleven sets of tests were conducted and the results are summarized in Table 1. The exhaust air was sampled only for the first five tests since the concentration of the return air was consistent with the exhaust air, as evidenced by the local mean ages of air (Table 1). The room mean ages of air (z,) in Table 1 were therefore calculated based on the tracer gas concentrations measured at the return air duct.
Comparison Between Two Different Injection Strategies in the Pulse Method
For the pulse method, two different injection strategies were tested: (1) the tracer gas was injected only at the center of the total air supply duct right before the air diffusers and (2) the tracer gas was injected at five locations in the outdoor air supply duct to facilitate mixing with the supply air. As shown in Table 2, there is no significant difference between
TABLE 1
Summary of the Measured Mean Ages of Air (min.)
*
Tracer gas was injected at the total air and fresh air supply ducts for test 1 to 6 and 7 to 11, respectively.TABLE 2
Statistical Comparison Between Two Injection Schemes
0, :
Sample Statistics: Number of Obs. Average
Variance
Std. Deviation Median
Hypothesis Test for HO: Diff = 0
vs Alt: NE at Alpha = 0.05 T A ' FA* Pooled r 6 5 11 52.215 49.644 51.0464 32.9342 22.6339 28.3563 5.73883 4.75751 5.32506 53.525 49.48 50.81 Computed t statistic = 0.797336 Sig. Level = 0.445781
so do not reject HO.
Tra :
Sample Statistics: Number of Obs. Average
Variance
Std. Deviation Median
Hypothesis Test for HO: Diff = 0
vs Alt : NE at Alpha = 0.05
TA' FA' Pooled
6 5 11 53.415 53.608 53.5027 59.3952 36.7524 49.3317 7.70683 6.06238 7.02366 52.78 53.15 53 -15 Computed t statistic = -0.0453794 Sig. Level = 0.964796 so do not reject HO. 7,:
Sample Statistics: Number of Obs. Average
Variance
Std. Deviation Median
Hypothesis Test for HO: Diff = 0
vs Alt: NE at Alpha = 0.05
TA' FA* Pooled
6 5 11 52.5767 55.86 54.0691 11.6703 54.5663 30.7352 3.41618 7.3869 5.54393 52.84 55.75 53 Computed t statistic = -0.978051 Sig. Level = 0.353606
so do not reject HO.
*
TA and
FA
represent injections made at the total air and fresh air supply ducts, respectively.
the two injection schemes at the significance level (Alpha) of0.05.
This happened for two reasons: (1) the time required for the air to travel from the outdoor air supply duct to the injec- tion location at the total air supply duct was less than 0.5 minute and (2) the tracer gas was well mixed with the supply air because the injection location at the total air supply duct was more than 40 duct diameters away from the diffusers and the return air was 80% of the total airflow rate in the present test case. Therefore, for ventilation systems similar to the one studied in this paper, single-point injection at the total air supply duct can be used in the pulse method for measuring mean ages of air as long as the injection location is far enough away from the diffusers to ensure good mixing between the tracer gas and the total supply air.
Comparison Between Pulse and Step-Down Methods
As shown in Table 3, the pulse method had better accu- racy but a much poorer repeatability than the step-down
method in measuring both local and room mean ages of air. For example, the pulse method underestimated the local mean age of return air by 4% and its repeatability was ~ 2 4 % . In comparison, the step-down method underestimated the local mean age of air by 17% with a repeatability of kg%.
The underestimation of the mean age of air by the step- down method appeared to be due to the fact that the tracer gas concentrations in the total
air
supply duct and the dif- fuser air jets were lower than at other locations due to con- stant outdoor air supply to the space through the duct and diffusers. Theoretically, the step-down method requires that the tracer gas concentration be uniform within the air space, including return and supply ducts as well as the room itself, at the beginning of the decay. A lower concentration in the supply duct and jets means that at time zero of the decay pro- cess, there is already more outdoor air in the supply duct and C the diffuser air jet region than in the return duct or occupied region. Less time would be needed for the extra amount of outdoor air to reach the occupied region or return duct, resulting in the underestimation of the mean age of air. The underestimation also may be due to possible infiltration ofTABLE 3
Comparison of Mean Ages of Air (min) Between Pulse and StepDown Methods
outdoor air, but this was considered minimal since the test room was kept under neutral pressure conditions (see "Test Room" section).
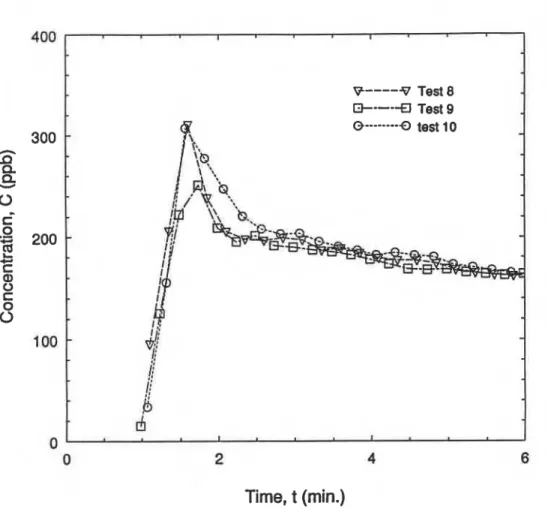
The pulse method had poorer repeatability than the step- down method. This was probably caused by the fact that it was difficult to consistently measure the initial pulse of tracer gas concentration due to the short span of the pulse, as shown in Figure 5.
The overall performance of the tracer gas methods should be evaluated based on both accuracy and repeatabil- ity. Error bands due to the combined effect of the limited accuracy and repeatability can be calculated by simple addi- tions (Figure 6). For example, the error bands for the pulse and step-down methods in measuring the local mean ages of return air were -23% to +18% and -26% to -8%, respec- tively (Figure 6). In fact, the pulse method had a larger error band than the step-down method. This may be one of the rea- sons why the pulse method is not as widely used as the step- down method.
The application of the pulse method is also limited because it assumes that all outdoor air enters the room through the air diffusers. This assumption is not strictly valid, as air infiltratiodexfiltration exists in all buildings. The step-down method can account for the effect of infiltra- tiodexfiltration on the mean ages of air, but it tends to underestimate the mean ages of air because it assumes uni- form spatial distribution of the tracer gas concentration within the ventilated spaces at the beginning of the decay process. As a result, the mean ages of air measured using the stepdown method should only be used as a relative scale for evaluating the performance of ventilation systems. This is because it is practically impossible to assess the effect of the initial incomplete mixing on the measured mean ages of air. One important application of the tracer gas methods is to determine how well the supply air is distributed to various locations in the room. This is achieved by measuring the spa-
,
tial distribution of the local mean ages of air. In this case, it is often convenient to normalize the local mean ages of air using the local mean age of the exhaust or return air, Fisk and Faulkner (1992) have proposed an air diffusion effec- tiveness that is defined as the ratio of the local mean age of return air to the local mean age of air at the breathing level.Pulse Method Stepdown Method
An Example of Using the Test Results Average
Standard Deviation Accuracy
Repeatability
These results may be applied as a reference guide for interpreting measurements of room and local mean ages of air under similar conditions. As an example, data from a pre- vious study were used. Tests were conducted to investigate the effect of diffuser and return layout on the air change effectiveness @haw et al. 1992). The ventilation conditions and test room setup were the same as those in the repetitive tests. A total of seven diffuser and return layouts (Figure 7) were tested and the results are summarized in Table 4.
The difference in the spatial average of the mean age of air between layout 04 and 05 was 6.3 minutes, or 14% of the measured mean age of air, which was greater than the repeat- ability of i13% listed in Table 3. Therefore, it could be con- cluded that the performance of layout 04 was marginally better than that of layout 05 in terms of the room mean age of air. This result was expected because in layout 05 the radial square diffuser was located close to the square return and one side of the diffuser was too close to the wall.
Table 4 also shows that the difference between any other two layouts was less than 13%, which suggested that there were no significant differences between these layouts at a 95% confidence level, based on the results of the repetitive tests. The spatial nonuniformities of the local mean ages of air (which were equal to twice the spatial standard deviation divided by the spatial average) within the room for all the layouts were less than 4%. which was significantly smaller than the repeatability. Therefore, the test results did not sug- gest any significant differences between any two layouts in terms of distributing the supply air uniformly to the various locations within the room.
It should be noted that the repeatability results of this paper apply only to test situations that are similar to the one studied since repeatability of the tracer gas methods can vary significantly with the test conditions. If possible, repetitive tests should be conducted to quantify the repeatability when the tracer gas methods are applied to situations that are sub- stantially different from those of the present study. Present results on accuracy and repeatability can only be used quali- tatively as a reference guide to interpret the measured results under different situations.
I ASHRAE Transactions: Research
51.1 5.0 = -4% *20% 53.6 6.4 -4% 924% 54.1 5.3 5 -4% *19% 43.6 2.2 = -17% *lo% 46.1 2.6 -17% &% 50.8 3.7 = -17% *13%
0
0
2
4Time,
t
(rnin.)
Figure 5 Measured pulses of SFd concentrations.
Figure 6 Comparison of error bands between pulse and step-down methods.
I . . " I ' . " I . ' . . Stepdown method
-
0 Pulse method-
-
1
1
-:
;
I , l . . I I . . . I ~ . . '-
0-
0-
7 C?Ys"*;i
-
9
? . 2 5 n ? y 7 . 6 3 7r - i
I S6 I
$'
[Ll:in.
as
:,.jj2
L,a
/ local and room mean ages of air was -17%; the repeat-
ability of the method ranged from 29% to 213%. 3. The error band due to the combined effects of accuracy
and repeatability varied from -28% to +20% and from
-
26% to -8% for the pulse and step-down tracer gas methods, respectively.
It should be noted that the application of the pulse method in field measurements is often limited not only because it has a larger error band than the stepdown method due to poor repeatability, but also because it cannot account for air infiltration through building envelopes. The step- down method is often preferred in field measurements because it has a better repeatability than the pulse method and it accounts for air infiltration as well as outdoor air from the supply ducts. However, these results indicate, that the stepdown method may underestimate the actual mean ages of air. It is therefore recommended that the mean ages of air measured by the stepdown method be used as a relative scale for evaluating the performance of ventilation systems, since it is difficult (if not impossible) to quantify how much it may underestimate the actual mean ages of air in practice.
Knowing the accuracy and repeatability of the tracer gas
LLL2L38 Llnear Dlf f users methods is important for proper interpretation of measured S4,SS,S61 Square Radlal Dlf f users data. These quantitative results on the accuracy and repeat-
Rl,RZR3,R4,R5,R61 Linear Returns ability of the pulse and stepdown methods may be applied
R71 Square Return as a reference guide for interpreting measurements of room
and local mean ages of air under similar conditions. Repeti-
Figure 7 Schematic of the d i e e r and return layouts. tive tests are recommended if possible when the tracer gas
methods are used for different conditions because the repeat-
SUMMARY AND CONCLUSIONS ability of the tracer gas methods can vary substantially with
the test conditions. The results from the 11 repetitive tests of this study can
be summarized as follows. NOMENCLATURE
Subscripts 1. The accuracy of the pulse tracer gas method in measur-
ing the local and room mean ages of air was -4%; the ea = exhaust air
repeatability of the method ranged from 219% to 224%. i = index; i = ea, ra, o, p, or rm
2. The accuracy of the step-down method in measuring the o = measurement location in the occupied region
TABLE 4
Mean Ages of Air (min.) Measured with the Step-Down Method
Average
-
-
-
-
-
-
-
-Spatial Non- 3.7% 2.2% 2.2% 2.4% 3.1% 2.5% 2.1%
Uniformity*
-
*
defined as twice of the spatial standard deviation divided by the spatial average.p = local location, e.g., ea, ra, or o
ra = return air rm = room air
REFERENCES
Box, G.E.P., W.G. Hunter, and J.S. Hunter. 1978. Statistics
for experimenters-An introduction to design, data analysis, and model building. New York: John Wiley & Sons.
Breum, N.O. 1992. A comparison in measurement of local and room mean age of air. Air Infiltration Review 13(2): 8-9. Old Bracknell, Berkshire, UK: Au Infiltration Cen- tre.
Evans, R.G., and C.Y Shaw. 1988. A multiposition tracer gas sampling system for building air movement studies. Paper No. 5 of the Measurement Techniques Workshop, pp. 73-93. Old Bracknell, Berkshire, UK: Air Infiltra- tion and Ventilation Centre.
Fisk, W.J., and D. Faulkner. 1992. Air exchange effective- ness in office buildings: Measurement techniques and results. In Preprints of International Symposium on Room Air Convection and Ventilation Effectiveness, July 22-24, University of Tokyo.
Niemela, R., A. Saamanen, and H. Koskela. 1989. A com- parison between the step-up, step-down and pulse injec- tion techniques for the measurements of the mean age of air. In Progress and Trends in Air Infiltration and Venti-
lation Research, Proc. 10th AIVC Conference, pp. 11- 44. Old Bracknell, Berkshire, UK: Air Infiltration Cen- tre.
NTVVS047. 1985. Buildings-Ventilation air: Mean age of air. Helsingfors, Finland: NORDTEST.
NTVVS019. 1988. Buildings-Ventilation air: Local mean age. Helsingfors, Finland: NORDTEST.
Sandberg, M., and M. Sjoberg. 1983. The use of moments for assessing air quality in ventilated rooms. Building
Environment 18: 18 1
-
197.Shaw, C.Y., J.S. Zhang, M.N. Said, E Vaculik, and R.J. Magee. 1992. Effect of air diffuser layout on the ventila- tion conditions of a workstation-Part 11: Air change efficiency and ventilation efficiency. ASHRAE Transac-
tions 99(2).
Sutcliffe, H.C., and J.R. Waters. 1990. Errors in the mea- surement of local and room mean age using tracer gas methods. In: Ventilation System Performance, Proc. 1 lth AIVC Conference, vol. 2, pp. 279-292. Old Bracknell, Berkshire, UK: Air Infiltration Centre.