HAL Id: hal-03123422
https://hal.archives-ouvertes.fr/hal-03123422
Preprint submitted on 27 Jan 2021
HAL is a multi-disciplinary open access
archive for the deposit and dissemination of
sci-entific research documents, whether they are
pub-lished or not. The documents may come from
teaching and research institutions in France or
abroad, or from public or private research centers.
L’archive ouverte pluridisciplinaire HAL, est
destinée au dépôt et à la diffusion de documents
scientifiques de niveau recherche, publiés ou non,
émanant des établissements d’enseignement et de
recherche français ou étrangers, des laboratoires
publics ou privés.
To cite this version:
Sergio Sarnataro, Andrea Riba, Nacho Molina. Regulation of transcription reactivation dynamics
exiting mitosis. 2021. �hal-03123422�
Regulation of transcription reactivation dynamics
exiting mitosis
Sergio Sarnataro1, Andrea Riba1, Nacho Molina1,*
1Institut de G´en´etique et de Biologie Mol´eculaire et Cellulaire (IGBMC)
Universit´e de Strasbourg – CNRS – INSERM, 1 rue Laurent Fries, 67404 Illkirch, France
∗Corresponding author: molinan@igbmc.fr
Running title: Regulation of transcription exiting mitosis
Key words: Regulation of transcription; cell identity; cell cycle; mitotic bookmarking; computational biology
Abstract
Proliferating cells experience a global reduction of transcription during mitosis, yet their cell identity is maintained and regulatory information is propagated from mother to daughter cells. Mitotic bookmarking by transcription factors has been proposed as a potential mechanism to ensure the reactivation of transcription at the proper set of genes exiting mitosis. Recently, mitotic transcription and waves of transcription reactivation have been observed in synchronized populations of human hepatoma cells. However, the study did not consider that mitotic-arrested cell populations progressively desynchronize leading to measurements of gene expression on a mixture of cells at different internal cell-cycle times. Moreover, it is not well understood yet what is the precise role of mitotic bookmarking on mitotic transcription as well as on the transcription reactivation waves. Ultimately, the core gene regulatory network driving the precise transcription reactivation dynamics remains to be identified. To address these questions, we developed a mathematical model to correct for the progressive desynchronization of cells and estimate gene expression dynamics with respect to a cell-cycle pseudotime. Furthermore, we used a multiple linear regression model to infer transcription factor activity dynamics. Our analysis allows us to characterize waves of transcription factor activities exiting mitosis and identify a core gene regulatory network responsible of the transcription reactivation dynamics. Moreover, we identified more than 60 transcription factors that are highly active during mitosis and represent new candidates of mitotic bookmarking factors which could represent relevant therapeutic targets to control cell proliferation.
combination of three main processes: 1) nuclear envelope breakdown leading to an increase of the volume 3
that transcription factors (TFs) and the RNA polymerases II (RNAPII) can explore and therefore 4
a decrease of their local concentration around gene promoters; 2) major reorganization of chromatin 5
architecture characterized by chromosome condensation, repositioning of nucleosomes in some regulatory 6
regions, loss of long-range interaction between enhancers and promoters and disassembling of topological 7
associated domains (TADs); and, 3) TF-DNA binding inactivation through postranscriptionally regulated 8
phosphorylation. As a consequence, most TFs and the RNAPII are evicted from mitotic chromosomes 9
and RNA synthesis is drastically reduced [1]. 10
In spite of this global decrease of gene expression during mitosis, proliferating cells are able to maintain 11
their cell identity and propagate regulatory transcriptional programs from mother to daughter cells [2]. 12
Mitotic bookmarking has been proposed as a potential mechanism that could be involved in the transmission 13
of regulatory information during the cell-cycle [3]. Indeed, a significant fraction of TFs are able to remain 14
bound to chromatin during mitosis [4]. These mitotic-bound factors (MFs) show faster interactions with 15
mitotic chromatin than in interphase as reduced residence times have been reported. It is believed that 16
non-specific chromatin or protein-protein interactions between MFs and chromosome coating proteins 17
can explain this fast observed dynamics [4, 5]. However, it has been shown for a handful of MFs, known 18
as bookmarking factors (BFs) [6–9], their ability to interact specifically with at least a fraction of their 19
interphase target sites during mitosis, indicating that chromosomes are not as compacted as previously 20
thought [9]. In fact, chromatin accessibility and nucleosomes landscape during mitosis remain unchanged 21
on bookmarked regions bound by known BFs [11, 12]. This ability of BFs to maintain chromatin structure 22
locally could promote a quick transcription reactivation exiting mitosis. 23
Transcription dynamics during mitosis and early G1 phase has recently been measured by metabolic 24
labeling of RNA (EU-RNA-Seq) in synchronized population of Human Hepatoma cells HUH7 [10]. 25
Remarkably, this study showed a low but detectable transcription activity during mitosis in up to 8000 26
genes. Furthermore, transcription reactivation occurred in intense waves exiting mitosis and early G1 27
phase. However, the study did not take into account that mitotic-arrested cell populations progressively 28
desynchronized once the block was released. As a consequence, RNA measurements are performed on 29
mixture of cells at different internal cell-cycle times. Moreover, it is not understood yet what is the precise 30
role of mitotic bookmarking on mitotic transcription and the transcription reactivation waves. Ultimately, 31
the core gene regulatory network driving the precise transcription reactivation dynamics remains to be 32
identified. 33
In this paper we developed mathematical models and computational methods to address these open 34
that there is a stochastic lag time until a cell can restart the cell-cycle progression again. We characterized 36
the distribution of lag times by analyzing how the observed fraction of mitotic cells evolves over time 37
after the mitotic block is released. This allows us to deconvolve the EU-RNA-Seq data and produce gene 38
expression profiles with respect to a cell-cycle pseudotime and classify the different waves of transcription 39
reactivation in relationship with the cell-cycle progression instead of the experimental time. Moreover, we 40
identified the key TFs determining the transcription reactivation dynamics. To do that, we developed an 41
ISMARA-like model [13] assuming that the expression of genes at a given time point of the cell-cycle 42
progression is a linear combination of the activities of all the TFs that can bind on their promoters. By 43
knowing the deconvolved gene expression and integrating data on transcription factors motif affinities, we 44
calculated the activity of every expressed TF and its role in transcription reactivation exiting mitosis. 45
Indeed, this analysis allows us to divide TFs in groups according to their peak of activity with respect 46
to the cell-cycle pseudotime and identify a core regulatory network of TFs responsible of the observed 47
transcription waves. Interestingly, we do not see a strong correlation between known BFs as FOXA1 and 48
the speed at which their target genes are reactivated. However, we identified around 60 TFs that are 49
highly active during mitosis and represent new candidates of mitotic bookmarking factors. 50
Results
51Deconvolution of gene expression data from desynchronized cell populations
52In 2017, Palozola et al. published a study based on metabolic labeling of RNA (EU-RNA-Seq) of 53
prometaphase synchronized population of Human Hepatoma cells (HUH7) by arresting cell-cycle progression 54
[10] with nocodazole. EU-RNA-Seq experiments were performed to measure newly synthesized transcripts 55
at 0 minutes, 40 minutes, 80 minutes, 105 minutes, 165 minutes and 300 minutes after mitotic block 56
release as well as for an asynchronous cell population. In this study, the authors highlighted the presence 57
of low levels of transcription during mitosis and the fact that housekeeping genes and not cell-specific genes 58
are activated earlier during the mitotic exit. We reanalyzed the EU-RNA-Seq datasets and characterized 59
the expression dynamics at the gene level. By performing k-means clustering on the gene expression 60
profiles, we identified 5 different clusters, presenting diverse transcription reactivation dynamics over the 61
experimental time. Similarly as the authors reported one of these group showed a peak in the expression 62
at 40 minutes, while others showed a later transcription reactivation (see Fig. 1, panel A). 63
Notably, the study did not consider that mitotic-arrested cell populations progressively desynchronize 64
after washing out nocodazole and therefore the reported measurements are performed on mixture of cells at 65
different internal cell-cycle times. In addition, at every experimental time point there is contamination from 66
cells that escape mitotic block. We developed a mathematical model to correct for the desynchronization 67
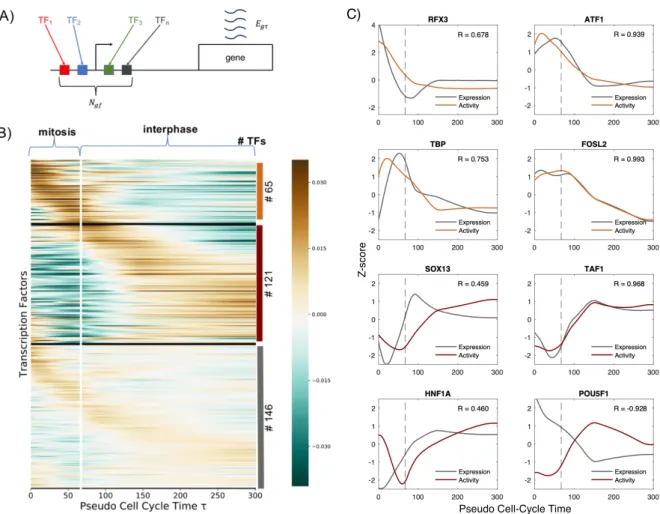
Fig 1: Deconvolution of gene expression data of synchronized cell population leads to dynamic expression profile respect to cell-cycle average profile. A: Genes can be divided in groups according to their dynamic expression profiles over time. Each row corresponds to a gene. Black horizontal lines divide the different clusters of genes. The color scale represents the level of the Z-score of expression of each gene, as shown by the colorbar on the left. On the right, the number of genes for each cluster is indicated as well as the color corresponding to the cluster expression average shown on the bottom panel. B: We assume that cells have to wait a stochastic, log-normally distributed lag time to start again the cell-cycle progression after the release of the chemical cell-cycle arrest by nocodazole. Here, a pictorial representation of lag time distribution, where the green part of area represents the fraction of cells that already exited mitosis at two different experimental time points. The dashed line indicates the time τmit that cells need to complete mitosis. C: Blue dots: quantification by imaging of cells showing condensed (mitotic) and decondensed (non-mitotic) chromatin after mitotic block release (data from [10]); Orange line: model fitting used to infer τmit and the parameters of the log-normal distribution, σ and µ. D: After the deconvolution, genes were divided in groups according the their dynamic expression profile over the cell-cycle pseudotime τ . The vertical white line represents τmit and indicates the transition between mitosis to interphase in early G1 phase. The color scale represents the level of the Z-score of expression of each gene, as shown by the colorbar on the right. On the right, the number of genes for every cluster is indicated as well as the color corresponding to the cluster expression average shown on the bottom to one of the curves on the bottom.
there is a stochastic lag time until cells can start again the cell-cycle progression that is log-normal 69
distributed with a certain mean µ and standard deviation σ. We introduced the concept of internal 70
cell-cycle pseudotime τ , defined as the effective cell-cycle time progression of a cell, starting once the lag 71
time is over. We then assumed that there is an average time τmit that cells need to complete mitosis. 72
Finally, we fitted the parameters of the model τmit, µ and σ using data from cell imaging reporting how 73
the fraction of observed mitotic cells evolves over time after the mitotic block is released [10]. This led to 74
Fig. 1, panel B and C and Methods for a detailed mathematical derivation). 76
By applying our model, we deconvolved the time-dependent EU-RNA-Seq data and mapped them onto 77
the internal cell-cycle pseudotime τ (see supplementary Table 1). As a result we obtained gene expression 78
dynamics with respect to the cell-cycle progression, allowing us to highlight the transition between mitosis 79
and early G1 phase. Again, we identified 5 different clusters of genes showing distinct transcription 80
reactivation dynamics over the cell-cycle pseudotime τ . Strikingly, around 2000 genes showed an expression 81
wave very early during mitosis, presumably around metaphase, while a large fraction of genes reach their 82
reactivation peak just before exiting mitosis, during telophase or during the transition to early G1 phase, 83
as shown in Fig. 1, panel D. In summary, our analysis allows us to correct for desynchronization of cell 84
populations and study gene expression dynamics with respect to the cell-cycle pseudotime highlighting 85
the waves of transcription in relationship with the transition between mitosis and interphase. 86
Transcription factor activity dynamics during mitosis and early G1 phase
87The transcription waves identified in the previous section are driven by regulatory transcriptional programs 88
mainly activated by transcription factors (TFs). To understand which ones among all TFs are in fact the 89
principal drivers of the transcription reactivation dynamics, we developed an ISMARA-like approach [13]. 90
Thus, we assumed that the normalized log-transformed expression egτ of a gene g at cell-cycle pseudotime 91
τ can be obtained as a linear combination of the cell-cycle dependent activities Af τ of all TFs f that can 92
potentially regulate the gene. The model can be summarized by the following equation: 93
egτ =
X
f
NgfAf τ (1)
where the values Ngf represent the entries of a matrix N containing the number of binding sites for the TF 94
f associated with promoter of the gene g, taking into account the affinity between the motif of f and the 95
sequence of the gene promoter [14]. From the analysis, we excluded TFs associated to unexpressed genes. 96
Furthermore, to avoid overfitting we introduced a regularization term that enforces smooth TF activities 97
over the cell-cycle time and we calibrated using a cross-validation approach. For further mathematical 98
details we refer to Methods. 99
Our analysis allows us to infer the activity of 332 TFs (see supplementary Table 2). This can be 100
understood as a dimensionality reduction approach as we describe the problem of transcription reactivation 101
with much fewer parameters, since we pass from the analysis of thousands of genes to only hundreds 102
of TFs (see Fig. 2, panel A). To analyze the activity dynamics we use k-means and divide them in 3 103
clusters, according to their profile over τ . We showed that almost 19% of TFs present positive activity 104
during mitosis, with a peak in the first minutes, and then progressive decrease of activity. Conversely, 105
Pseudo Cell-Cycle Time
Z
-sco
re
Fig 2: Transcription factor activity dynamics during mitosis and early G1 phase. A: Schematic representation of the model: the expression egτ of the gene g at cell-cycle pseudotime τ is a linear combination of the activities of different transcription factors f binding the promoter of g. Ngf represents the entries of a matrix N containing the number of sites for TF f associated with promoter of the gene g, taking into account the affinity between the motif of f and the sequence of the promoter. B: TFs can be divided in groups according to their activity dynamics over the cell-cycle pseudotime τ . The vertical white line represents τmit, and indicates the transition between mitosis and interphase. On the right, the number of TFs belonging to each cluster is indicated. C: Activities of mitotic-active (orange curves) and early-G1-active (red curves) TFs that show a high amplitude dynamics. Grey lines show the gene expression dynamics of the corresponding TF genes. Pearson correlation coefficients between the TF activites and expressions are shown in each panel. Dashed lines represent τmit.
remaining 45% of TFs show a moderate amplitude in their dynamics suggesting that they play a minor 107
role on transcription reactivation dynamics (the results are shown in Fig. 2, panel B). Among TFs that 108
are active during mitosis, we obtain known bookmarking factors as C/EBP, HSF1, TBP, GATA1 and 109
ESRRβ [3, 10, 15–17] reassuring that our approach is able to identify relevant TFs. Indeed, activates of 110
TFs that are annotated to the Gene Ontology category cell-cycle show an intense dynamics during mitosis 111
and early G1 phase (see Fig. S3). Interestingly, by sorting TFs according to when their highest peak of 112
activity occurs, we observed waves of activity suggesting an intrinsic TF hierarchy with respect to their 113
role on the temporal reactivation of transcription after mitosis (see Fig. 2 panel B). 114
Determining the molecular mechanisms underlying the TF activity dynamics that we inferred goes 115
beyond the scope of this study. However, we can have a first clue by analyzing the correlation between the 116
changes in transcription may be responsible for changes in activity. On the contrary, low correlations may 118
suggest that postrasncriptional regulation is required to explain the TF activity dynamics. In Fig. 2 panel 119
C, we show activities of mitotic- and early-G1-active TFs with a high amplitude dynamics together with 120
their expression profiles. Interestingly, TBP, TAF1 and FOSL2 show a high positive correlation indicating 121
that their activities may be regulated at the transcriptional level. On the other hand, SOX13 and HNF1A 122
show a clear delay between expression and activity which could reflect the delay on the accumulation of 123
active protein due to mRNA and protein half-lives or postranscriptional regulation. Strikingly, POU5F1 124
shows a strong negative correlation which suggests that may act mainly as a repressor. In summary, 125
our analysis not only allows us to identify the activity dynamics of key TFs involved in transcription 126
reactivation but also provides preliminary hints on the molecular mechanisms that may be involved in 127
such dynamics. 128
Bookmarking and transcription reactivation kinetic
129Next, we investigated the role of mitotic bookmarking in the transcription reactivation dynamics. To do 130
that, we analyzed the expression of genes associated to FOXA1, a liver-specific factor and one of the first 131
identified bookmarking factors. We used mitotic ChIP-Seq data from a study of Caravaca et al. [6]. We 132
selected the genes associated to FOXA1 ChIP-Seq peaks (see Methods) and we calculated the average 133
expression of these genes and compared it with the overall average gene expression. Surprisingly, genes 134
associated to FOXA1 reach their activation peak later than the overall peak of gene expression that occurs 135
during the transition between mitosis and early G1 phase (see Fig. 3, panel A). Then, we compared the 136
activity of FOXA1 with the average activity of all TFs, revealing a negative peak during mitosis (see 137
Fig. 3, panel B), in accordance with the results shown in Fig. 3, panel A. These results suggest that 138
FOXA1, despite its presence on mitotic chromosomes through specific and non-specific interactions, is 139
not sufficient to promote quick transcription reactivation. However it may play a structural function by 140
keeping the chromatin open to promote binding of other TFs. 141
To scale up this analysis we took advantage of a recent large scale study by Raccaud et al. in 2019. 142
The authors were able to systematically measure the mitotic chromosome binding of 501 TFs in mouse 143
fibroblast cells by live-imaging cell lines carrying exogenous florescence constructs. The mitotic bound 144
fraction (MBF) was defined as the fraction of fluorescence signal located on mitotic chromosomes over the 145
total cell signal. According to this score the TFs were divided in three categories (enriched, intermediate 146
and depleted) indicating their capacity to bind mitotic chromosomes and their potential to be bookmarking 147
factors. We then assumed that human TFs in HUH7 cells behave similar as their mouse paralogs and 148
assigned the corresponding MBF score. We hypothesized that genes regulated by TFs with high MBF 149
should be ready to be reactivated earlier. To test this, we calculated a MBF weighted average score 150
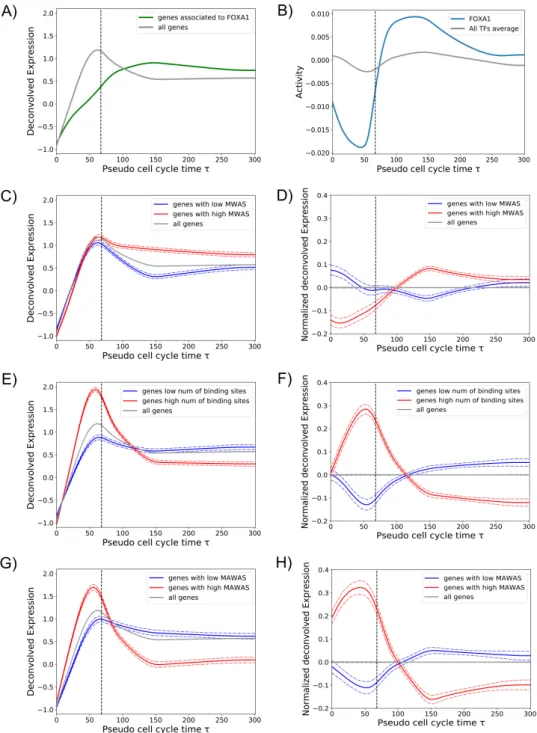
Fig 3: Bookmarking and transcription reactivation dynamics. A: The average expression of all genes (grey line) was compared with the average expression of FOXA1 target genes during mitosis (green line). B: The activity of FOXA1 (blue line) in comparison with the average activity of all TFs (grey line). C: Gene expression pattern as a function of the promoter MWAS (MBF weighted average score). The average expression of all genes (grey line) was compared to the average expression of genes whose promoters tend to be regulated by TFs with high MBF (red line) and low MBF (blue line) (see Methods). D: The same as in panel C, but gene expression patterns are shown normalized by the overall average expression (grey line). E: Gene expression pattern as a function of the total number of TF binding sites in the promoter. The average expression of genes with large (red) and low (blue) number of promoter binding sites are compared to the overall averege expression (grey line). F: The same as in panel E, but gene expression patterns are shown normalized by the overall average expression (grey line). G: Gene expression pattern as a function of the promoter MAWAS (mitotic activity weighted average score, xdd Methods). The average expression of genes with high (red) and low (blue) MAWAS are compared to the overall averege expression (grey line). H: The same as in panel G, but gene expression patterns are shown normalized by the overall average expression (grey line). Dashed vertical lines in all panels indicate τmit.
weighted by the number of their binding sites. Then, we divided genes in high and low MWAS and 152
we calculated the average expression of these two groups (see Methods for further information). Genes 153
associated to high MWAS, i.e gene that tend to be regulated by TFs with high MBF, did not show a 154
faster reactivation dynamics but a significant larger expression during early G1 phase (see Fig. 3, panel C 155
and D). Consistently, we showed no significant difference between the MBF distribution of TFs with high 156
activity during mitosis or during early G1 (supplementary fig. Fig. S4). These results indicate that there 157
is an absence of correlation between TF mitotic binding and TF mitotic activity and quick transcription 158
reactivation of their target genes. We cannot rule out that the absence of correlation could be due to the 159
fact that MBF scores were measured with an artificial system in a different cell line of a different organism. 160
However, the absence of correlation may suggests that that previously reported mitotic bound factors, as 161
in the case of FOXA1, may have a structural function by keeping chromatin open during mitosis and the 162
speed of transcription reactivation may be then regulated by other determinants. 163
Next, we studied whether promoter architecture could be one of the determinants of early transcription 164
reactivation. Surprisingly, just the total number of binding sites within the gene promoter is a strong 165
feature to predict early or late reactivation. Indeed, average expression of genes with large number of 166
binding sites shows a quick transcription reactivation during mitosis, in contrast to a reactivation during 167
early G1 of genes with small number of binding sites (see Fig. 3, panel E and F). Two non-exclusive 168
mechanisms could explain why strong promoters reactivate earlier: first, gene promoters with more 169
TF binding sites may be easier to kept accessible during mitosis as more TFs could compete against 170
nucleosomes leading to nucleosome free regions. Second, large number of binding sites may facilitates that 171
TFs find the promoters and thus increase the chance to recruit the transcriptional machinery. Finally, as 172
expected, genes that have a large number of binding sites for TFs with a high inferred activity during 173
mitosis (high mitotic activity weighted average score, MAWAS), showed a high mitotic transcription and 174
a quick transcription reactivation (see Fig. 3, panel G and H, and supplementary table 3). Therefore, we 175
believe that our method allows to identify new bookmarking factors that should not only bind mitotic 176
chromosomes but be able to bind specific DNA binding sites during mitosis. In addition, we predict that 177
promoters with large number of binding sites for these TFs should show a higher degree of chromatin 178
accessibility during mitosis. 179
Identification of the Core Regulatory Network responsible for the transcription
180reactivation after mitotic exit
181Next, we wanted to identify the TFs, among the 332 for which we are able to infer activities, that have a 182
major role on the reactivation of transcription exiting mitosis. Namely, the key TFs that if perturbed 183
may affect more significantly the measured gene expression patterns. To do so, we calculated the fraction 184
Pseudo cell-cycle time TF a ct iv ity 0 100 200 300 -0.1 -0.05 NRF1 CEBPZ 0 100 200 300 -0.1 -0.05 TAF1 KLF4 0 100 200 300 -0.1 -0.05 0 0.05 SP4 ATF1 0 100 200 300 -0.1 -0.05 0 0.05 WT1 ELF1 0 100 200 300 -0.1 -0.05 0 0.05 ELK4 ELF2 0 100 200 300 -0.1 -0.05 0 0.05 SP3 FOXM1 0 100 200 300 -0.1 -0.05 0 0.05 SIN3A KLF16 0 100 200 300 -0.1 -0.05 0 0.05 SP1 SOX13
Fig 4: Identification of the Core Regulatory Network responsible for the transcription reactivation after mitotic exit. Inferred core regulatory network (CRN) by selecting the top 5% of the TFs according to their importance in explaining the gene expression patterns and their inferred time-dependent activities. Colours indicate the cluster to which TFs belong, in accordance with the in Fig. 2, panel B. Note that the majority of TF motifs are associated uniquely to single TF, while some other motifs are shared by more than one TF, precluding the inference of single TF activities of motifs which can be potentially bound by more than one TFs.
TF importance score as the reduction on fraction of explained variance when the TFs is removed as an 186
explanatory variable from the multiple linear regression model (see Methods for further details). A list of 187
all TFs sorted according to their importance score is given in the supplementary table 4. 188
Furthermore, in Fig. 4 we show a Core Regulatory Network (CRN) where the nodes are formed by the 189
5% top most important TFs and the links represent potential regulatory interaction between the selected 190
TFs according to the presence of TF binding sites in their promoters. Interestingly, the CRN shows a 191
large number of regulatory links (149 connections) while random networks with the same number of TFs 192
produce a smaller number of connections (36 on average). Thus, the high interconnectiviy of our CRN 193
suggests that the identified TFs may be related functionally. Indeed, some of them have been reported 194
to be involved in cell-cycle or cell proliferation and growth as ATF1, FOS, CEBPZ, SP3 and KLF4 [18]. 195
Moreover, the CRN structure shows multiple feedback loops rather than a hierarchical network as one 196
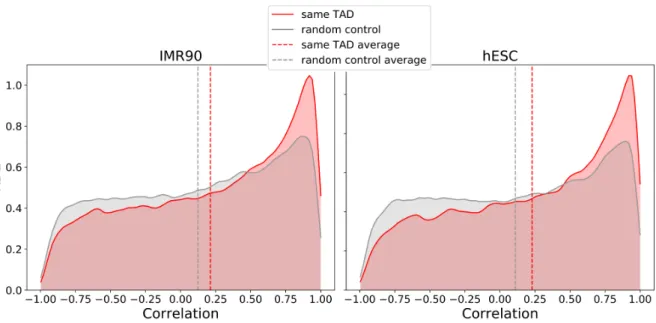
Fig 5: Genes belonging to the same TADs show an higher correlation in expression. Correlations between gene expressions for genes belonging to the same TAD were calculated, for two different TADs sets (IMR90, hESC cells). In red, the KDE of the distribution of the correlation is plotted, in comparison with a random model (grey plot). Dashed vertical lines represent the average values of the corresponding distributions.
structure has the potential to show cycling dynamics which may be important not only for the reactivation 198
after mitosis but for the regulation of transcription across the whole cell-cycle. In conclusion, we predict 199
that these TFs could represent relevant therapeutic targets to control cell proliferation. 200
Genes within in the same TAD show similar reactivation dynamics
201The connection between transcription and the 3D structure of chromatin is currently a very active field of 202
research. During mitosis, topologically associated domains (TADs) are disrupted and rebuilt at different 203
dynamics during the transition between mitosis and G1 phase [20].However, the causal connection between 204
transcription reactivation and chromatin structure reformation exiting mitosis is not known yet. As a first 205
attempt to investigate this relationship, we analyzed the correlation between transcription reactivation 206
profiles of genes belonging to the same TAD. To do that, we took two TAD lists identified in human IMR90 207
and ES cells, from Hi-C experiments [21]. Although these are different cells lines than the HUH7, it has 208
been shown that TADs are highly conserved between different cell-types and even different organisms [21]. 209
We obtained a total of 2290 and 3061 TADs respectively. For each TAD in both lists, we identified the 210
expressed genes that are located within its limits, finding respectively 10225 and 9849 genes. Pearson 211
correlation coefficients were calculated between all pairs of genes within the same TAD. As a control, 212
expressed genes were randomly located into TADs respecting the total number of genes in each TAD. 213
Distribution of correlation coefficients as well as distribution of random coefficients are shown in Fig. 5. 214
Interestingly, genes belonging to the same TAD show a higher correlation than random pair of genes, 215
exiting mitosis. Further experimental work would be required to validate our hypothesis.
Discussion
220Cell identity maintenance in proliferating cells is a biological process that has crucial implications in 221
developmental biology, regenerating medicine and cancer. Nevertheless, the precise molecular mechanisms 222
responsible for the transmission of regulatory information from mother to daughter cells are not fully 223
understood yet. Mitotic bookmarking by TFs through specific DNA binding on mitotic chromosomes has 224
been proposed as a mechanism to reinforce cell identity maintenance during cell division. In this paper 225
we studied the regulation of transcription reactivation exiting mitosis and the connection with mitotic 226
bookmarking. 227
First, we reanalyzed time-dependent EU-RNA-Seq data on synchronized cell populations by a mitotic 228
arrest, to correct for the progressive desynchronization of cells after block release. This allowed us 229
to estimate gene expression profiles with respect to a cell cycle pseudotime with an explicitly defined 230
transition between mitosis and early G1 phase. Remarkably, we identified a set of genes that show a very 231
early wave of transcription reactivation during mitosis. However, the majority of genes showed a peak of 232
transcription at telophase or during the transition between mitosis and G1. 233
Next, we estimated TF activity dynamics of 332 expressed TFs by fitting a multiple linear model to the 234
deconvolved gene expression profiles. We observed time-dependent waves of TF activities suggesting an 235
intrinsic TF hierarchy with respect to their role on transcription reactivation after mitosis. In addition, 236
we investigated whether TFs previously reported to bind mitotic chromosomes were responsible for a 237
faster reactivation dynamics. Surprisingly, we did not find a strong correlation between genes regulated 238
by mitotic bound TFs and the speed of reactivation. However, our approach allowed us to identify 239
around 60 TFs that are highly active during mitosis and represent new candidates of mitotic bookmarking 240
factors. Therefore, we predict that the interactions of these factors with their specific target sites during 241
mitosis are the molecular mechanisms responsible for mitotic transcription and transcription reactivation. 242
Moreover, we hypothesize that these specific interactions may also play an important role maintaining 243
chromatin accessibility on mitotic chromosomes. Further experimental work would be needed to validate 244
our hypothesis and predictions. 245
Moreover, we reconstructed a core regulatory network underlying the dynamics of transcription reactiva- 246
tion exiting mitosis, by selecting the key TFs that showed the highest explanatory power in our multiple 247
linear regression model. Then, we propose a list of candidates to be the crucial players in the process 248
predict that these TFs could represent relevant therapeutic targets to control cell proliferation. Further 250
experiments are required to validate our predictions and prove the active role of TFs on chromatin 251
accessibility and 3D structure. 252
Methods
253Fitting of model parameters for deconvolution of gene expression data
254To estimate gene expression dynamics with respect to an internal cell-cycle pseudotime, we assumed 255
that after the release of the synchronization there is a stochastic lag time until cells can start again the 256
cell-cycle progression. According to our model, the cell-cycle progression of a cell is represented by the 257
internal cell-cycle pseudotime τ = t − η , where t is the experimental time and η is the stochastic lag 258
time that the cell had to wait until the cell-cycle progression was restarted again. We further assumed 259
that the lag time η is log-normally distributed with a certain mean µ and standard deviation σ. Then, 260
the probability of finding a cell in the population with an internal cell-cycle pseudotime τ at a given 261
experimental time t can be written as: 262
P (τ |t)dτ =√ 1 2πσ2(τ − t)e
−(log(t−τ )−µ)2
2σ2 dτ (2)
Assuming that cells require an average time τmitto complete mitosis we can calculate the fraction of cells 263
waiting for mitosis to be finished as q(t) =Rτmit
0 P (τ |t)dτ and solving the integral we obtain: 264
q(t) = 1 2− 1 2erf( log (t−τ√mit)−µ 2σ ) t > τ 1 t ≤ τ (3)
Then, we fit the parameters of the stochastic model (τmit, µ and σ) by using data from [10] on the time 265
evolution of the number of mitotic cells observed after synchronization treatment release. To do so, we 266
define the likelihood of the data based on the assumption that the cell counts follow a binomial distribution 267
with probability q(t). Thus, 268
L =Y i q(ti)n mit i (1 − q(ti))n tot i −n mit i (4)
where nitotand nimitare, respectively, the total number of cells and the number of cells in mitosis counted at 269
experimental time t0= 0 minutes, t1= 40 minutes, t2= 80 minutes, t3= 105 minutes, t4= 165 minutes 270
and t5= 300 minutes. Then, the log likelihood can be written as: 271
logL =X i nmiti log (q(ti)) + X i (ntoti − nmit i ) log (1 − q(ti)) (5)
have been inferred, the probability P (τ |t) is fully determined and, therefore, we can recover the gene expression with respect to the internal cell-cycle pseudotime τ using the following convolution equation: 275
rg(t) =
Z t
0
Eg(τ )P (τ |t)dτ (6)
where rg(t) represents the expression of the gene g at experimental time t (given by the EU-RNA-Seq
data), Eg(τ ) is the expression of the same gene g at the cell-cycle pseudotime τ . This equation basically
reflects that the gene expression measured at a certain experimental time is the population average over the expressions of cells at different cell-cycle times. In case of perfect synchronization over time, the probability P (τ |t) would become a Dirac delta function and the gene expression in both times would be the same. Furthermore, we took into account the fact that the samples were contaminated by a fraction πM = 0.23 of cells that never exited mitosis and a fraction πI = 0.075 of cells that did not
response to the mitotic block and stayed in interphase (see Fig. 1, panel C). It means that only a fraction πC= 1 − πM− πI starts again the cell cycle progression within the duration of the experiment. Then, this
can be summarized by describing the measured gene expression as a mixture of the three cell populations as follows: rg(t) = πC Z t 0 Eg(τ )P (τ |t)dτ + πMEg(0) + πIEgI (7) rga= fmit Z τmit 0 Eg(τ )dτ /τmit+ fIEgI (8) where, EI
g is the average expression during interphase and an extra equation is included to relate the gene 276
expression ra
g measured on an asynchronous cell population as a weighted average of the gene expression 277
during mitosis and during interphase where the weights reflect the fraction of the cell-cycle duration TC 278
that cells expend on average in each phase, i.e fmit= τmit/TC and fI = 1 − fmit. 279
Then, to perform the deconvolution we discretized the cell-cycle pseudotime into small intervals (δτ = 1 280
min) and expressed the Eq. 7 and 8 into matricial from: rg = M Eg, where the expression vectors are 281
defined as rg= (rg(0), rg(t0), rg(t1), . . . , rga) and Eg= (Eg(0), Eg(δτ ), Eg(2δτ ), . . . , EgI) and the matrix M 282
is the sum of three components: M = MC+ MM+ MI that account for the three distinct cell populations. 283
Eq. 6, and can be written as: 285 MC= πCP 0 0 · · · 0 0 0 · · · 0 0 (9)
where P is the discrete version of Eq. 3. Second, the mitotic matrix MM adds to the model the contribution 286
of the cells that are still in mitosis by mapping them into τ = 0. Its explicit form is: 287
MM = πM 1 0 · · · 0 · · · 0 1 0 · · · 0 · · · 0 · · · · 1 0 · · · 0 · · · 0 0 0 · · · 0 0 0 0 · · · 0 0 (10)
And third, the interphase matrix MI exploits the asynchronous dataset to infer the average expression 288
levels during interphase. The matrix takes the following form: 289
MI = 0 0 · · · 0 · · · 0 0 0 · · · 0 · · · 0 · · · · 0 0 · · · 0 · · · 0 πI πI · · · πI 1 TC 1 TC · · · · fI (11)
where the cell cycle duration TC is set to 24h [22]. 290
Hence, the deconvolution problem can be understood as a multiple linear regression and, therefore, 291
we can infer the gene expression in the space of the cell-cycle pseduotime by optimizing the following 292
quadratic loss function: 293
LSM = X g | rg− M Eg|2+λ X gi | Eg,τ +1− Eg,τ |2 (12)
where we added a smooth Ridge regularization term to be able to solve the overrepresented linear model 294
and avoid overfitting. Then, the solution is E∗g = (Q + λI)−1MTrg, where Q = MTM and I is the 295
regularization matrix. 296
299
BIC = NE· χ2+ 2NG· D · log(NE) (14)
where NEis the number of experimental time points, NGthe total number of genes, χ2=Pg | rg−M E∗g|2 300
is the minimum error and D is the degree of freedoms that, for a multiple linear regression model with 301
smooth Ridge regularitation, can be calculated as D = Tr(M ((Q + λI)−1MT). The BIC score tents to
302
introduce a stronger penalty producing a solution more robust against overfitting therefore we chose 303
λ = 0.79 that minimizes the BIC score (see Fig. S1). 304
Visualization of the gene expression through heatmaps
305To represent the gene expression as shown in Fig. 1 panel A, processed EU-RNA-Seq data at the transcript 306
level from [10] were used. Transcript FPKMs from the same gene were then grouped to obtain gene level 307
EU-RNA-Seq data, and all the genes with a low expression on the asynchronous sample (< 36 FPKM) 308
were excluded (see Fig. S1, panel A). Then, a Z-score was calculated, correcting each FPKM value by 309
subtracting the mean µg and dividing by the standard deviation σg, both µg and σg calculated over the 310
corresponding gene. Genes were divided into 5 clusters (the optimum number to obtain significantly 311
different profiles) according to their Z-score over time, by using the KMeans tool from sklearn python 312
library. The heatmap was represented by using seaborn python library, ordering the genes of each cluster 313
according to their norm with respect to the corresponding cluster average expression. 314
Inference of transcription factor activities
315We developed an ISMARA-like model [13] where the expression of a given gene with respect to the 316
cell-cycle pseudotime can be obtained as a linear combination of time-dependent activities of all TFs that 317
can potentially bind its promoter. First, a as proposed in [13], we preprocessed our data as follows: first, 318
to revert the z-score transformation performed above we multiplied the gene expression values Egα by the 319
standard deviation σg and added the average µg. Second, in order to calculate the log2 expression for all 320
genes, we add a pseudo-count to the corrected Egτ values, i.e. for every given time τ , we ranked all the 321
values higher than zero and we calculated the 5th percentile pcτ. We then added pcτ to the corresponding 322
Egτ. After that, we calculated ˆegτ, i.e. normalized values of the gene expression at a cell-cycle pseudotime 323
τ , as follows: 324 ˆ egτ = log2 " 106·PEgτ g0Eg0τ # (15)
we further normalized the expression of genes across pseudotime and genes resulting in egτ = ˆegτ− hˆegi − 325
hˆeτi + hhˆeii. Finally, we write the linear model as: 326
egτ =
X
f
NgfAf τ (16)
where the value Ngf represents the number of binding sites for the TF f on the gene promoter g, taking 327
into account the affinity between the motif of f and the sequence of the promoter; and, the unknown 328
parameter Af τ is the activity of the TF f at a given cell-cycle pseudotime τ . The binding site matrix is 329
further normalized to ensureP
gNgf = 0. Note that the TF activities are then zero mean variables. 330
Then we used least square fitting to obtain the TF activites. To avoid overfitting we included a Ridge 331
regularization penalty. To estimate the weight of the regularization we calculated the Mean Square Error 332
(MSE) for a training and a test datasets and we performed a 80-20 cross-validation. A regularization 333
factor λ = 443 was chosen, corresponding to the minimum of the MSE of the test dataset (see Fig. S2). 334
In addition, we calculated the explained variance (EV) of the model, EV = (egτ−ethgτ)2
(egτ−µg)2, where e
th
gτ is the 335
theoretical expression of the gene g at internal cell cycle time τ , i.e. calculated using the inferred activity 336
Af τ and the matrix Ngf, and µg is the mean among all the values egτ. We obtained a regularization 337
factor λ = 443, corresponding to the maximum of the EV of the test dataset Fig. S2, in accordance with 338
the minimum obtained for the MSE. 339
Visualization of the TFs activities through heatmaps
340To represent the TFs activities as shown in Fig.2, the TFs were divided into 3 clusters according to 341
their activity dynamics over τ . First, we calculated the standard deviation over time of TF activities 342
as σf =
q P
τA2f τ and classify a TF as high amplitude dynamic if σf > 0.07. Second, we sorted TFs 343
according to when their maximum activity peak occurred and defined a TF as mitotic active if the 344
peak appeared before τmit. Therefore, TFs were classified as either mitotic active, early-G1 active or 345
non-dynamic. The heatmap in Fig.2 was represented by using seaborn python library, ordering the TFs 346
in each cluster by the the first reached maximum over τ . To represent the TFs activity as shown in 347
Fig. S3 only TFs corresponding to genes belonging to the Gene Ontology (GO) category (Cell Cycle - 348
GO:0007049) were considered. 349
Core Regulatory Network
350To build the core regulatory network (CRN) we selected the TFs that showed a high degree of explanatory 351
power to reproduce the gene expression dynamics. To do that, we assigned a score for each TF based on 352
its contribution to the explained variance by calculating a reduced explained variance EVf =
(egτ f−e0 thgτ f)2
(egτ f−µg)2 , 353
impact of the TF on the explanatory power of the model. The figure was then generated by using digraph library in Matlab, by selecting relevant TFs and corresponding genes in the N matrix. 358
Genes expression dynamics and bookmarking
359To establish which genes are associated to FOXA1, as shown in Fig. 3, panel A, we took into account the 360
mitotic ChIP-Seq peaks of FOXA1 from [6]. Then, for every peak, we selected the nearest expressed gene, 361
using as references the corresponding TSS and the average point of the selected peak. So, we obtained a 362
list of expressed genes that we defined the genes bound by FOXA1 during mitosis. 363
To establish which genes tend to be regulated by TFs with high or low MBF [4], as shown in Fig. 3, 364
panels C and D, we calculated what we called MBF weighted average scores (MWAS) as follows: for each 365
gene g, we took the number of binding sites Ngf corresponding to the factors f for which we know the 366
MBF score. Each of these values was multiplied for the corresponding MBF, and then they were summed 367
all together. Finally, this sum was divided by the total number of binding sites, i.e. the sumP
fNgf. 368
This score is what we called MWAS. Then we ranked the genes according to the MWAS, and we removed 369
the ones with MWAS = 0. The 10% of the genes with the highest MWAS were then considered associated 370
with enriched TFs (”enriched genes”), while the 10% of the genes with the lowest MWAS were considered 371
associated with the depleted TFs (”depleted genes”). 372
To obtain genes enriched or depleted in binding sites, we calculated for each gene promoter the total 373
number of binding sites, i.e. P
fNgf and then the 10% of the genes with largest number of binding sites 374
and the 10% of the genes with smallest number were considered to calculate average expression profiles as 375
Supporting information
377Fig. S1 378
Data processing for deconvolution A: Log2 histogram of FPKM reads at gene level for asynchronous 379
data. The dashed vertical line represents the threshold we considered to process our data: genes with 380
asynchronous F P KM < 36.76 were excluded. B: AIC and BIC scores were calculated in order to establish 381
the best λ parameter for the regularization of the deconvolution process (see Methods). Both AIC and 382
BIC showed a minimum, and we choose λ = 0.79, corresponding to the BIC minimum (dashed vertical 383
line). C: Average gene expression of convolved (grey line) and deconvolved (yellowish line) data were 384
Fig. S2 386
Cross validation of the linear model. A: A cross-validation 80/20 was performed to find the best 387
λ regularization parameter for inferring the TFs activity (see Inference of transcription factor activities). 388
A value λ = 443 was chosen (dashed vertical line), corresponding to the minimum of the Mean Squared 389
Error (MSE) of the test dataset (see Methods). B: The same analysis shown in the panel A was performed 390
by using Explained Variance (EV) instead of MSE. The dashed vertical line corresponds to the maximum 391
Fig. S3 393
Transcription factors dynamics taking into account only cell-cycle GO category. Here, only 394
TFs associated to genes belonging to the Gene Ontology (GO:0007049) category have been shown and 395
clustered. In this case, only 2 main groups of TFs have been individuated, and both of them show a 396
significant activity change over τ . The vertical white line represents τmit, and separates ideally the mitosis 397
from the interphase. On the right, the number of TFs for every cluster is indicated. 398
Fig. S4 399
Average MBF for mitotic and early G1 active transcription factors. Boxplots showing the 400
average MBF for TFs with higher activity during mitotis (green box) and during early G1 (orange box) 401
program of the University of Strasbourg. Furthermore, S.S., A.R. and N.M are grateful to the IGBMC to 405
provide an excellent working environment. 406
References
1. Palozola KC, Donahue G, Liu H, Grant GR, Becker JS, Cote A, et al. A changing paradigm of transcriptional memory propagation through mitosis.. Nature Reviews Molecular Cell Biology. 2019 Nov 12;20:55–64.
2. Luo H, Xi Y, Li W, Li J, Li Y, Dong S, Peng L, Liu Y, Yu W. Cell identity bookmarking through heterogeneous chromatin landscape maintenance during the cell cycle. Human molecular genetics. 2017 Nov 1;26(21):4231-43.
3. Festuccia N, Gonzalez I, Owens N, Navarro P. Mitotic bookmarking in development and stem cells. Development 2017 Oct 15;144(20):3633–45.
4. Raccaud M, Friman ET, Alber AB, Agarwal H, Deluz C, Kuhn T, et al. Mitotic chromosome binding predicts transcription factor properties in interphase Nature Communications 2019 Jan 10;7(10):e1002337.
5. Hettich J, Gebhardt JC. Transcription factor target site search and gene regulation in a background of unspecific binding sites. Journal of theoretical biology. 2018 Oct 7;454:91-101.
6. Caravaca JM, Donahue G, Becker JS, He X, Vinson C, Zaret KS. Bookmarking by specific and nonspecific binding of FoxA1 pioneer factor to mitotic chromosomes. Vol. 27, Genes & Development. 2013. p. 251–60.
7. Festuccia, N., Dubois, A., Vandormael-Pournin, S. et al. Mitotic binding of Esrrb marks key regulatory regions of the pluripotency network. Nature Cell Biology 2016 Oct 10;18:1139–1148. 8. C´edric Deluz, Elias T. Friman, Daniel Strebinger, Alexander Benke, et al. A role for mitotic
bookmarking of SOX2 in pluripotency and differentiation Genes & Development 2016 Nov 15;30:2538-2550.
9. Festuccia N, Owens N, Papadopoulou T, Gonzalez I, Tachtsidi A, Vandoermel-Pournin S, Gallego E, Gutierrez N, Dubois A, Cohen-Tannoudji M, Navarro P. Transcription factor activity and nucleosome organization in mitosis. Genome research. 2019 Feb 1;29(2):250-60.
10. Palozola KC, Donahue G, Liu H, Grant GR, Becker JS, Cote A, et al. Mitotic transcription and waves of gene reactivation during mitotic exit. Science. 2017 Oct 6;358(6359):119–22.
11. Javasky E, Shamir I, Gandhi S, Egri S, Sandler O, Rothbart SB, Kaplan N, Jaffe JD, Goren A, Simon I. Study of mitotic chromatin supports a model of bookmarking by histone modifications and reveals nucleosome deposition patterns. Genome research. 2018 Oct 1;28(10):1455-66. 12. Ginno PA, Burger L, Seebacher J, Iesmantavicius V, Sch¨ubeler D. Cell cycle-resolved chromatin
proteomics reveals the extent of mitotic preservation of the genomic regulatory landscape. Nature communications. 2018 Oct 2;9(1):1-2.
13. Balwierz PJ, Pachkov M, Arnold P, Gruber AJ, Zavolan M, van Nimwegen E. ISMARA: automated modeling of genomic signals as a democracy of regulatory motifs. Genome Res [Internet]. 2014 May;24(5):869–84.
14. Arnold P, Erb I, Pachkov M, Molina N, van Nimwegen E. MotEvo: integrated Bayesian probabilistic methods for inferring regulatory sites and motifs on multiple alignments of DNA sequences. Bioinformatics [Internet]. 2012 Feb 15;28(4):487–94. Available from: http://dx.doi.org/10.1093/bioinformatics/btr695
15. Kadauke S, Udugama MI, Pawlicki JM, Achtman JC, Jain DP, Cheng Y, Hardison RC, Blobel GA. Tissue-specific mitotic bookmarking by hematopoietic transcription factor GATA1. Cell. 2012 Aug 17;150(4):725-37
16. Lee YJ, Kim EH, Lee JS, Jeoung D, Bae S, Kwon SH, Lee YS. HSF1 as a mitotic regulator: phosphorylation of HSF1 by Plk1 is essential for mitotic progression. Cancer research. 2008 Sep 15;68(18):7550-60.
17. Teves SS, An L, Bhargava-Shah A, Xie L, Darzacq X, Tjian R. A stable mode of bookmarking by TBP recruits RNA polymerase II to mitotic chromosomes. Elife. 2018 Jun 25;7:e35621.
18. Stelzer G, Rosen N, Plaschkes I, Zimmerman S, Twik M, Fishilevich S, Stein TI, Nudel R, Lieder I, Mazor Y, Kaplan S. The GeneCards suite: from gene data mining to disease genome sequence analyses. Current protocols in bioinformatics. 2016 Jun;54(1):1-30.
19. Liu E, Li L, Cheng L. Gene Regulatory Network Review Encyclopedia of Bioinformatics and Computational Biology. 2019. p. 155–64.
20. Naumova N, Imakaev M, Fudenberg G, Zhan Y, Lajoie BR, Mirny LA, Dekker J. Organization of the mitotic chromosome Science. 2013 Nov 22;342(6161):948-53.
21. Dixon JR, Selvaraj S, Yue F, Kim A, Li Y, Shen Y, et al. Topological domains in mammalian genomes identified by analysis of chromatin interactions Vol. 485, Nature. 2012. p. 376–80.
23. Akaike H A new look at the statistical model identification IEEE transactions on automatic control. 1974 Dec;19(6):716-23.
24. Schwarz G Estimating the dimension of a model The annals of statistics. 1978;6(2):461-4. 25. Nie Y, Cheng X, Chen J, Sun X. Nucleosome organization in the vicinity of transcription factor