Publisher’s version / Version de l'éditeur:
Vous avez des questions? Nous pouvons vous aider. Pour communiquer directement avec un auteur, consultez la
première page de la revue dans laquelle son article a été publié afin de trouver ses coordonnées. Si vous n’arrivez pas à les repérer, communiquez avec nous à [email protected].
Questions? Contact the NRC Publications Archive team at
[email protected]. If you wish to email the authors directly, please see the first page of the publication for their contact information.
https://publications-cnrc.canada.ca/fra/droits
L’accès à ce site Web et l’utilisation de son contenu sont assujettis aux conditions présentées dans le site LISEZ CES CONDITIONS ATTENTIVEMENT AVANT D’UTILISER CE SITE WEB.
2005 Fire and Materials Conference [Proceedings], pp. 1-12, 2005-01-01
READ THESE TERMS AND CONDITIONS CAREFULLY BEFORE USING THIS WEBSITE.
https://nrc-publications.canada.ca/eng/copyright
NRC Publications Archive Record / Notice des Archives des publications du CNRC :
https://nrc-publications.canada.ca/eng/view/object/?id=0840808f-1560-4366-8ff2-7dcbd538229a https://publications-cnrc.canada.ca/fra/voir/objet/?id=0840808f-1560-4366-8ff2-7dcbd538229a
NRC Publications Archive
Archives des publications du CNRC
This publication could be one of several versions: author’s original, accepted manuscript or the publisher’s version. / La version de cette publication peut être l’une des suivantes : la version prépublication de l’auteur, la version acceptée du manuscrit ou la version de l’éditeur.
Access and use of this website and the material on it are subject to the Terms and Conditions set forth at
Medium-scale fire experiments of commercial premises
Medium-scale fire experiments of commercial
premises
Zalok, E.; Bwalya, A.; Hadjisopocleous, G.
NRCC-45397
A version of this document is published in / Une version de ce document se trouve dans: 2005 Fire and Materials Conference, San Francisco, Jan. 31-Feb. 2, 2005, pp. 1-12
Medium-Scale Fire Experiments of Commercial Premises
Ehab Zalok1, Alex Bwalya2 and George Hadjisopocleous1 1
Department of Civil and Environmental Engineering, Carleton University, Ottawa K1S 5B6, Canada
2
Fire Research Program, National Research Council Canada, Ottawa K1A 0R6, Ontario, Canada
Abstract
This paper presents and discusses the results of a fire load survey and of a set of medium-scale fire experiments, which were jointly conducted by Carleton University and the National Research Council of Canada (NRC) to determine the burning characteristics of combustibles in commercial premises. The experiments were conducted in a test room with ISO 9705 compatible dimensions and the fire load density used in the experiments ranged from 661 MJ/m2 to 4,900 MJ/m2. The long-term objective of this work is to develop design fires for commercial buildings. The combustibles present in the buildings were determined through a fire load survey of 168 commercial premises that was conducted in 2003 in the Canadian cities of Ottawa and Gatineau. The products in the shops included clothing, footwear, toys, computer equipment, books, foodstuff, alcohol, pharmaceuticals, arts and crafts supplies, and photographic and hairdressing products.
The results from the tests reveal interesting and varied burning characteristics of the fuel packages simulating the fuel loads found in the different shops. Fuel packages consisting of high plastic, rubber and edible-oil content attained high peak heat release rates (1,300 to 1,950 KW) and exhibited fast fire growth and significant smoke production (0.96 to 2.74 OD/m).
The paper also presents the detailed results, including a test log, of a fire test with a fuel package simulating a fast food shop. The results show that the fire reached a peak heat release rate of about 1562 kW at 6.5 minutes from ignition, and a peak gas temperature of 735 °C in the hot layer.
Introduction
Many countries around the world favour the adoption of performance-based building codes due to the well-publicized benefits in fire safety, design flexibility, cost, and quality that can be achieved. A performance-based approach to fire safety evaluation and design of buildings is an elaborate process consisting of many steps and requires the use of decision-making tools based on analytical and computational methods. The selection of a suitable fire of assumed characteristics, which is referred to as the “design fire”, is one of the most important steps in this process. A design fire is generally considered to be a quantitative description of the main time-varying properties of a fire based on reasonable assumptions about the type and quantity of combustibles, ignition method, growth of the fire and it’s spread from the first item ignited to subsequent items, and the decay and extinction of the fire1. The main time-varying properties that define a fire are the heat release rate (HRR), fire effluent (smoke and combustion gases, such as carbon dioxide (CO2), carbon monoxide (CO), and hydrogen cyanide (HCN)), and temperature. Fire experiments are an indispensable means of determining these variables2, particularly when published information is lacking, and provide valuable insight into many aspects of the combustion behaviour of materials.
The fire load density and composition of combustibles were determined from a survey of commercial buildings that was conducted in the Canadian cities of Ottawa and Gatineau, which are in the provinces of Ontario and Quebec, respectively. However, for some fuel packages, there was no published data available and therefore a project comprising of medium- to large-scale fire experiments was initiated to determine the combustion characteristics of the fuel packages determined from the
survey and to study fully-developed room fires. Detailed results from a fire test with a fuel package representing fast food shops and a summary of the results of some of the other medium-scale experiments is presented in this paper. This fuel package is a reasonably good representation of other attached or similar premises such as restaurants and seating areas and kitchens.
Fire load Survey
Information about the combustible contents and configuration of a building is needed in order to evaluate various aspects of fire safety. The quantity of movable combustibles in a compartment is commonly expressed as the total heat energy (MJ) that can be released through complete combustion, and is known as the fire load. The fire load is often expressed as an energy density (fire load per unit floor area in MJ/m2) to enable extrapolation to compartments of different sizes. At times, the contribution of the combustible parts of the building structure (the fixed fire load) is included in the total fire load. However, it is often the quantity of the building’s combustible contents (the movable fire load) that is needed for most fire safety evaluations.
The survey was conducted by entering the buildings and listing the contents and their pertinent characteristics. Weights were determined by a combination of the direct weighing and inventory techniques3. The results of the survey are summarized in Table 1. The fire load densities of all 168 stores surveyed have a lognormal distribution with a mean of 747 MJ/m2 and a standard deviation 833 MJ/m2, indicating significant spread, as can be expected. Detailed results of the fire load survey have been published elsewhere 4, 5.
Table 1. Floor area, fire load density and total fire load for all 168stores in the survey.
Mean Range Standard deviation 95th percentile
Floor area [m2] 102 3.25 – 1,707 183 333
Fire load density [MJ/m2] 747 56 – 5,305 833 2,050 Total Fire load [MJ] 52,339 1,126 – 511,413 77,166 167,383
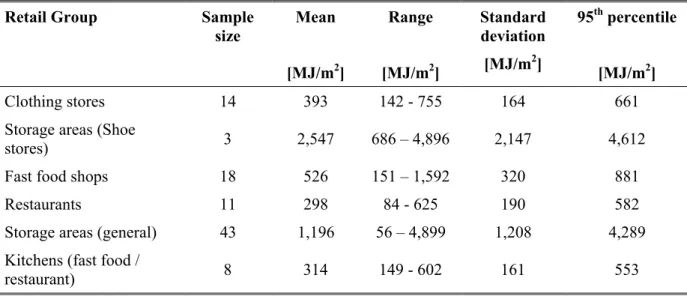
In Table 2, the stores surveyed are conveniently arranged in like groups. In general, storage areas tend to have the highest fire load densities.
Table 2. Floor area, fire load density and total fire load for the major groupings. Retail Group Sample
size Mean [MJ/m2] Range [MJ/m2] Standard deviation [MJ/m2] 95th percentile [MJ/m2] Clothing stores 14 393 142 - 755 164 661
Storage areas (Shoe
stores) 3 2,547 686 – 4,896 2,147 4,612
Fast food shops 18 526 151 – 1,592 320 881
Restaurants 11 298 84 - 625 190 582
Storage areas (general) 43 1,196 56 – 4,899 1,208 4,289 Kitchens (fast food /
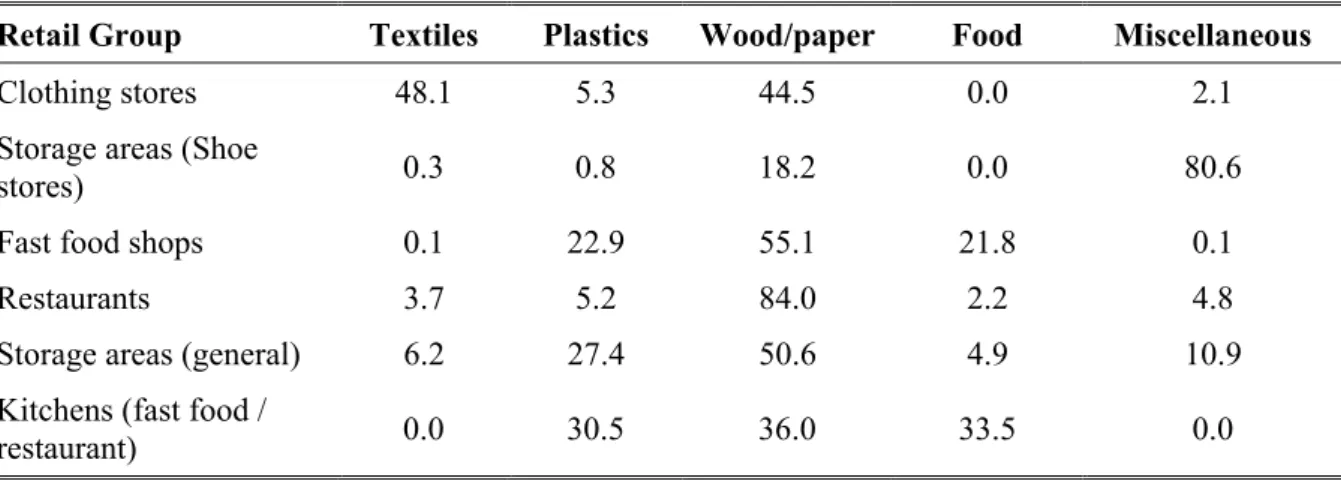
Table 3 shows the contribution of four types of generic materials – textiles, plastics, wood and paper, and foodstuff – to the total fire load. Any combustibles that did not fit into these four material groups, such as alcohol, rubber and tobacco products, were classified as ‘miscellaneous’.
Table 3. Mean composition (%) of combustibles by generic materials
Retail Group Textiles Plastics Wood/paper Food Miscellaneous
Clothing stores 48.1 5.3 44.5 0.0 2.1
Storage areas (Shoe
stores) 0.3 0.8 18.2 0.0 80.6
Fast food shops 0.1 22.9 55.1 21.8 0.1
Restaurants 3.7 5.2 84.0 2.2 4.8
Storage areas (general) 6.2 27.4 50.6 4.9 10.9 Kitchens (fast food /
restaurant) 0.0 30.5 36.0 33.5 0.0
Experimental Setup
The fire experiments were conducted in an ISO-97056 compatible room calorimeter, which was instrumented to measure heat release rate, mass loss, smoke density, temperatures and heat flux. Figure 1 is a schematic illustration of the floor plan and instrumentation of the test room. The dimensions of the room are 2.4 m x 3.6 m x 2.4 m high, with a 0.8 m x 2.0 m high doorway in one of the 2.4 m x 2.4 m walls. The door opening is directly under a fume hood, which is connected to an exhaust duct having a diameter of 406 mm. Measurements of mass flow rate, gas temperature and concentrations of oxygen, carbon dioxide and carbon monoxide were taken in the hood exhaust duct to facilitate calculation of the heat release rate by using an oxygen consumption method 7. The smoke density was measured in the duct using a pulsed white light meter. Additional measurements taken in the fire compartment were: mass loss (using load cells), heat flux at the floor level and temperatures at the locations shown in Figure 1.
Figure 1. Floor plan of test room showing thermocouple positions
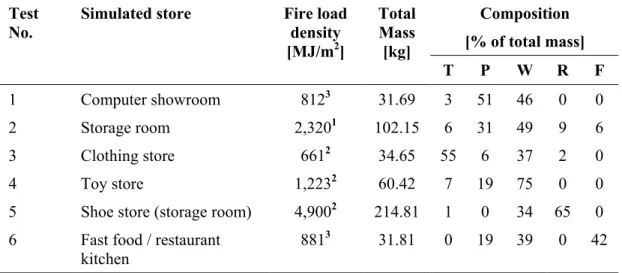
Table 4 shows the fire load density, mass and composition for six of the experiments that were conducted. Each fuel package, representing a fire load density determined from the survey, was limited to a 1m2 footprint and consisted of different new and used materials, such as plastics, textiles,
paper, rubber and wood products in the proportions found in the survey. Detailed results of tests 1, 2, 3, 4 and 5 have been presented in previous publications5, 8. Therefore, only the detailed results of the fast food test are presented here.
Table 4. Fire load density, mass and composition of combustibles used in the experiments. Composition
[% of total mass] Test
No.
Simulated store Fire load density [MJ/m2] Total Mass [kg] T P W R F 1 Computer showroom 8123 31.69 3 51 46 0 0 2 Storage room 2,3201 102.15 6 31 49 9 6 3 Clothing store 6612 34.65 55 6 37 2 0 4 Toy store 1,2232 60.42 7 19 75 0 0
5 Shoe store (storage room) 4,9002 214.81 1 0 34 65 0 6 Fast food / restaurant
kitchen
8813 31.81 0 19 39 0 42
1
90th percentile; 2 95th percentile; 3 maximum.
T: Textiles; P: Plastics; W: Wood and paper; R: Rubber and leather; F: Food derivative
Test no. 6 simulated a cooking area in a fast food restaurant. The test setup (fuel package) is shown in the photograph in Figure 2. The fuel package consisted of a wooden storage cabinet with two shelves, which was filled with cooking oil (in three-litre plastic containers), textiles, paper napkins and wrappers, and bundles of Styrofoam plates and cups. The fuel package was placed in a shallow steel pan in order to contain the resulting pool of cooking oil within the package area. The ignition source used in the experiments was a 75 KW T-burner, which was applied for four (4) minutes. This ignition source simulates a fire from a waste paper basket. Figure 3 shows a photograph of the fuel package shortly after ignition.
Figure 2. Test set-up Figure 3. Ignition with a T-burner
The fire load density of this fuel package, 881 MJ/m2, represents the 95th percentile of the fire load density of the surveyed fast food shops (Table 2). This fire load density is a reasonably good
representation of other attached or similar premises such as restaurants (582 MJ/m2) and seating areas and kitchens (552 MJ/m2).
RESULTS, OBSERVATIONS AND DISCUSSION
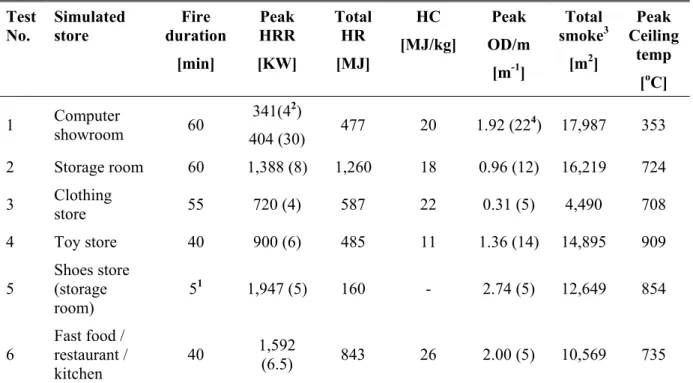
The results of the six fire tests are summarized in Table 5. Test 1 (computer showroom) had the lowest peak HRR and it took the longest time to be attained. Despite the slow fire growth and low peak HRR, this test produced the greatest amount of smoke as can be seen from the rankings of total smoke production in Table 6. With the exception of test 1, the fuel packages with a high rubber and plastic content, tests 2, 5 and 6, tend to have high peak HRRs. The low peak HRR and slow fire growth observed in test 1, which also had a high plastic content, is likely due to the fact that the enclosures of most computer equipment are often manufactured from UL94 classified materials9. Test 3 (clothing store) had the lowest total smoke production due to its high textile and wood (shelving) composition. The initial fire growth on the textiles was rapid and at a later stage of the fire was predominately wood burning with its characteristic low smoke production.
The total heat energy release (Total HR) is, as can be expected, influenced by the quantity of combustibles – the higher the fire load density the greater the total HR. The total HR ranking in Table 6 shows that test 2, which had the highest fire load density among the tests that proceeded to the burn-out stage, released the greatest quantity of heat energy. The measured total HR values for tests 3 (clothing store) and 6 (fast food) show excellent agreement with the results from the survey due, in part, to the fact that little mass was left unburned. In the other tests, various factors such as incomplete or inefficient combustion and combustion occurring outside of the fire room, are likely explanations for the discrepancy with survey results. The peak room temperature is also seen to be influenced by the HRR, with higher values being obtained in the tests with high HRR values.
Table 5. Summary of the test results. Test No. Simulated store Fire duration [min] Peak HRR [KW] Total HR [MJ] HC [MJ/kg] Peak OD/m [m-1] Total smoke3 [m2] Peak Ceiling temp [oC] 1 Computer showroom 60 341(42) 404 (30) 477 20 1.92 (22 4 ) 17,987 353 2 Storage room 60 1,388 (8) 1,260 18 0.96 (12) 16,219 724 3 Clothing store 55 720 (4) 587 22 0.31 (5) 4,490 708 4 Toy store 40 900 (6) 485 11 1.36 (14) 14,895 909 5 Shoes store (storage room) 51 1,947 (5) 160 - 2.74 (5) 12,649 854 6 Fast food / restaurant / kitchen 40 1,592 (6.5) 843 26 2.00 (5) 10,569 735 1
The test was terminated early as HRR exceeded capacity of the test facility; 2 Time at which the peak HRR occurred [min]; 3 Calculated using the ASTM1537 method10; 4 Time at which the peak OD/m occurred [min].
The values of heat of combustion (HC) calculated from the experiments are also given in Table 5. The low HC value for test 4 (toy store) is attributed to the fact that a significant portion (84%) of the
fuel was wood and paper. The soft and hard plastic toys burned very rapidly leaving behind a collapsed heap of wood that burned rather inefficiently.
Table 6. Ranking of the fire tests by fire qualities. Peak HRR [KW] Total HR [MJ] Peak OD/m [m-1] Total smoke3 [m2] Peak Ceiling temp [oC] 5 2 5 1 4 6 6 6 2 5 2 3 1 4 6 4 4 4 5 2 3 1 2 6 3 1 5 3 3 1
1: Computer showroom; 2: Storage room; 3: Clothing sore; 4: Toy store; 5: Shoe store; 6: Fast food/restaurant/kitchen
Observations for Test 6 (fast food)
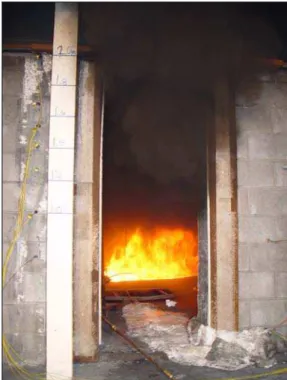
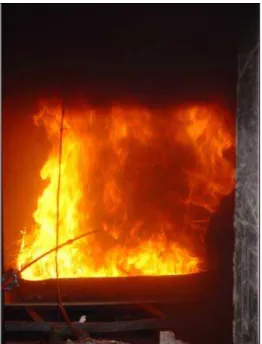
The photographs in Figures 3 to 7 show the progression of the fire from ignition to extinction. Due to the pool burning of the cooking, this fuel package produced very dense black smoke (Figure 5) at nearly the same time as the peak HRR was reached. A log of the observations made during the test is given in Table 7.
Figure 6. Decay phase Figure 7. Debris at the end of the test.
Table 7. Test log during test 6. Time
[min:sec] Fire events
0:00 Ignition - close to cooking oil container (Figure 2), paper napkins and pile of polystyrene cups on lowest shelf.
0:15 Flames spread to paper napkins on second shelf and cooking oil containers rupture, spilling oil onto the pan (fire most likely self-sustaining at this point).
0:30 Further flame spread to paper napkins and polystyrene plates on second shelf. 0:45 Wooden cabinet begins to burn (flaming).
1:10 Flames spread to more combustibles and some burning items off the shelves. 1:30 Oil in the steel pan burning in a pool configuration. Light smoke layer at 1.3m. 1:45 Flames spread to more plastic containers causing them to melt down and burn in the
pan.
1:55 Flames spread to a cane container (left side of cabinet).
2:00 Fire growth accelerates, engulfing the wooden cabinet in flames. The layer of dense black smoke at a height of 1.1m.
3:00 All combustibles involved in the fire. The smoke is blacker with the smoke layer still at 1.1m. Flames are invisible in the dense smoke upper layer.
5:00 Peak concentration of CO researched. Still blacker smoke with the smoke layer down to 1.0m. Flames are still invisible in the dense smoke upper layer. An overflow of smoke from the exhaust duct was noticed.
5:20 Crumpled papers on floor begin to burn. Blacker smoke with a smoke layer still at 1.0m.
6:30 Peak value of HRR and concentrations of O2 and CO2 reached. Blacker smoke with the smoke layer down 0.8m level (flames invisible above the 1.0 m smoke layer level.
7:30 Beginning of the decay phase; black smoke layer at 1.0m level. 16:30 Black smoke with a smoke layer at 1.2m level.
21:00 Black smoke with a smoke layer at 1.4m level. 40:00 Fire burns out.
Detailed Results for Test 6
Figure 8 shows the heat release rate. The initial fire growth was fast and the HRR peaked at 1562 kW, 6.5 minutes after ignition. Two minutes after attaining its peak, the HRR was almost halved to 800 kW. This level was sustained for a brief period of 2.5 minutes following which a gradual decline ensued with the HRR dropping to 100 kW at 20 minutes and remaining at roughly this level for the remaining duration of the test.
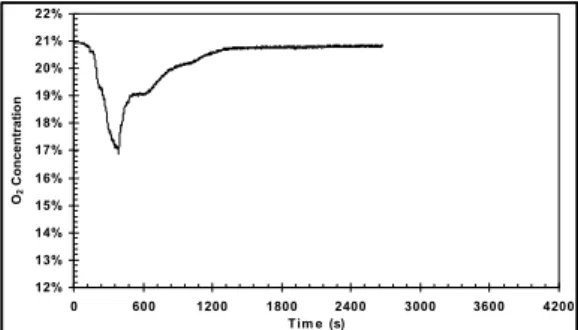
The concentration profiles of O2, CO, and CO2 are shown in Figure 9 to Figure 11. The concentration of O2 reached a minimum value of 16.8 %, and the maximum concentrations of CO and CO2 were 0.0636 % (636 ppm) and 3.61 %, respectively.
The temperatures in the fire compartment were measured at five locations on the ceiling, one centrally-located thermocouple tree and another thermocouple tree located near the doorway, as shown in Figure 1. These temperature profiles are shown in Figure 12 (ceiling), Figure 13 (centre thermocouple tree) and Figure 14 (thermocouple tree near doorway); the respective maximum temperatures reached were 633, 735 and 459 oC. The temperature profile at the sampling point in the duct is shown in Figure 15; the maximum temperature reached was 173 oC. Figure 16 shows the heat flux profile and Figure 17 shows the temperature profile recorded by a thermocouple that was placed beside it. The maximum heat flux level recorded value was 13.96 kW/m2, and the maximum temperature recorded by the thermocouple, which was placed on the floor, was 110 oC.
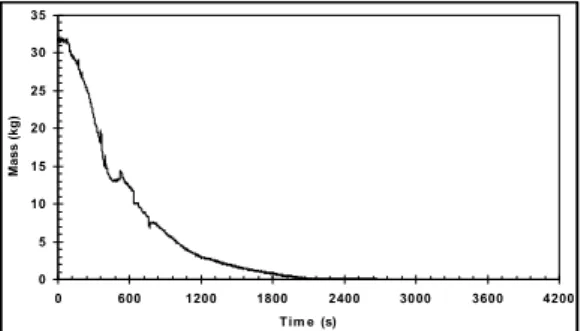
The optical density per meter (OD/m) is shown in Figure 18. The highest reading was 2.0 OD/m, representing a visibility limit of approximately 0.5 m. Figure 19 shows the decrease of mass during the test. The initial mass of the package was 31.81 kg and the mass loss was almost complete as the remainder was a mere 0.114 kg (99% of the initial mass).
0 200 400 600 800 1000 1200 1400 1600 1800 0 600 1200 1800 2400 3000 3600 4200 Tim e (s) Heat Rel ease Rat e ( K W)
Figure 8. Heat release rate (kW).
12% 13% 14% 15% 16% 17% 18% 19% 20% 21% 22% 0 600 1200 1800 2400 3000 3600 4200 Tim e (s) O2 Concent rat io n
0.00% 0.01% 0.02% 0.03% 0.04% 0.05% 0.06% 0.07% 0 600 1200 1800 2400 3000 3600 4200 T im e (s) CO Concentration
Figure 10. Carbon monoxide concentrations (%).
0.0% 0.5% 1.0% 1.5% 2.0% 2.5% 3.0% 3.5% 4.0% 0 600 1200 1800 2400 3000 3600 4200 T im e (s) CO 2 Concentration
Figure 11. Carbon dioxide concentrations
(%). 0 100 200 300 400 500 600 700 800 0 600 1200 1800 2400 3000 3600 4200 Tim e (s) C e iling Tem p erature ( oC) North TC W e st TC Ea st TC Ce ntre TC S outh
Figure 12. Temperature (oC) at the ceiling of the room. 0 100 200 300 400 500 600 700 0 600 1200 1800 2400 3000 3600 4200 Tim e (s) Tr ee Temper at ur e ( oC) TC@ 2.4m TC@ 2.05m TC@ 1.46m TC@ 0.98m TC@ 0.46m
Figure 13. Temperature (oC) at the middle of the room. 0 50 100 150 200 250 300 350 400 450 500 0 600 1200 1800 2400 3000 3600 4200 T im e (s) Wal l Temper at ur e ( oC) TC@ 0.66m TC@ 0.94m TC@ 1.24m TC@ 1.40m TC@ 1.55m TC@ 1.70m TC@ 2.03m
Figure 14. Temperature (oC) at the inside wall surface close to the doorway.
0 20 40 60 80 100 120 140 160 180 200 0 600 1200 1800 2400 3000 3600 4200 Tim e (s) Duct Temper at ur e ( oC)
Figure 15. Temperature (oC) inside the duct, at sampling point. 0 2 4 6 8 10 12 14 16 0 600 1200 1800 2400 3000 3600 4200 Tim e (s) Heat Fl ux ( k W/ m 2)
Figure 16. Heat flux (kW/m2).
0 20 40 60 80 100 120 0 600 1200 1800 2400 3000 3600 4200 Tim e (s) Tem p
erature at Heat Flux (
OC )
Figure 17. Gas temperature (oC) at the heat flux meter.
0.0 0.5 1.0 1.5 2.0 2.5 0 600 1200 1800 2400 3000 3600 4200 T im e (s)
Optical Density/m (OD/m)
Figure 18. Optical density (OD/m).
0 5 10 15 20 25 30 35 0 600 1200 1800 2400 3000 3600 4200 T im e (s) Mass ( kg)
Figure 19. Package mass (kg).
Conclusion
The combustion characteristics – rate of heat release, fire growth, production of combustion products – of various fuel packages simulating computer, clothing, toy, shoe and fast food stores in commercial premises were determined by conducting fire experiments. The results of the fire test with a fuel package (881 MJ/m2 FLED) simulating fast food shops show that the resulting fire reached a peak heat release rate of about 1562 kW at 6.5 minutes from ignition, and a peak gas temperature of 735 °C in the hot layer. The O2 concentration reached a minimum of 16.8 %, and CO and CO2 concentrations reached a maximum of 0.0636 % (636 ppm) and 3.61 % respectively, for an average volumetric flow rate of about 3.2 m3/s in the 406 mm diameter exhaust duct. The maximum value of radiant heat flux recorded at the floor level was 13.96 kW/m2, and the maximum temperature recorded by an adjacent thermocouple was 110 oC. The optical density of the duct flow reached a maximum of 2.0 OD/m, representing a visibility limit of approximately 0.5 m. A 99 % mass loss was recorded in this and the measured FLED (843 MJ/m2) was in excellent agreement with survey results (881 MJ/m2).
The main findings of this work are:
1. The fuel packages consisting of high plastic, rubber and edible-oil content attained high peak HRRs and exhibited fast fire growth and significant smoke production. 2. Computer equipment, despite having a slow fire growth and low peak HRRs, poses a
significant hazard to life from a smoke production viewpoint.
3. The clothing store fuel package had the lowest total smoke production due to its high textile and wood (shelving) composition.
4. The values of heat of combustion for the composite fuel packages tested ranged from 11 MJ/kg (toy store) to 26 MJ/kg (fast food store).
Future Work
Carleton University and the Fire Research Program at NRC will shortly be commencing the second Phase of this project, in which the fuel packages from the medium-scale tests reported in this paper will be scaled-up to study fully-developed room fires beyond flashover. The primary goal of the research that is being undertaken by Carleton University is to develop and validate engineering tools that fire protection engineers can use to design fire-safe, light-frame buildings in a performance based-code environment. These fire experiments are a means to developing representative design fires for these buildings.
In a quest to develop rational analytical tools for evaluating fire safety in residential buildings, the Fire Research Program is planning to undertake a major research project involving small- to large-scale experiments and numerical modelling. Fire experiments will be conducted to determine the
combustion characteristics of typical household furnishings, individually in an open calorimeter and collectively in realistically furnished rooms. The fire load densities, furnishings and room configurations to be used in the experiments will be based on two residential fire load surveys 11, 12 that were conducted between 2003 and 2004. The results from this project would form the basis for developing design fires for residential buildings.
ACKNOWLEDGEMENTS
Firstly, the authors sincerely thank Forintek Canada Corporation and the Natural Sciences and Engineering Research Council (NSERC) for their support of the Industrial Chair in Fire Safety Engineering at Carleton University. Secondly, the authors kindly acknowledge Professor Jim Mehaffey, NRC staff at the Fire Research Program, and Public Works and Government Services Canada for their invaluable help with this study.
Abbreviations
FLED Fire load energy density MJ/m2
HC Heat of combustion MJ/kg
HR Heat energy released by combustion MJ HRR Rate of heat energy release (heat release rate) KW
OD Optical density
ppm Concentration in parts per million TC Thermocouple
References
1. International Organization for Standardization, 1999, ISO/TR 13387-2:1999(E): Fire Safety Engineering - Part 2: Design Fire Scenarios and Design Fires, Geneva, Switzerland.
2. Chow, W. K., Zou, Gaowan, Dong, Hui, and Gaw, Ye, 2003, Necessity of Carrying Out Full-Scale Burning Tests for Post-Flashover Retail Shop Fires, International Journal on Engineering Performance-Based Fire Codes, Vol.5, No.1, p.20-27.
3. Kumar, Sunil and Rao, C. V. S. Kameswara, 1995, Fire Load in Residential Buildings, Building and Environment, Vol.30, No.2, p.299-305.
4. Hadjisophocleous, George and Zalok, Ehab, 2003, A Survey of Fire Loads in Commercial Floors of Office Buildings, Fourth International Seminar on Fire and Explosion Hazards, Londonderry, Northern Ireland, UK,
5. Hadjisophocleous, G. and Zalok, E., 2004, Development of Design Fires for Commercial Buildings. Fire Safety Engineering Conference - issues and solutions, Australia Society of Fire Safety, (March 23-24).
6. International Organization for Standardization, 1993, ISO 9705:1993(E): Full-Scale Room Test for Surface Products, Geneva, Switzerland.
7. Janssens, Marc L., 1991, Measuring Rate of Heat Release, Fire Technology, (August), p.234-235.
8. Hadjisophocleous, G. and Zalok, E., 2004. Fire Loads and Design Fires for Commercial Buildings. Interflam 20004 10th International Fire Science and Engineering Conference, Vol. 1, pp. 435-446, Interscience. (July).
9. Simonson, Margaret, Andersson, Petra, and Bliss, Donald, 2004, Fire Performance of Selected IT-Equipment, Fire Technology, Vol.40, No.1 January, p.27-37.
10. American Society for Testing and Materials, 2002, ASTM E1537-02a: Standard Test Method for Fire Testing of Upholstered Furniture, PA, USA.
11. Bwalya, A. C., Sultan, M. A., and Bénichou, N., 2004. A Pilot Survey of Fire Loads in Canadian Homes. Research Report 159, Institute for Research in Construction, National Research Council Canada, Ottawa, Ontario, Canada. (March).
12. Bwalya, A. C. , 2004. An Extended Survey of Combustible Contents in Canadian Residential Living Rooms. Research Report 176, Institute for Research in Construction, National Research Council Canada, Ottawa, Ontario, Canada. (November).