HAL Id: hal-02289323
https://hal.inria.fr/hal-02289323
Submitted on 16 Sep 2019
HAL is a multi-disciplinary open access
archive for the deposit and dissemination of
sci-entific research documents, whether they are
pub-lished or not. The documents may come from
teaching and research institutions in France or
abroad, or from public or private research centers.
L’archive ouverte pluridisciplinaire HAL, est
destinée au dépôt et à la diffusion de documents
scientifiques de niveau recherche, publiés ou non,
émanant des établissements d’enseignement et de
recherche français ou étrangers, des laboratoires
publics ou privés.
Tuning optimal traffic measurement parameters in
virtual networks with machine learning
Karyna Gogunska, Chadi Barakat, Guillaume Urvoy-Keller
To cite this version:
Karyna Gogunska, Chadi Barakat, Guillaume Urvoy-Keller. Tuning optimal traffic measurement
parameters in virtual networks with machine learning. CloudNet 2019 - 8th IEEE International
Conference on Cloud Networking, Nov 2019, Coimbra, Portugal. �hal-02289323�
Tuning optimal traffic measurement parameters in
virtual networks with machine learning
Karyna Gogunska, Chadi Barakat
Universit´e Cˆote d’Azur, Inria, France
Guillaume Urvoy-Keller
Universit´e Cˆote d’Azur, CNRS/I3S, France
Abstract—With the increasing popularity of cloud networking and the widespread usage of virtualization as a way to offer flexible and virtual network and computing resources, it becomes more and more complex to monitor this new virtual environment. Yet, monitoring remains crucial for network troubleshooting and analysis. Controlling the measurement footprint in the virtual network is one of the main priorities in the process of monitoring as resources are shared between the compute nodes of tenants and the measurement process itself. In this paper, first, we assess the capability of machine learning to predict measurement impact on the ongoing traffic between virtual machines; second, we propose a data-driven solution that is able to provide optimal monitoring parameters for virtual network measurement with minimum traffic interference.
Keywords—Cloud monitoring, Open vSwitch, sFlow, sampling optimization, online machine learning.
I. INTRODUCTION
The ability to perform traffic monitoring in virtual networks is a key instrument in the troubleshooting toolbox of both cloud tenants and providers. sFlow [1] is the reference tool that allows to perform such traffic monitoring in virtual networks based on Open vSwitch (OvS) [2]. The tool has been initially designed for physical switches and routers, then adapted to virtual networks. With sFlow, network equipment samples the packets at a rate indicated by the user before packing them (after a controlled truncation) into an sFlow packet that is sent to a dedicated machine called the collector. The key idea is to minimize the amount of work done at the network equipment and leave the analysis to the collector itself. The sampling rate can range from a few percent to a full capture, with the latter similar to port mirroring. As an example, Facebook continuously monitors its data centers servers at a rate of 1 out of 30,000 packets with a tool akin to sFlow [3].
In a previous work [4], we have demonstrated that traffic monitoring with sFlow costs not only in terms of the CPU cycles of the physical system (where the virtual network is deployed), but also causes reductions in the throughput of the operational traffic of the embedded virtual network. Fig. 1 illustrates the case: we can observe that the traffic between two Virtual Machines (VMs) inside the same physical node decreases in terms of throughput immediately after sFlow is turned on, with a penalty that is proportional to the configured sampling rate. We refer to this throughput reduction as drop of throughputor, alternatively, impact of sFlow sampling.
To determine the root cause of this interference, we were questioning the system resource limitations for OvS and sFlow
(server CPU, context switching); however it appeared that such limitations do not exist, and that the impact is coming from other limitations related to the operating system and the way it handles the data path of OvS and the forwarding of sampled packets between OvS and sFlow. Even though the nature of such interference is not clear, we believe that the footprint of network monitoring needs to be reduced to the minimum, or at least to be well modeled so that this footprint could be better anticipated and controlled. The best option would likely be to optimally tune sFlow monitoring parameters (sampling rate in particular) so as to alleviate traffic disturbance while providing a good monitoring service at the same time. However, the exact correlation between different monitoring parameters and their impact on the application traffic is non-obvious. Certain Machine Learning techniques (e.g., decision trees) could assist us in uncovering such a correlation, which would enable us to tune the monitoring parameters optimally.
Considering these findings, in this work we aim to propose a solution that is based on Machine Learning to (i) identify potential drop in throughput due to traffic measurement and (ii) automatically tune monitoring parameters so as to limit the measurement and traffic interference in the virtual envi-ronment. The objective is not to exceed a desired level of throughput reduction in a context where throughput varies, so the parameters of monitoring have to be adapted accordingly. Next, we summarize the related work, then we describe our methodology based on data analysis and machine learning and provide an overview of our dataset. In Section IV we present an offline study on our dataset where we model the relationship between throughput and throughput loss given the sampling rate. Section V builds upon the offline analysis to propose an online variant; it iteratively learns from previous experiences (with monitoring and its impact) to build a model, which is able to pinpoint the optimal tuning of sampling rate in sFlow, so that the impact of monitoring is limited to a certain desired level. We validate the online variant with two synthetic traces we built for the purpose of the study and compare its performance to the offline variant. We conclude the paper in Section VI with some perspectives on our future research.
II. RELATED WORK
Several cloud measurement frameworks offering virtual network health monitoring have been proposed. A review of the current challenges and solutions in SDN network moni-toring is made in [5]. CloudHealth [6] offers a model-based
Time (s) 0 100 200 300 400 500 600 Achieved throughput (Mbps) 101 102 103 104← A → ← B → ← C → ← A → ← B → ← A →
Fig. 1: Traffic throughput at different sampling rates of sFlow: no sampling (A), 100% sampling (B), 50% sampling (C). [4] approach, translating specific monitoring goals into metrics to be collected in the system. Sampling techniques adapted to SDN are investigated in [7], [8].
Recently, various networking areas started to benefit from the usage of machine learning. Authors of [9] introduce a new paradigm called Knowledge-Defined Networking, which relies on Software-Defined Networking (SDN), Network Analytics and Artificial Intelligence. They study several use-cases and show the applicability and benefits of adopting the machine learning paradigm to the networking field. Following this trend, anomaly detection in the cloud with machine learning is studied in [10], VNF anomaly detection in [11], traffic control with deep learning in [12], and identification of host roles with supervised learning with sFlow in [13].
In a virtualized network, the trade-off between network monitoring accuracy and resource usage needs to be taken into account. PayLess [14] is an adaptive SDN monitoring algorithm which adapts the frequency of collecting statistics to control the monitoring overhead. More generally, the question of such a trade-off is studied in [15], where the authors argue that considering the amount of system resources of modern servers, packet processing performance (e.g., throughput and latency) becomes a key challenge in the process of software networks measurement.
The problem of sFlow throughput degradation in virtual networks built on top of OvS is mentioned in [16]. While proposing a network wide monitoring service for clouds, the authors do not investigate further the phenomenon of sFlow impact on application traffic and only suggest to carefully choose its configuration parameters. In our work we propose to rely on machine learning to choose the best performing mea-surement parameters so as to provide proper packet processing performance with a controlled impact on user traffic.
III. DATASET CONSTRUCTION AND METHODOLOGY
A. Methodology
In this paper, we address two problems, namely a classifi-cation and a regression problem, using machine learning. The classification problem can be cast as follows: given a sampling rate S (in percent), a traffic rate R (in bps) measured when there is no sampling (the reference throughput), a drop in throughput of I percent because of sampling at rate S (which then becomes R × (1 − I/100)), and a maximum authorized impact level thrI(in percent), the question is to know whether
I is less or greater than thrI. This problem can be solved using
binary classification supervised machine learning techniques such as Decision Trees and Bayesian Networks.
The regression problem however is about the modeling of the impact I itself. This regression problem, which can be solved by regression machine learning techniques such as Random Forest, will open the door to our data-driven optimization which consists in finding the optimal sampling rate to use in sFlow such that the (estimated) impact I does not exceed the maximum authorized level thrI.
These two problems are investigated throughout the paper in an offline and online set-up. The offline set-up, where we train a classifier on a representative traffic dataset, enables to assess whether we can predict the impact of sampling in sFlow and to select the appropriate machine learning algorithm among a set of candidates. We consider several algorithms available in the scikit-learn library [17]: Decision Tree, K Nearest Neighbors, Naive Bayes, Random Forest, and SVM.
The online set-up targets more an operational scenario where the model estimating the impact of sampling (i.e., I) is built online with the objective to make it adaptive to physical server characteristics. We focus on building iteratively this model for the regression case, then show how such model can be used to optimally set the sampling rate. This will allow us to answer the question of which sampling rate to use so as to limit the disturbance of the ongoing traffic.
Our evaluation is done using traffic traces captured in a controlled virtual network environment that we describe in the next section together with our dataset.
B. Dataset
The training and testing datasets (that we used to build and estimate the performance of the learning algorithms) were collected within a dedicated experimental set-up. Our set-up consists of one physical server with 8 cores, 12 GB of RAM, and N virtual machines (VMs) interconnected with an OvS switch. Traffic between the VMs is generated with iPerf3 [18], where half of the machines act as senders and the other half as receivers. We generate UDP traffic for a set of predefined throughput values and packet sizes, and we apply the same configuration to the different iPerf3 senders. Therefore, the total amount of traffic generated is directly proportional to the number of VMs. We do not use TCP as we do not want the transport layer to adapt to the changing network conditions that result from the usage of sFlow. While our VMs are exchanging traffic between each other, we turn on sFlow on the OvS switch to collect network statistics for a set of predefined sampling rates S. We then measure the achieved throughput and compare it to the input traffic rate R to be able to calculate the drop in throughput I, if any. Our resulting datasets are thus composed of two sets of features: traffic-related features (number of VMs, input traffic rate, packet size) and measurement-related features (sampling rate, throughput reduction). We use the following values:
• sampling rate S: either disabled or gradually increasing from 0.1% to 100%;
• number of VMs N ∈ {2, 4, 6, 8};
• packet size: 128B, 256B, 512B, 1024B, 1448B;
• input traffic rate in bps per iPerf sender: from 100 Mbps to 1000 Mbps with steps of 100 Mbps;
• input traffic rate in packets per second.
Each experiment, consisting of one combination of the above parameters, is repeated 10 times to remove any bias and smooth average values. We perform experiments for all the above values of number of VMs, input traffic rate and sampling rate. As for the packet size, and because of the impossibility to accommodate small packet sizes at high rates in bps, we limit the experimentation of packets smaller than 1448B to an input traffic rate equal to 100 Mbps, and scan the entire range of input traffic rate defined above for only large packets of 1448B. It follows that our dataset consists of approximately 13,000 experiments that we split between a training set and a validation set as described next. Lastly, for the part on binary classification, we consider threshold values (i.e., thrI) of the
impact I ranging from 1% to 25%.
Fig. 2 gives a flavour of this dataset, where we show the impact as a heatmap versus the number of VMs and the sampling rate. Clearly, the more we go to the top right corner, the darker the colour as the impact has tendency to increase with the traffic load on the physical server and the sampling rate. We use the same dataset to validate both the offline and online models for impact I, though in a different manner. In the offline case, and to avoid any bias during the learning phase, we replace the 10 repeated experiments of the same scenario by a single experiment, where the impact is the average observed impact. This means that the offline dataset consists of 1,300 experiments. In the online case, we emulate the actual traffic variations observed in an operational scenario by concatenating the 13,000 experiments in a controlled manner so as to emulate either large or small traffic variations over time (more details in Section V). For each case, we split our dataset into two parts for training (80% of dataset) and validation (the rest 20% of dataset). We train our models on the training dataset and assess their prediction accuracy on the validation dataset.
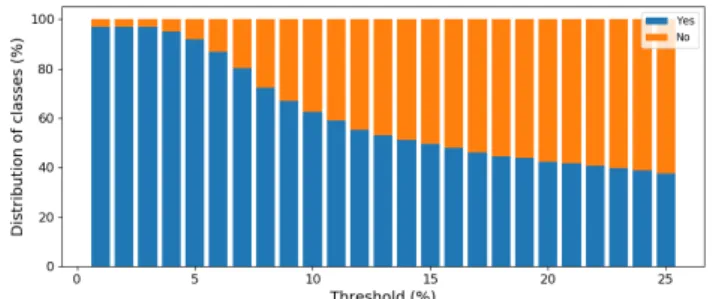
1) Handling the balance of our classes: Machine learning is sensitive to the distribution of classes in the datasets. If one class is prevalent over the other, the learner may make biased decisions towards the majority class. As we are using different values of impact threshold values, our dataset may show a disproportion between the two classes (i.e., impacted scenarios versus non-impacted ones). Fig. 3 depicts the distribution of classes in our dataset with respect to threshold thrI. While
the dataset shows a good balance between the two classes for large threshold values, there is a clear unbalance at low values of threshold (below 10%). To counter this unbalance, we use a well-known technique in the literature called Random Under-samplingwhich consists in randomly extracting instances from the majority class until the two classes are equal. Hereafter, and for the offline study, we compare our classification models on both balanced and unbalanced datasets.
(a)
Fig. 2: Sampling impact vs. sampling rate and number of VMs
Fig. 3: Unbalanced dataset: classes distribution vs threshold
IV. OFFLINE ANALYSIS
In this section, we investigate the ability of different ma-chine learning algorithms to detect and estimate the impact of turning on sampling in sFlow on the application traffic, given a wide range of experimental scenarios (i.e., traffic rate, number of VMs and sampling rate).
A. Detecting the impact of monitoring
The presence or absence of impact depends on the threshold of acceptable throughput reduction thrI. For a given threshold,
we can split our dataset into two classes: the YES class when there is impact (i.e., I > thrI) and the NO class when there
is no impact (i.e., I ≤ thrI). Our objective is to build a model
that can detect in what “case” the system is running.
We train and validate the different machine learning al-gorithms listed in Section III-A using the classical 10-fold cross-validation technique. We report each time the results for both the balanced and the unbalanced datasets, the former being threshold dependent. We first evaluate the algorithms using the accuracy metric, which is defined as the fraction of correctly classified YES and NO instances. Fig. 4 reports the achieved accuracy of prediction for both unbalanced (Fig. 4a) and balanced (Fig. 4b) datasets. The two most accurate classifiers appear to be the Decision Tree and the Random Forest classifiers. They perform at a minimum of 90% and 92% of accuracy for certain thresholds with an unbalanced
dataset; and 81% and 78% for a balanced one. We can thus conclude that these models are able to correctly capture the impact of sFlow on application traffic.
Threshold (%) 5 10 15 20 25 Accuracy percentage (%) 20 40 60 80 100 Decision Tree KNearest Naive Bayes Random Forest SVM (a) Threshold (%) 5 10 15 20 25 Accuracy percentage (%) 20 40 60 80 100 Decision Tree KNearest Naive Bayes Random Forest SVM (b)
Fig. 4: Accuracy of different classifiers vs impact threshold for unbalanced (4a) and balanced (4b) datasets
Precision 0 0.5 1 Recall 0 0.2 0.4 0.6 0.8 1 ↑ 1 ↑ 2 ↑ 3 ↑ 4 ↑ 5 ↑ 6↑ 7 ↑ 8 ↑ 9 ↑ 10 ↑ 11 ↑ 12 ↑ 13 ↑ 14 ↑ 15 ↑ 16 ↑ 17 ↑ 18↑19 ↑ 20 ↑ 21↑ 22 ↑ 23 ↑ 24↑25
Pre/rec Decision Tree YES
(a) Precision 0.5 0.6 0.7 0.8 0.9 Recall 0 0.2 0.4 0.6 0.8 1 ↑ 1 ↑ 2 ↑ 3 ↑ 4 ↑ 5 ↑ 6 ↑ 7 ↑ 8 ↑ 9 ↑ 10 ↑ 11 ↑ 12 ↑ 13 ↑ 14↑15 ↑ 16 ↑ 17 ↑ 18 ↑ 19↑20↑ 21 ↑ 22↑23 ↑ 24 ↑ 25
Pre/rec Decision Tree NO
(b) Precision 0 0.5 1 Recall 0 0.2 0.4 0.6 0.8 1 ↑ 1 ↑ 2 ↑ 3 ↑ 4 ↑ 5 ↑ 6 ↑ 7 ↑ 8 ↑ 9 ↑ 10 ↑ 11 ↑ 12 ↑ 13↑↑14 15 ↑ 16 ↑ 17 ↑ 18 ↑ 19 ↑ 20 ↑ 21 ↑ 22 ↑ 23↑24 ↑ 25
Pre/rec Random Forest YES
(c) Precision 0.4 0.6 0.8 1 Recall 0 0.2 0.4 0.6 0.8 1 ↑ 1 ↑ 2 ↑ 3 ↑ 4 ↑ 5 ↑ 6 ↑ 7 ↑ 8 ↑ 9 ↑ 10 ↑ 11 ↑ 12 ↑ 13 ↑ 14 ↑ 15 ↑ 16 ↑ 17 ↑ 18 ↑ 19↑ 20 ↑ 21 ↑ 22↑23 ↑ 24 ↑ 25
Pre/rec Random Forest NO
(d)
Fig. 5: Precision/recall vs impact threshold, unbalanced dataset We now focus on per-class classification results using the precision and recall metrics. Precision reports the fraction of correctly classified samples in a class, while recall reports the overall fraction of correctly classified instances. An ideal classifier should achieve a precision and recall equal to one.
Fig. 5 and Fig. 6 provide scatter plots of the precision and recall scores for the YES and NO classes for the set of considered impact thresholds. We conduct the study of precision/recall scores for all mentioned classifiers and only present the results for the best performing ones: Decision Tree and Random Forest classifiers. We can observe that the two
Precision 0 0.5 1 Recall 0 0.2 0.4 0.6 0.8 1 ↑ 1 ↑ 2 ↑ 3 ↑ 4 ↑ 5 ↑ 6 ↑ 7 ↑ 8 ↑ 9 ↑ 10 ↑ 11 ↑ 12 ↑ 13↑14 ↑ 15 ↑ 16 ↑ 17 ↑ 18 ↑ 19↑ 20 ↑ 21 ↑ 22 ↑ 23 ↑ 24 ↑ 25
Pre/rec Decision Tree YES
(a) Precision 0 0.5 1 Recall 0 0.2 0.4 0.6 0.8 1 ↑ 1 ↑ 2 ↑ 3 ↑ 4 ↑ 5 ↑ 6 ↑ 7 ↑ 8 ↑ 9 ↑ 10 ↑ 11 ↑ 12↑ 13 ↑ 14 ↑ 15 ↑ 16 ↑ 17 ↑ 18 ↑ 19 ↑ 20↑21 ↑ 22 ↑ 23 ↑ 24 ↑ 25
Pre/rec Decision Tree NO
(b) Precision 0 0.5 1 Recall 0 0.2 0.4 0.6 0.8 1 ↑ 1 ↑ 2 ↑ 3 ↑ 4 ↑ 5 ↑ 6 ↑ 7 ↑ 8 ↑ 9 ↑ 10 ↑ 11 ↑ 12 ↑ 13↑↑14 15 ↑ 16 ↑ 17 ↑ 18 ↑ 19 ↑ 20 ↑ 21 ↑ 22 ↑ 23↑24 ↑ 25
Pre/rec Random Forest YES
(c) Precision 0.4 0.6 0.8 1 Recall 0 0.2 0.4 0.6 0.8 1 ↑ 1 ↑ 2 ↑ 3 ↑ 4 ↑ 5 ↑ 6 ↑ 7↑ 8 ↑ 9 ↑ 10 ↑ 11 ↑12 ↑ 13 ↑ 14 ↑ 15 ↑ 16 ↑ 17 ↑ 18 ↑ 19↑ 20 ↑ 21 ↑ 22↑23 ↑ 24 ↑ 25
Pre/rec Random Forest NO
(d)
Fig. 6: Precision/recall vs impact threshold, balanced dataset scores can be indeed close to one for both classes. We can also observe that the distribution of observations per class has little impact on the obtained scores for these two classifiers. B. Quantifying the impact
It is important not only to identify the presence of impact, but also to predict its numerical value. In this section, we investigate this regression problem with the help of Decision Tree and Random Forest algorithms, as they appear to provide best predictions in the classification case. The validation shows values of mean absolute error (MAE) of 1.96% for Decision Trees and 1.81% for Random Forests, which stand for the average absolute difference between the real impact (in percent) and its predicted value (also in percent). We can thus conclude that offline regression models are able to accurately predict the impact value and can thus be used to tune the sampling rate so as to reach a desired impact level.
V. ONLINE ANALYSIS
The previous section enabled us to assess the ability of machine learning to detect the presence of impact of sFlow on the application data plane and to estimate the amplitude of this impact. While the models constructed offline are efficient, there is no reason to believe they will be generic enough and applicable to all virtualized environments. To avoid generating a model per server offline, we study in this section whether these models can be produced online in an adaptive way. We explore this problem in this section and propose an approach to optimally set the sampling rate using the built model.
As algorithms belonging to the tree and forest families showed the best performance in the offline case, we rely on a particular decision tree algorithm called Hoeffding [19] to incrementally learn from instances coming one by one. Incre-mental Regression Hoeffding Tree is known for its efficiency in case of high-speed data streams. It is available in the multi-output streaming framework scikit-multiflow [20].
Building the model online requires the definition of a strategy for data acquisition to learn from. We will have to periodically collect several metrics, such as the traffic state when sampling is disabled, the throughput after sampling at some rate, the impact of this sampling rate on the throughput, and the number of VMs. Traffic state is available to measure at the switch ports. Sampling rate to test can be chosen randomly and configured on the switch interface by the administrator. After this sampling rate is configured, one can measure again the traffic at the ports of the switch and calculate the drop in throughput in comparison with the no sampling case. The number of VMs can be estimated from the traffic collected by sFlow, at least for active VMs. All this procedure provides an instance of features, that can be used to update the machine learning algorithm. When done, we reset the sampling rate to a value that is judged appropriate, then wait until the next measurement epoch, where again we disable sFlow sampling, measure traffic, sample at some random sampling rate, remea-sure traffic and number of VMs, and update the learner. We keep repeating this process until the model converges.
Traffic load in a virtual network is dynamic. Its variable nature has to be taken into account while building and val-idating our models and for optimally setting the sampling rate. To evaluate the performance of the online machine learning algorithm, we emulate the above procedure thanks to our offline dataset. We first split our initial set of 13,000 experiments into two sets: one used for learning (containing 80% of the instances) and one used for testing (the remaining 20%). At each measurement period, we provide to the learner a new measurement instance of the learning set and ask it to emit a prediction for all the experiments in the testing set.
We define two strategies for deciding the order in which experiments in the learning set are provided to the learner:
• A global strategy where the next experiment is chosen at random from the learning set. This mimics the case of a network with rapid traffic variations. Note that the sampling rate is chosen at random here.
• A local strategy where the next experiment is chosen at random in the neighborhood of the current experiment with respect to the number of VMs and traffic rate. For a given instance, the sampling rate to test is again chosen randomly. Contrary to the first strategy, this local strategy is supposed to mimic traffic with smooth fluctuations. Following these strategies, we manage to transform our dataset into a synthetic network workload to be used for build-ing and validatbuild-ing our models online. Within this synthetic workload, each instance corresponds to a scenario when virtual network is being under monitoring: at a given time there is a certain traffic condition on the server (some amount of VMs sending traffic with some input rate) and certain measurement condition (some sampling rate is turned on).
A. Predicting the drop in throughput
Fig. 7 presents mean absolute prediction errors for global random, local random and offline strategies as instances are being collected and learned from. The regression case is
Fig. 7: MAE of regression for online global & local & offline considered here where the objective is to predict the real value of the throughput reduction I (in percent). With the global random strategy, the learner initially provides predictions with high mean absolute errors and reaches 10% errors only after 1000 samples have been provided. The local random strategy leads to almost the same result at long run: about 1000 samples are needed to achieve less than 10% errors. However, the errors for the local random strategy are initially higher than the global one as, at the beginning, the model learns from a small set of similar traffic instances while it is asked to predict over diverse traffic samples, some of which it might have never seen before. Comparison with the offline model suggests that the learn-ing phase is golearn-ing to be very long if one wants a error in the order of a few percents between the online and the offline approaches. An alternative, less complex but opera-tionally meaningful approach is to ask the learner to provide a sampling rate such that the impact value stays below a predefined threshold. This is the question we investigate in the next section and check whether it can provide a faster convergence to the desired impact level.
B. Finding optimal monitoring parameters
We consider the same online learning algorithm as in the previous section, using again the local and global synthetic traces. The procedure is as follows: once a new instance is selected to train the online algorithm, the learner is asked to predict the optimal sampling rate corresponding to this new instance. The optimal sampling rate is defined as the maximum sampling rate allowing the impact on the traffic to be within some desired threshold thrI. The prediction is then compared
to the exact value of the optimal sampling rate computed by considering all the instances in the complete dataset with the same traffic conditions while scanning all known sampling rates. The procedure is repeated until exhaustion of all 13,000 instances (there is no training and validation sets here).
We present results using a threshold thrI of 7%, as results
are qualitatively similar for other thresholds. Fig. 8a and Fig. 8b report the results for the global and local synthetic workload respectively. The figures show the achieved impact when the optimal sampling rate is set (which should be less than, still close to, the desired impact thrI). In comparison
error was improving at slow pace over time, we observe here a faster convergence of the learner. Only a few tens of tests are needed to train the online model for the task of setting optimally the sampling rate and limiting its impact on traffic to the desired value. This is because the prediction complexity of the task is lower given the finite number of sampling rates that can be implemented in sFlow (1 out of n packets). We can further observe that the online learner performs better under the local than the global workload. This is because under the local workload the learner is asked a prediction for traffic conditions close to the ones it got trained with.
(a)
(b)
Fig. 8: Throughput drop at estimated optimal sampling rate: global workload (8a) and local workload (8b)
VI. CONCLUSION AND DISCUSSION
In this paper, we considered the application of machine learning algorithms to predict the impact of capturing packets with a tunable sampling rate, in virtual environments. We further use these algorithms to determine the best performing measurement parameters. As each network features its own traffic profile, we considered the case where the training phase has to be done online. We also considered the offline case where the learner is fed at once with a large set of instances that correspond to a wide range of traffic and sampling con-ditions. The evaluations were performed with a large dataset of traces obtained in a controlled environment. The results obtained suggest that our machine learning-based solution is able to predict the impact of virtual network monitoring, as well as optimal monitoring parameters w.r.t the impact of measuring the network.
Our model now requires tests in the wild, which will bring up several issues; those can become further steps for future work. During their lifetime, networks usually experience re-peated traffic variations. If the training phase entails a complex procedure, e.g., turning sampling on at different values in a
regular manner, it can be interesting to collect data for training only when this is relevant. Further, the model we obtained from the observation of the network would later suffer from aging. We will investigate solutions based on periodical model retraining to keep our model up to date.
ACKNOWLEDGMENT
This work has been supported by the French government, through the EUR DS4H Investments in the Future project managed by the National Research Agency (ANR) with the reference number ANR-17-EURE-0004.
REFERENCES
[1] P. Phaal et al., “Inmon corporation’s sflow: A method for monitoring traffic in switched and routed networks,” Tech. Rep., 2001.
[2] Open vSwitch - Production Quality, Multilayer Open Virtual Switch. [Online]. Available: https://www.openvswitch.org/
[3] A. Roy, H. Zeng, J. Bagga, G. Porter, and A. C. Snoeren, “Inside the social network’s (datacenter) network,” Computer Communication Review, vol. 45, no. 5, 2015.
[4] K. Gogunska, C. Barakat, G. Urvoy-Keller, and D. Lopez-Pacheco, “On the cost of measuring traffic in a virtualized environment,” in IEEE CloudNet, 2018.
[5] P.-W. Tsai, C.-W. Tsai, C.-W. Hsu, and C.-S. Yang, “Network monitoring in software-defined networking: A review,” IEEE Systems Journal, no. 99, 2018.
[6] A. Shatnawi, M. Orr`u, M. Mobilio, O. Riganelli, and L. Mariani, “Cloudhealth: a model-driven approach to watch the health of cloud services,” in IEEE/ACM 1st international workshop on Software Health (SoHeal), 2018.
[7] D. R. Teixeira, J. M. C. Silva, and S. R. Lima, “Deploying time-based sampling techniques in software-defined networking,” in IEEE SoftCOM, 2018.
[8] J. Suh, T. T. Kwon, C. Dixon, W. Felter, and J. Carter, “Opensample: A low-latency, sampling-based measurement platform for commodity sdn,” in IEEE ICDCS, 2014.
[9] A. Mestres, A. Rodriguez-Natal, J. Carner, P. Barlet-Ros, Alarc´on et al., “Knowledge-defined networking,” ACM SIGCOMM Computer Communication Review, 2017.
[10] A. Gulenko, M. Wallschl¨ager, F. Schmidt, O. Kao, and F. Liu, “Evalu-ating machine learning algorithms for anomaly detection in clouds,” in IEEE Big Data, 2016.
[11] C. Sauvanaud, K. Lazri, M. Kaˆaniche, and K. Kanoun, “Towards black-box anomaly detection in virtual network functions,” in IEEE/IFIP DSN-W, 2016.
[12] Z. M. Fadlullah, F. Tang, B. Mao, N. Kato, O. Akashi, T. Inoue, and K. Mizutani, “State-of-the-art deep learning: Evolving machine intel-ligence toward tomorrows intelligent network traffic control systems,” IEEE Communications Surveys & Tutorials, vol. 19, no. 4, 2017. [13] B. Li, M. H. Gunes, G. Bebis, and J. Springer, “A supervised machine
learning approach to classify host roles on line using sflow,” in Workshop on High performance and programmable networking, 2013.
[14] S. R. Chowdhury, M. F. Bari, R. Ahmed, and R. Boutaba, “Payless: A low cost network monitoring framework for software defined networks,” in IEEE NOMS, 2014.
[15] O. Alipourfard, M. Moshref, Y. Zhou et al., “A comparison of per-formance and accuracy of measurement algorithms in software,” in Symposium on SDN Research, 2018.
[16] V. Mann, A. Vishnoi, and S. Bidkar, “Living on the edge: Monitoring network flows at the edge in cloud data centers,” in IEEE COMSNETS, 2013.
[17] F. Pedregosa, G. Varoquaux, A. Gramfort, V. Michel, Thirion et al., “Scikit-learn: Machine learning in Python,” Journal of Machine Learn-ing Research, 2011.
[18] iPerf - The ultimate speed test tool for TCP, UDP and SCTP. [Online]. Available: https://iperf.fr/
[19] P. Domingos and G. Hulten, “Mining high-speed data streams,” in KDD, vol. 2, 2000.
[20] J. Montiel, J. Read, A. Bifet, and T. Abdessalem, “Scikit-multiflow: a multi-output streaming framework,” The Journal of Machine Learning Research, vol. 19, no. 1, 2018.