HAL Id: cea-02434033
https://hal-cea.archives-ouvertes.fr/cea-02434033
Submitted on 9 Jan 2020HAL is a multi-disciplinary open access archive for the deposit and dissemination of sci-entific research documents, whether they are pub-lished or not. The documents may come from teaching and research institutions in France or abroad, or from public or private research centers.
L’archive ouverte pluridisciplinaire HAL, est destinée au dépôt et à la diffusion de documents scientifiques de niveau recherche, publiés ou non, émanant des établissements d’enseignement et de recherche français ou étrangers, des laboratoires publics ou privés.
Prediction of the cyclic behavior of 316ln stainless steel
at room temperature by a dislocation-based cyclic
viscoplastic model
D. Goncalves, M. Sauzay, P. Lamagnere
To cite this version:
D. Goncalves, M. Sauzay, P. Lamagnere. Prediction of the cyclic behavior of 316ln stainless steel at room temperature by a dislocation-based cyclic viscoplastic model. LCF8- Eighth International Conference on Low cycle fatigue, Jun 2017, Dresden, Germany. �cea-02434033�
PREDICTION OF THE CYCLIC BEHAVIOR OF 316LN STAINLESS STEEL AT ROOM TEMPERATURE BY A DISLOCATION-BASED CYCLIC VISCOPLASTIC MODEL
D. Gonçalves1, 2, M. Sauzay 3, P. Lamagnere1
1)
CEA-Cadarache, DEN/DER/SESI/LCOS, 13108 St Paul-Lez-Durance, France
2)
Université Pierre et Marie Curie, 75005, Paris, France
3)
CEA-Saclay, DEN/DMN/SRMA/LC2M, Université Paris-Saclay, 91191 Gif-sur-Yvette, France
ABSTRACT
A polycrystalline dislocation-based cyclic viscoplastic model is proposed to predict the cyclic behaviour of 316LN austenitic stainless steels at room temperature (RT). The evolution laws of the densities of different populations of dislocations are described, by taking into account physical mechanisms of crystal viscoplasticity. The comparison between the predictions and corresponding experimental results shows that the cyclic behaviour of 316LN stainless steel is reasonably well described. Notably, a reduced number of adjusted crystal viscoplasticity parameters is used and only tensile and relaxation curves are used in the adjustment procedure.
KEYWORDS
Dislocation density, polycrystal, elasto-viscoplasticity, cyclic behaviour, ratcheting, 316LN stainless steel
INTRODUCTION
Many experimental studies have been carried out in order to understand the cyclic behaviour of the polycrystalline 316LN austenitic stainless steel, largely used in nuclear power plants. The first studies have mainly characterized the macroscopic behaviour under different loading conditions, allowing the development and application of different phenomenological models, reviewed in [1,2].
From observations made by many authors, different micromechanical models have been proposed for the prediction of the 316LN stainless steel [3–5]. Despite the fact that these models better describe the deformation process by taking into account some of the physical mechanisms of deformation, they usually require the adjustment of numerous parameters, involving experimental cyclic test in the adjustment process.
The aim of this work is to apply a micro-mechanical modelling to predict the cyclic behaviour (fatigue and ratcheting) of 316LN stainless steel at RT with a number of adjustable parameters as low as possible. At the crystal scale, the constitutive laws describe the evolution of the densities of the different populations of dislocations. A self-consistent localization rule is used to compute the homogenized stress-strain curves. This self-consistent mean-field homogenization rule has been validated with respect to numerous full-field finite-elements results in the considered range of plastic strain amplitude [6]. The response of the proposed model is compared to experimental data, taken from Gaudin [3] and Gentet [7].
DISLOCATION-BASED CONSTITUTIVE MODEL
The dominant mechanism of plastic deformation is mainly dislocation glide along active slip systems. For a FCC structure, the dense {111} planes and the dense <110> directions allow the definition of the twelve easy slip systems. The resolved shear stress, 𝜏𝑖, result from the projection of the local stress tensor, 𝜎, on slip system i.
𝜏𝑖= 𝜎: (m𝑖 ⨂ n𝑖) Equation 1
In Equation 1, m𝑖 is the unit slip direction vector and n𝑖 the unit normal vector to the slip
plane. Dislocation glide occurs only as the resolved shear stress (𝜏𝑖) on the slip system, i, reaches a critical stress value (𝜏𝑐,𝑖). The critical resolved shear stress is computed using all the dislocation densities in all slip systems (j), including (i) itself [8,9]:
𝜏𝑐,𝑖= 𝜇𝑏√∑ ℎ𝑖𝑗𝜌𝑗 12
𝑗=1
Equation 2
𝜇 is the elastic shear modulus, b is the length of the Burgers vector and ℎ𝑖𝑗 is a 12x12 interaction matrix, that represents the strength of the interaction between the slip systems (i) and (j). According to the theory of thermally activated processes [10], non-zero viscoplastic slip rate on slip system (i) requires a positive effective stress, 𝜏𝑖∗:
𝜏𝑖∗= |𝜏𝑖| − 𝜏𝑐,𝑖 Equation 3
The viscoplastic slip rate (𝛾̇𝑖𝑝) is expressed in Equation 4 and Equation 5, for edge and screw dislocation segments, defined by the subscript letter e and s, respectively. These expressions reflect the correlation between the plastic slip rate on a slip system (i), and the effective stress,𝜏𝑖∗ [11]. In these equations T denotes the temperature, V the activation volume, Q the activation energy, 𝜅𝑏 the Boltzmann constant and 𝑣𝐷 the Debye frequency.
𝛾̇𝑖,𝑒𝑝 = 2𝑣𝐷𝑏2𝜌𝑒𝑖∙ 𝑒𝑥𝑝 (− 𝑄 𝜅𝑏𝑇) ∙ 𝑠𝑖𝑛ℎ ( 𝑉𝜏𝑖∗ 𝜅𝑏𝑇) Equation 4 𝛾̇𝑖,𝑠𝑝 = 2𝑣𝐷𝑏2𝜌𝑠𝑖∙ 𝑒𝑥𝑝 (−𝜅𝑄 𝑏𝑇) ∙ 𝑠𝑖𝑛ℎ ( 𝑉𝜏𝑖∗ 𝜅𝑏𝑇) Equation 5
For each slip system, three families of dislocations are considered: edge dislocations, 𝜌𝑒𝑖, screw dislocations, 𝜌𝑠𝑖, and dipole dislocations, 𝜌𝑑𝑖. The evolution laws of the densities of each family are associated with the mechanisms observed experimentally [9,11–13].
Equation 6 and Equation 7 provide the expressions of the edge and screw dislocation density rates, respectively. The evolution of both is defined by a first production term, describing the multiplication mechanisms, and a second one, representing the annihilation mechanisms. In addition, a third term is introduced in the edge dislocation density evolution law, representing the formation of dipoles. Equation 8 provides the expression of the dipole density rate, composed by one term of production and one of annihilation.
𝜌̇𝑒𝑖 = 2 𝑏𝐿∙ |𝛾̇𝑠𝑖| ∙ 𝑠𝑖𝑔𝑛 ( 𝛾̇𝑠𝑖 𝛾𝑠𝑖) − 2𝑦𝑒 𝑏 ∙ 𝜌𝑒𝑖∙ |𝛾̇𝑒𝑖| − 2𝜌𝑒𝑖∙ ℎ𝑚𝑎𝑥− 𝑦𝑒 𝑏 ∙ |𝛾̇𝑒𝑖| Equation 6 𝜌̇𝑠𝑖= 2 𝑏𝐿∙ |𝛾̇𝑒𝑖| ∙ 𝑠𝑖𝑔𝑛 ( 𝛾̇𝑒𝑖 𝛾𝑒𝑖) − 2𝑦𝑠 𝑏 ∙ 𝜌𝑠𝑖∙ |𝛾̇𝑠𝑖| Equation 7 𝜌̇𝑑𝑖 = 2𝜌𝑒𝑖∙ℎ𝑚𝑎𝑥𝑏−𝑦𝑒∙ |𝛾̇𝑒𝑖| −2𝑦𝑏𝑒∙ 𝜌𝑑𝑖 ∙ |𝛾̇𝑒𝑖| Equation 8
The maximum distances of annihilation of edge and screw dislocations are denoted as ye
and ys, respectively. The maximum dipole height, hmax, and the mean-free path of a mobile
dislocation, L, are expressed by:
𝐿 = min (𝜙,√(𝜌 𝜅
𝑒+𝜌𝑠+𝜌𝑑)) and ℎ𝑚𝑎𝑥
𝑖 = 𝜇𝑏
where 𝜙 is the mean grain size, 𝜅 is a production parameter (free-mean path of mobile dislocations) defined for different crystal orientations, as explained in the following, and 𝜈 is the Poisson ratio.
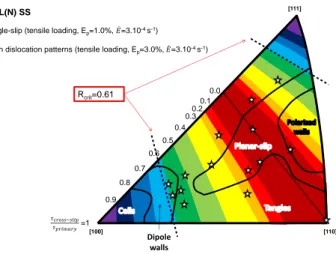
Since the crystal orientation affects the deformation behaviour [14], two families of crystals are considered in this work. The first family assembles the crystals oriented for single slip, located in the central part of the standard triangle and in the [110] corner. The second family gathers the crystals oriented for extended multiple slip, located near the [100] and [111] corners of the standard triangle. The partitioning between the two families is carried out by using a critical value (Rcrit) of the ratio between the cross-slip resolved shear stress and the
primary one (Figure 1). That is a straightaway for reproducing more simply the density evolution laws proposed by Kubin et al. [9]. By taken experimental tensile curves of copper single crystals [15,16] and TEM observations of FCC metals/alloys [3,17,18], the critical ratio value has been determined as Rcrit=0.61.
Figure 1. Iso-values of the ratio between |𝜏𝑐𝑟𝑜𝑠𝑠 𝑠𝑙𝑖𝑝/𝜏𝑝𝑟𝑖𝑚𝑎𝑟𝑦| plotted in the standard crystallographic triangle. The indicated
dislocation patterns, observed by TEM for a 316LN stainless steel alloy, are taken from [3].
The criterion |τcross slip/τprimary| < 𝑅𝑐𝑟𝑖𝑡 is used define the free-mean parameter for each grain
orientation (𝜅𝑠𝑖𝑛𝑔𝑙𝑒and 𝜅𝑚𝑢𝑙𝑡𝑖) and also to delay the activation of multiple slip systems in the crystals oriented for single slip. For this, a higher value of latent hardening coefficient (ℎ𝑖𝑗= ℎ𝑙𝑎𝑡𝑒𝑛𝑡𝑠𝑖𝑛𝑔𝑙𝑒) (Equation 2) is considered. For the crystals oriented for multiple slip, the interaction coefficients are the ones computed by dislocation dynamics [9].
Finally, the self-consistent rule proposed by Kröner [15] is applied in order to link the local behaviour (grain scale) with the overall material behaviour (polycrystal scale). In previous work [6], its predictions were compared with the FE ones. A fair agreement was found for different stress-sensitivity and under different loading conditions. This corresponding localization rule can be written by:
𝜎̇ = Σ̇ + 2𝜇(1 − 𝛽) (𝐸̇𝑖𝑛− 𝜖̇𝑖𝑛) with 𝛽 = 2(4−5𝜈)
15(1−𝜈) Equation 10 where 𝜎̇ and 𝜖̇𝑖𝑛 are the average grain stress and inelastic strain rates tensors and Σ̇ and 𝐸̇𝑖𝑛 are their average at the polycrystal scale.
IDENTIFICATION OF THE PARAMETER AND PHYSICAL CONSTANTS
A random crystal distribution in an aggregate of grains is considered, allowing an overall isotropic behaviour. The calculations are carried out using the SiDoLo software [19]. The polycrystalline aggregate is composed by 100 grains. Table 1 summarizes the physical
0.1 0.4 0.5 0.30.2 0.7 0.6 0.0 0.8 =1 [100] [110] [111] Rcrit=0.61 0.9 Single-slip (tensile loading, Ep=1.0%, =3.10-4 s-1)
Main dislocation patterns (tensile loading, Ep=3.0%, =3.10-4 s-1)
316L(N) SS
Dipole walls
constants and material parameters, determined experimentally or by dislocation dynamics (DD) simulations. The reference of each parameter measurement is also indicated.
The material parameters related to the thermally activated mechanisms (activation volume, V, and activation energy, Q) are the only parameters identified from experimental results, by inverse identification. The adjustment is made by using stress relaxation data at RT and tensile tests at different temperatures (RT, 373K and 473K) but at the same strain rate. The adjustment of these are V=100b³ and Q=1.48 eV. The calculated curves using these viscoplastic parameters are compared with experimental data in Figure 2.
Parameter Value Ref.
𝜅𝑏 Boltzmann constant 1.38 10-23 J.K-1 [10] Cst.
𝑣𝐷 Debye frequency 1013 s-1 [10] Cst.
𝐸 Young’s modulus 195000 MPa [3] Exp.
𝑣 Poisson’s ratio 0.3 [3] Exp.
𝑏 Burgers vector magnitude (FCC material) 2.56 10-10 m [10] Exp.
𝑦𝑒 Annihilation distance of edge dislocations 1.2 10-9 m [3] Exp.
𝑦𝑠 Annihilation distance of screw dislocations 15 10-9 m [3] Exp.
𝜅𝑠𝑖𝑛𝑔𝑙𝑒 Free-mean path parameter for single slip crystals 300 [20] Exp.
𝜅𝑚𝑢𝑙𝑡𝑖 Free-mean path parameter for multiple slip crystals 30 [20] Exp.
𝑅𝑐𝑟𝑖𝑡 Critical ratio 0.61 [20] Exp.
𝜙 Grain size 50 10-6 m [3] Exp.
ℎ0 Self-interactions 0.122 [9] DD ℎ𝑐𝑜𝑝𝑙𝑎 Coplanar interactions 0.122 [9] DD ℎ𝐿𝑜𝑚𝑒𝑟 Lomer–Cottrell lock 0.122 [9] DD ℎ𝐻𝑖𝑟𝑡ℎ Hirth lock 0.070 [9] DD ℎ𝑔𝑙𝑖𝑠 Glissile junction 0.137 [9] DD ℎ𝑐𝑜𝑙𝑙 Collinear interactions 0.625 [9] DD
V Activation volume 100b³ Adj.
Q Activation energy 1.48 e.V. Adj.
ℎ𝑠𝑖𝑛𝑔𝑙𝑒 Latent hardening coefficient for single slip grain 0.625
Table 1. List of constants and parameters and for all considered groups of grains. Cst.: physical constants; Exp.: experimental data; DD: dislocation dynamics simulations; Adj.: adjustment using only tensile and relaxation experimental curves.
(a) (b)
Figure 2. Crystal viscoplasticity adjustment (Q and V, Table 1): comparison between experimental and computed curves. (a) Relaxation curve expressed in inelastic strain rate in function of stress for the 316LN, at RT. (b) Tensile curves at different
temperatures. Experimental data are taken from [3].
PREDICTIONS AND DISCUSSIONS
Uniaxial strain-controlled cyclic loading at different temperatures are fist simulated using 𝐸 ± 0.575% and 𝐸̇ = 3.10−4𝑠−1 (Figure 3). The predicted curves are in fair agreement with
0 50 100 150 200 250 300 350 400 450 500 0 0.02 0.04 0.06 0.08 0.1 S tr es s (M P a) Strain Simulation - T=293K Experimental - T=293K Simulation - T=373K Experimental -T=373K Simulation - T=473K Experimental -T=473K 316LN SS dE/dt=3.10-4s-1 -8.0 -7.5 -7.0 -6.5 -6.0 -5.5 -5.0 -4.5 -4.0 -3.5 -3.0 170 190 210 230 250 log 10 (dE in/dt ) Stress (MPa) Simulation Experimental 316LN SS T=293K E=1.2 10-3
the experimental data for the first 50 cycles. At this point, slight softening is observed experimentally, while cyclic hardening is still predicted by the model. Since the model is not able to reproduce cyclic softening, the stress amplitude is slightly overestimated after 100 cycles. Some additional physical mechanisms should be considered for predicting that slight softening.
The shape of the first loop is also well predicted. But a difference between the experimental and the simulated reverse yield point is observed. This difference is assigned to the calculation of the kinematic stress. The kinematic stress can be defined by the addition of two components: an intragranular kinematic stress, characterizing the heterogeneous dislocations distribution inside the grains, and an intergranular kinematic stress, representing the incompatibilities between grains [21]. In this work, the mechanisms of multiplication, annihilation and interaction between dislocations are described, but not the evolution of dislocations patterns during the cyclic loading. An improvement of the model is envisioned to introduce an intragranular kinematic stress law, based on the prediction of dislocations patterns.
(a) (b)
Figure 3. 1st loop (a) and stress amplitude evolution (b) for the 316LN stainless steel tested under uniaxial plastic strain-controlled cyclic loading, with 𝐸 = ±0.575% and 𝐸̇ = 3.10−4𝑠−1. Experimental data are taken from [7].
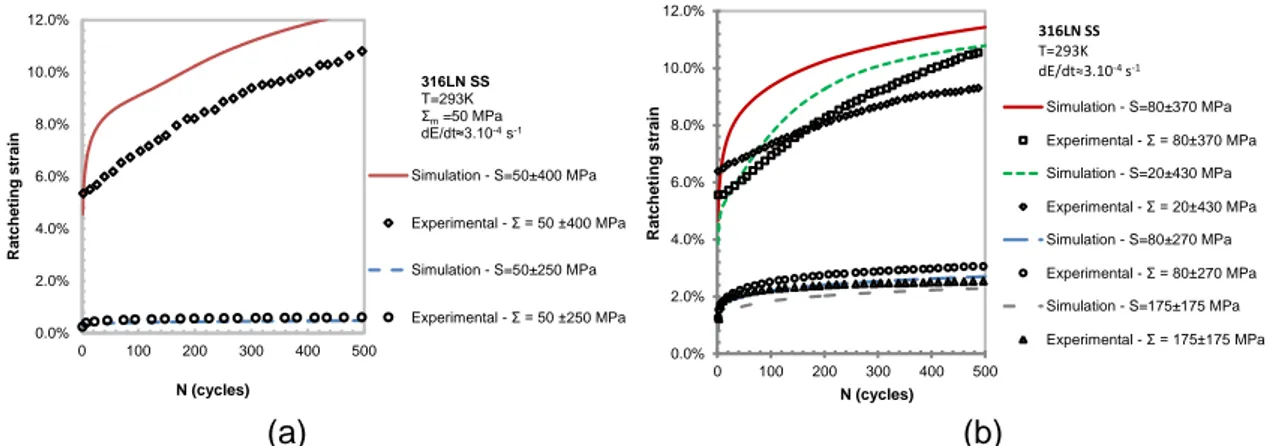
Under asymmetrical stress cycling, one observes a cyclic accumulation of strain, namely
ratcheting. The ratcheting strain is defined in this work as the mean plastic strain at each
cycle. In Figure 4, the predicted ratcheting strain is compared to experimental data [3].
(a) (b)
Figure 4. Ratcheting strain for the 316LN stainless steel. (a) Σm=50 MPa and different stress amplitudes (Σamp); (b) Σmax=350
MPa and Σmax=450 MPa, and different mean stresses. Experimental data are taken from [3].
Firstly, the same mean stress (Σm=50 MPa) is applied, for different stress amplitudes (Σamp)
(Figure 4a). The behaviour is fair well predicted for the lower stress amplitude, but the ratcheting strain is overestimated for the highest value of Σamp. Then, the ratcheting
-400 -300 -200 -100 0 100 200 300 400 -0.70% -0.35% 0.00% 0.35% 0.70% S tr es s (M P a) Strain Simulation - T=293K Experimental - T=293K 316LN SS 1stcycle, T=293K E = 0.575%, dE/dt=3.10-4s-1 0 50 100 150 200 250 300 350 400 450 0 50 100 150 S tr e s s a mplitu de (M P a ) N. Cycles Simulation - T=293K Experimental - T=293K Simulation - T=323K Experimental - T=323K Simulation - T=473K Experimental - T=473K 316LN SS E =±0.575%, dE/dt=3.10-4s-1 0.0% 2.0% 4.0% 6.0% 8.0% 10.0% 12.0% 0 100 200 300 400 500 Simulation - S=50±400 MPa Experimental -Σ = 50 400 MPa Simulation - S=50±250 MPa Experimental -Σ = 50 250 MPa R atcheti ng str ai n N (cycles) 316LN SS T=293K Σm=50 MPa dE/dt≈3.10-4s-1 0.0% 2.0% 4.0% 6.0% 8.0% 10.0% 12.0% 0 100 200 300 400 500 Simulation - S=80±370 MPa Experimental -Σ = 80 370 MPa Simulation - S=20±430 MPa Experimental -Σ = 20 430 MPa Simulation - S=80±270 MPa Experimental -Σ = 80 270 MPa Simulation - S=175±175 MPa Experimental -Σ = 175 175 MPa N (cycles) R atche ti ng str ain 316LN SS T=293K dE/dt≈3.10-4s-1
behaviour is assessed for maximum stresses (Σmax) of 350 MPa and 450 MPa, with different
mean stresses (Figure 4b). The ratcheting behaviour is better described for a low maximum stress (Σmax=350 MPa). For both mean stresses, the ratcheting strain is slightly
underestimated, but the ratcheting evolution is fairly well described. In the case of the highest maximum stress (Σmax=450 MPa), the model tends to overestimate the ratcheting strain after
a few cycles. The ratcheting strain increases more quickly than observed experimentally during the first cycles, resulting in a different shape of the ratcheting strain evolution curve. Although the behaviour is fairly well predicted, the model could result in a better description of the ratcheting strain by improving the reverse yield point simulation.
Conclusions
A dislocation-based viscoplasticity model to predict the cyclic behaviour of 316LN stainless steels at room temperature was presented. Experimental tensile and relaxation curves of a 316LN stainless steel were considered for the adjustment of the two viscoplasticity parameters. The proposed model provided rather fair predictions of the fatigue and ratcheting behaviours, comparing with the experimental data. Notwithstanding, some improvements should be made in order to better predict the behaviour of the material (i.e. softening behaviour, intragranular kinematic stress description). For future work, the model will be upgraded to take into account the physical mechanisms of cyclic deformation at higher temperatures (T>723K), wherein the dynamical strain ageing (DSA) plays an important role in the glide of dislocations and the cyclic behaviour.
Acknowledgements
The authors gratefully acknowledge the support of the CEA research project MASNA related to the Generation IV reactor Astrid.
REFERENCES
[1] J.L. Chaboche. Int. J. Plast. 24 (2008) 1642–1693.
[2] G. Kang. Int. J. Fatigue. 30 (2008) 1448–1472.
[3] C. Gaudin. PhD dissertation. Université de Technologie Compiègne, 2002.
[4] D. Abdeljaoued, I. Ben Naceur, K. Saï, G. Cailletaud. Mech. Res. Commun. 36 (2009) 309–315.
[5] Y. Dong, G. Kang, C. Yu. Comput. Mater. Sci. 91 (2014) 75–82.
[6] D. Goncalves, M. Sauzay, P. Lamagnere. Submitted. (2017).
[7] D. Gentet. PhD dissertation. Université de la Rochelle, 2010.
[8] P. Franciosi, M. Berveiller, A. Zaoui. Acta Metall. 28 (1980) 273–283.
[9] L. Kubin, B. Devincre, T. Hoc. Acta Mater. 56 (2008) 6040–6049.
[10] D. Caillard, J. Martin. Pergamon Materials Series, 2003.
[11] M.F. Giordana, P.-F. Giroux, I. Alvarez-Armas, M. Sauzay, A. Armas, T. Kruml. Mater. Sci. Eng. A. 550 (2012) 103–111.
[12] K. Differt, U. Essmann. Mater. Sci. Eng. A. 164 (1993) 295–299.
[13] U. Essmann, H. Mughrabi. Philos. Mag. Phys. Condens. Matter Struct. Defects Mech. Prop. 40 (1979) 731–756.
[14] M. Sauzay, L.P. Kubin. Prog. Mater. Sci. 56 (2011) 725–784. [15] T. Takeuchi. J. Phys. Soc. Jpn. 41 (1976) 490–495.
[16] T. Takeuchi. J. Phys. Soc. Jpn. 40 (1976) 741–746. [17] X. Huang, N. Hansen.Scr. Mater. 37 (1997) 1–7.
[18] N. Hansen, X. Huang. Acta Mater. 46 (1998) 1827–1836.
[19] P. Pilvin, SIDOLO, notice d’utilisation. Université de Bretagne-Sud, (2003).
[20] F. Rachdi. PhD dissertation. Université Pierre et Marie Curie - Paris VI, 2015.
[21] X. Feaugas. Acta Mater. 47 (1999) 3617–3632. Corresponding author: diogo.goncalves@cea.fr