HAL Id: hal-00384580
https://hal.archives-ouvertes.fr/hal-00384580
Submitted on 11 Apr 2016
HAL is a multi-disciplinary open access
archive for the deposit and dissemination of
sci-entific research documents, whether they are
pub-lished or not. The documents may come from
teaching and research institutions in France or
abroad, or from public or private research centers.
L’archive ouverte pluridisciplinaire HAL, est
destinée au dépôt et à la diffusion de documents
scientifiques de niveau recherche, publiés ou non,
émanant des établissements d’enseignement et de
recherche français ou étrangers, des laboratoires
publics ou privés.
Near-field interactions between a subwavelength tip and
a small-volume photonic-crystal nanocavity
L. Lalouat, B. Cluzel, P. Velha, E. Picard, D. Peyrade, Jean-Paul Hugonin,
Philippe Lalanne, E. Hadji, F. de Fornel
To cite this version:
L. Lalouat, B. Cluzel, P. Velha, E. Picard, D. Peyrade, et al.. Near-field interactions between a
subwavelength tip and a small-volume photonic-crystal nanocavity. Physical Review B: Condensed
Matter and Materials Physics (1998-2015), American Physical Society, 2007, 76 (4), pp.041102.
�10.1103/PhysRevB.76.041102�. �hal-00384580�
Near-field interactions between a subwavelength tip and a small-volume
photonic-crystal nanocavity
L. Lalouat,1B. Cluzel,1,2P. Velha,2,3,4E. Picard,2D. Peyrade,4J. P. Hugonin,3P. Lalanne,3E. Hadji,2and F. de Fornel1
1Groupe d’Optique de Champ Proche-Institut Carnot de Bourgogne, UMR CNRS 5209, 9 av. Alain Savary, F-21078, DIJON, France 2SiNaPS-MINATEC, CEA Grenoble, 17 rue des Martyrs, F-38054 GRENOBLE, France
3Laboratoire Charles Fabry de l’Institut d’Optique, CNRS, Univ Paris-Sud, Campus Polytechnique, RD 128, 91127 Palaiseau Cedex, France
4LTM, CNRS, 17 rue des Martyrs, F-38054 GRENOBLE, France
共Received 3 June 2007; published 6 July 2007兲
The fundamentals of the near-field interaction between a subwavelength metallic tip and a photonic-crystal nanocavity are investigated experimentally and theoretically. It is shown experimentally that the cavity reso-nance is tuned without any degradation by the presence of the tip and that the reported near-field interaction is strongly related to the field distribution within the nanostructure. Then, in light of a perturbation theory, we show that this interaction is selectively related to the electric field or magnetic field distribution within the cavity, depending on the tip properties.
DOI:10.1103/PhysRevB.76.041102 PACS number共s兲: 42.70.Qs, 42.50.Pq, 42.55.Sa, 42.82.⫺m
Recent studies have demonstrated the ability of scanning near-field optical microscopy 共SNOM兲 techniques to evi-dence, below the diffraction limit, interactions between light and photonic crystals共PCs兲 such as coupling between spon-taneous emission of quantum and the optical modes of a microcavity,1 existence of ultraslow light propagation in a
photonic crystal waveguide,2 observation of Bloch
harmonics3and Bloch mode parity change in photonic crys-tal waveguides,4as well as field confinement inside photonic
crystal microcavities.5,6 In all these previous works, the
probe was not supposed to modify the observed system. However, it has been recently observed7–9that the
nanomet-ric tip could also be a means to change the microcavity op-tical properties. If, in such cases, the interaction between the near-field probe and the microcavity prevents one from a direct visualization of the electromagnetic field, it also opens the way to an exciting challenge: Using near-field probes to manipulate the light in solid-state resonators. However, to reach this objective, one needs to to bring the near-field probe in the vicinity of the resonator without introducing considerable scattering or absorption losses. Thus far, except for the theoretical predictions by Koenderink et al., such a result has never been achieved experimentally: A drastic deg-radation of the resonator quality factor共Q兲 has been system-atically reported as the tip was penetrating the cavity near-field.8,9
In this work, we experimentally demonstrate that a sub-wavelength sized metallic tip permits one to tune the reso-nance of an ultralow volume photonic crystal nanocavity without sacrificing its Q factor. We also present an innova-tive mapping method, which allows us to track, at the sub-wavelength scale, the near-field interactions between the tip and the nanocavity. A quantitative interpretation of these in-teraction maps is then achieved through three-dimensional 共3D兲 computational results associated with a perturbation theory.
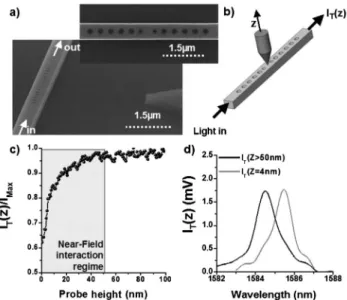
Scanning electron microscope views of the nanocavity considered in this work are shown in Fig. 1共a兲. The cavity consists in a Fabry-Pérot–like resonator,10,11 composed of
two mirrors. The nanocavity and its waveguide were realized by electron-beam lithography and inductive-coupled-plasma etching on a silicon-on-insulator substrate, having a 0.38-m-thick silicon film and a 2-m-thick buried oxide layer. Each mirror is formed by a periodic row of five air holes with a 180-nm diameter and a 370-nm periodicity, ter-minated by a single hole having a 140-nm-diameter at 326 nm from the periodic mirror. The cavity formed by the association of the two mirrors is 248 nm long.
In the following experiments, we use an end-fire setup to measure the cavity transmission. Light injection from a TE-polarized tunable laser source and output light collection onto an InGaAs detector are performed by using microscope objectives and monomode polarization-maintaining optical
FIG. 1. 共a兲 Scanning electron microscope views of the silicon-on-insulator photonic crystal nanocavity.共b兲 Schematic of the ex-periment.共c兲 Cavity transmittance ITas a function of the tip height 共z兲 above the center of the cavity. The input wavelength is set to the cavity resonance wavelength.共d兲 Cavity transmittance spectra for two different tip cavity distances, z = 4 nm and z⬎50 nm.
fibers. While accurately keeping these alignments, a sub-wavelength sized probe12consisting of a dielectric tip coated by a metallic Cr-Au bilayer film is approached in the vicinity of the cavity. The tip possesses an apex diameter of 50 nm and is mounted on a SNOM. Thanks to a shear-force feed-back, the tip is maintained at a fixed distance 共z=4 nm兲 above the cavity, while piezoelectric scanners drive the lat-eral tip displacement.
We first identified the cavity resonance at 1584.6 nm 共with a Q factor equal to 1200兲 over the 400-nm-wide pho-tonic band gap of the mirrors. Next, the input laser wave-length is set to this cavity resonance and, as shown on Fig. 1共b兲, the tip scans the z axis for distances ranging from 4 to 100 nm above the cavity while recording the cavity transmittance IT共z兲 at the same time. The transmittance is
then normalized to the cavity peak transmittance in absence of the tip共Imax兲. This measurement is plotted in Fig.1共c兲. For z⬎50 nm, the transmitted signal remains constant and equal to Imax. For z⬍50 nm, the signal exponentially drops as the
tip approaches the cavity surface. Such an exponential decay is characteristic of the near-field interaction between the tip and the evanescent field of the cavity mode.
Using the SNOM, the tip is then placed above the cavity at several lateral positions 共x,y兲 above the cavity and, for each position, we set successively the tip-cavity distance to z⬎50 nm and z=4 nm. For each tip-cavity distance 共z兲, we recorded the corresponding cavity transmittance spectrum. In any case, as shown in Fig.1共d兲, for z⬎50 nm, i.e., out of the optical near-field of the cavity, the resonance wavelength re-mains similar to that measured in the absence of the tip. For z = 4 nm, we clearly observed that the presence of the tip induces a redshift of the cavity resonance wavelength in a range strongly dependent on the tip lateral position. As shown in Fig.1共d兲, the maximum redshift is measured to be 0.9 nm. Remarkably and in contrast to the previous works that use an AFM probe,8,9 we never observed any
degrada-tion of the cavity Q factor or of its peak transmittance, even in the case of the strongest recorded interaction. This result confirms the theoretical prediction of Koenderink et al. We believe that our nanometric-size tip operates in a weaker in-teraction than the AFM probes, allowing us to achieve the cavity tuning without Q-factor and peak-transmittance deg-radation. This assumption is confirmed by the lowest redshift values obtained in this work共0.9 nm at maximum兲 compared to those obtained with an AFM probe共⬃2.3 nm兲.
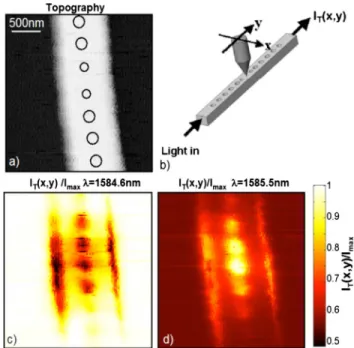
Then, to investigate the effect of the tip lateral position 共x,y兲 above the cavity on the reported near-field interaction, we measured the cavity transmittance at the resonance wave-length as a function of the tip position in the 共x,y兲 plane above the sample, while maintaining the tip-cavity distance at z = 4 nm. We further refer to that procedure as an “interaction-scanning mode.” Figure2共b兲shows IT共x,y兲/Imax
as a function of the共x,y兲 tip position for two different wave-lengths. The first one 共=1584.6 nm兲 corresponds to the cavity resonance wavelength without interaction with the tip, r共z⬎50 nm兲, and the second one 共=1585.5 nm兲
corre-sponds to the cavity resonance wavelength modified by the presence of the tip. In Fig. 2共a兲, the topographical picture recorded at the same time as the interaction maps presented in Figs.2共c兲and2共d兲is also shown.
The interaction map clearly shows that when the tip is scanning far away from the cavity center, the transmittance is unaffected because the tip does not interact with the cavity mode. As the tip is approached near to the cavity center, the transmittance progressively decreases关see Fig.2共c兲兴 while it increases at =1585.5 nm 关see Fig. 2共d兲兴. Indeed, a rapid glance at the two pictures evidences that they are fully complementary. As the tip induces a redshift of the reso-nance, the cavity transmission IT共x,y兲 decreases at
1584.6 nm while it increases at 1585.5 nm in the same pro-portions: The maximum transmittance attenuation共increase兲 measured on Fig. 2共c兲 关Fig. 2共d兲兴 is found to −3 dB 共+3 dB兲. This confirms that, for each position of the tip above the cavity, the peak transmittance at the resonance of the cavity-tip system stays constant even when the tip strongly interacts with the cavity mode. Moreover, the maxi-mum redshift of the resonance associated to the 3 dB attenu-ation共or 3 dB increase兲 is consistent with the 0.9 nm redshift measured previously and presented in Fig.1共d兲.
Then, we have analyzed the formation of the reported near-field interaction maps. Since the cavity transmittance exhibits a Lorentzian signature, the transmitted intensity through the cavity, IT共M兲, at the measurement wavelength,
M, is developed as follows:
IT共M兲 =
A A2+共M−R0兲2
, 共1兲
whereR0is the resonance wavelength of the cavity and A is
a constant that can be fitted from the transmittance spectra.
FIG. 2. 共Color online兲 共a兲 Topography of the cavity recorded at the same time as the near-field interaction maps.共b兲 Schematic of the experiment: We record the transmittance of the cavity IT共x,y兲 as a function of the tip position共x,y兲 with z=4 nm. 共c兲 and 共d兲 Ex-perimental IT共x,y兲 interaction maps for two different wavelengths: 共c兲 r共z⬎50 nm兲=1584.6 nm and 共d兲 r共z=4 nm兲=1585.5 nm.
LALOUAT et al. PHYSICAL REVIEW B 76, 041102共R兲 共2007兲
The presence of the tip at共x,y,z兲 above the cavity induces a resonance shift, ␦共x,y,z兲, and the cavity resonance be-comes R共x,y,z兲=R0+␦共x,y,z兲. Thus the transmitted
in-tensity is
IT共x,y,z,M兲 =
A
A2+关M−R0−␦共x,y,z兲兴2
. 共2兲 Next, the theory of perturbations established for micro-wave cavities13,14 allows us to quantify the relative
wave-length shift. We consider a near-field tip with a dielectric constantp and a magnetic permeability p above a cavity
with a dielectric constant and a magnetic permeability 0 which confines an electromagnetic field Eជ0and Hជ0in a
vol-ume Vcav. As the presence of the tip above the cavity
adia-batically changes the cavity resonance wavelength without introducing significant additional scattering losses 共assump-tions confirmed by the experimental observa共assump-tions兲, the rela-tive wavelength shift,␦/, is directly defined by the over-lap integral between the unperturbed and the perturbed fields, Eជ and Hជ, inside the perturbation volume Vp:
␦ =
冕
Vp 共Pជ*· Eជ 0+ Mជ*· Bជ0兲dv冕
Vcav 共Eជ0*· Eជ0+Hជ0*· Hជ0兲dv , 共3兲where Pជ and Mជ are the polarization and the magnetization vectors defined as Pជ=共p−0兲Eជ and Mជ= −0pHជ withpthe
magnetic susceptibility of the near-field tip. Here the de-nominator represents the energy stored inside the cavity vol-ume and is independent of the perturbation as long as the unperturbed and the perturbed fields remain comparable.
This relation predicts that the wavelength shift induced by a near-field tip is entirely set by the optogeometric properties of the tip and the field distribution of the cavity mode. It also reveals that a dielectric tip perturbs the electric field of the cavity while a magnetic tip perturbs the magnetic field. Con-sequently, in the case of the most commonly used near-field probes made of silica, silicon, or other related materials with-out magnetic properties, the perturbation is entirely related to the electric field distribution above the cavity. However, if materials with a high magnetic susceptibility, such as nickel or cobalt, for instance, were used, the perturbation of the magnetic field should become predominant.
Here, our tip is coated by gold and thus itspis close to 0and the contribution of the magnetic field in the reported
interaction is negligible. Next, since the tip size is limited 共which is supported by the high “resolution” of the optical pictures兲, its interacting volume can be modeled here as a sphere having a volume Vp. Thus, by assuming that the field
inside the perturbation volume is constant, the relative wave-length shift induced by the presence of the tip is
␦ = 3p− 1 p+ 2 兩Eជ0共x,y,z兲兩2Vp U , 共4兲
where U represents the energy stored inside the cavity vol-ume. Thus, even if our metallic possesses a negativep, this
implies that the cavity resonance is redshifted. Finally, using relation 共2兲, the light transmitted through the cavity at the measurement wavelength,M, as a function of the tip
posi-tion is analytically given by IT共x,y,z,M兲 =
A
A2+关M−R0− D兩Eជ0共x,y,z兲兩2兴2
, 共5兲
where D is a constant for a given tip. Thus if we consider an experimental map recorded at M=R0, the intensity
trans-mitted through the cavity is minimum where兩E0共x,y,z兲兩2 is
maximum, whereas an experimental map recorded at M
=R0+␦maxis minimum where兩E0共x,y,z兲兩2is minimum.
To support this analysis, we computed the electromag-netic field distribution inside the cavity by using a 3D fully vectorial frequency-domain modal method relying on Fou-rier expansion techniques.15 In Fig. 3, we plotted the
com-puted intensities of the electric and magnetic fields comcom-puted at z = 4 nm above the cavity: 兩EO兩2=兩Ex兩2+兩Ey兩2+兩Ez兩2 and
兩HO兩2=兩Hx兩2+兩Hy兩2+兩Hz兩2. In contrast to the study in Ref. 8,
which relies on 2D computational results and considered an undefined “optical field,” all the components of the electric field and of the magnetic fields are taken into account in this work in order to allow a quantitative comparison with the experimental near-field interaction maps. As a matter of fact, if for a TE polarization of light in a 3D asymmetric wave-guide, the x components of the electric field are predominant, calculations have clearly shown that the other components are clearly non-negligible: It is found here that兩Ex兩2is only
2.5 times larger than兩Ey兩2and兩Ez兩2.
A first comparison between the reported experimental maps and the field distribution already evidences that the interaction maps are far much closer to兩EO兩2 than to 兩HO兩2.
This confirms the previous analysis and shows that the me-tallic probe used in this work perturbs selectively the electric field of the cavity.
Finally, we plotted in Fig.4the cross sections of the ex-perimental map recorded atM=R0 and of the cavity
trans-mittance predicted by the relation共5兲 along the longitudinal and the transversal direction of the cavity共see the insets in Fig.4兲. It is explicit from the figure that the theoretical and FIG. 3. 共Color online兲 3D calculations of the electromagnetic field distribution at z = 4 nm above the cavity.共a兲 Total electric field intensity兩Eo兩2=兩E
x兩2+兩Ey兩2+兩Ez兩2.共b兲 Total magnetic field intensity 兩Ho兩2=兩Hx兩2+兩Hy兩2+兩Hz兩2. The different field distributions are plot-ted at the same scale and normalized.
experimental results are consistent. Along the propagation axis, the 340-nm-periodicity oscillations of the transmitted intensity related to the electric field distribution above the cavity and due to the tip presence are clearly the same. The differences between the two curves are only visible in the contrast between nodes and antinodes: This corresponds to the limit of the perturbation model, which assumes that the field inside the perturbation volume is constant. As a matter of fact, even if the tip apex is limited to 50 nm, the field
inside the perturbation volume is rather averaged inside the tip than constant.
At last, along the transverse direction, the calculation and the experiment also clearly show the transverse profile of the mode propagating inside the structure. The evanescent decay of the field on each side of the waveguide, the discontinuity of the Exand Ezcomponents along the etched walls and the
field confinement inside the waveguide are observed. The experimental enlargement visible on the edge of the wave-guide is simply due to the scanning mode关see the inset on Fig.4共d兲兴: In this region, both the tip apex and the tip side interact with the optical near-field.
To summarize, we have shown that a subwavelength tip brought in the optical near-field of a small-volume resonator permits us to finely tune its resonance without introducing additional losses. Then, we have experimentally mapped this interaction and evidenced, in light of 3D calculations associ-ated to a perturbation theory, that the near-field interaction is strongly related to the distribution of the electric field inten-sity inside the cavity. Finally, the reported results also sug-gest that it should be possible to selectively perturb electric or magnetic fields surrounding nanocavities by controlling the near-field probe properties. This near-field effect may find several applications in the field of cavity quantum elec-trodynamics to finely match the cavity-atom resonances and could also open the way to an exciting challenge: The me-chanical manipulation of the light at the subwavelength scale.
This work has been supported by the French ministry in charge of research with the ACI NR 63 CHABIP and by the Agence Nationale de la Recherche with the contract MIRA-MAN of the French ANR Nano2006.
1N. Louvion, D. Gérard, J. Mouette, F. de Fornel, C. Seassal, X.
Letartre, A. Rahmani, and S. Callard, Phys. Rev. Lett. 94, 113907共2005兲.
2H. Gersen, T. J. Karle, R. J. P. Engelen, W. Bogaerts, J. P.
Kort-erik, N. F. Van Hulst, T. F. Krauss, and L. Kuipers, Phys. Rev. Lett. 94, 073903共2005兲.
3H. Gersen, T. J. Karle, R. J. P. Engelen, W. Bogaerts, J. P.
Kort-erik, N. F. Van Hulst, T. F. Krauss, and L. Kuipers, Phys. Rev. Lett. 94, 123901共2005兲.
4B. Cluzel, D. Gérard, E. Picard, T. Charvolin, V. Calvo, E. Hadji,
and F. de Fornel, Appl. Phys. Lett. 85, 2682共2004兲.
5P. Kramper, M. Kafesaki, C. M. Soukoulis, A. Birner, F. Müller,
U. Gösele, R. B. Wehrspohn, J. Mlynek, and V. Sandoghdar, Opt. Lett. 29, 174共2004兲.
6B. Cluzel, D. Gérard, E. Picard, T. Charvolin, F. de Fornel, and E.
Hadji, J. Appl. Phys. 98, 086109共2005兲.
7A. F. Koenderink, M. Kafesaki, B. C. Buchler, and V.
Sandogh-dar, Phys. Rev. Lett. 95, 153904共2005兲.
8W. C. L. Hopman, A. J. F. Hollink, R. M. de Ridder, K. O. van
der Werf, V. Subramaniam, and W. Bogaerts, Opt. Express 14, 8745共2006兲.
9I. Märki, M. Salt, and H. P. Herzig, Opt. Express 14, 2969
共2006兲.
10P. Lalanne, S. Mias, and J. P. Hugonin, Opt. Express 12, 458
共2004兲.
11F. Riboli, A. Recati, N. Daldosso, L. Pavesi, G. Pucker, A. Lui, S.
Cabrini, and E. Di Fabrizio, Photonics Nanostruct. Fundam. Appl. 4, 41共2006兲.
12Standard commercial probe product by Nanonics®. 13L. C. Maier and J. C. Slater, J. Appl. Phys. 23, 68共1952兲. 14A. Gokirmak, D.-H. Wu, J. S. A. Bridgewater, and S. M. Anlage,
Rev. Sci. Instrum. 69, 3410共1998兲.
15E. Silberstein, P. Lalanne, J. P. Hugonin, and Q. Cao, J. Opt. Soc.
Am. A 18, 2865共2001兲. FIG. 4. Cross sections of the experimental map共dot curve兲
re-corded atM=R0and of the cavity transmittance predicted by the relation共5兲 共straight curve兲 along the 共a兲 longitudinal, 共b兲 transver-sal directions of the cavity. The insets on the top show the positions of the cross sections and evidence the tip displacement above the cavity.
LALOUAT et al. PHYSICAL REVIEW B 76, 041102共R兲 共2007兲