HAL Id: tel-02314066
https://tel.archives-ouvertes.fr/tel-02314066
Submitted on 11 Oct 2019
Development of ruthenium nanoparticles as catalyst
models for the splitting of water : combination of
experimental and theoretical chemistry approaches
Roberto Gonzalez-Gomez
To cite this version:
Roberto Gonzalez-Gomez. Development of ruthenium nanoparticles as catalyst models for the splitting of water : combination of experimental and theoretical chemistry approaches. Coordination chemistry. Université Paul Sabatier - Toulouse III, 2019. English. �NNT : 2019TOU30019�. �tel-02314066�
AKNOWLEDGMENTS
This thesis work was developed thanks to the Mexican financial support of the National Council of Science and Technology (CONACyT). I thus thank greatly to this institution for having awarded me the doctoral grant under the program “Becas de Posgrado en el Extranjero” (CVU: 483283) and thus promoting my postgraduate studies.
I would like to thank Dr. Jean-François Halet, Pr. Jean-Yves Piquemal, Dr. Carine Michel and Pr. Montserrat Gómez Simon for accepting to be the jury members of my thesis.
My deepest and most sincerely gratitude goes to my supervisors Dr. Karine Philippot and Pr. Romuald Poteau who have guided me through the doctoral research. I would like to thank you for giving me support, encouragement and motivation. Special gratitude for your kindness and enthusiasm, and for providing me valuable suggestion during these years. Without your help and wisdom my doctoral scientific formation could not be possible.
Thanks to Pr. Catherine Amiens and Dr. Iker del Rosal for sharing their vast knowledge during scientific discussions. Also, I would like to offer my appreciation for having the opportunity to work with you.
I would like to thank the current and former members of the team “Engineering of Metal Nanoparticles” at the Laboratory of Coordination Chemistry (LCC) and of the team “Physical and Chemical Modelization” at the Laboratory of Physics and Chemistry of Nano-objects (LPCNO).
I would like to extend my gratitude to Dr. Pierre Lecante for X-ray analyses, to Vincent Collière for electron microscopy experiments and to Dr. Yannick Coppel and Dr. Christian Bijani for nuclear magnetic resonance experiments. Thanks for the scientific discussions that were a valuable contribution for the characterization of the nanoparticles systems presented in this thesis. Without your collaboration this work could have not been completed.
AKNOWLEDGMENTS
My special thanks to my friends and co-workers Laize Zaramello, Elena Martín Morales, Jordi Creus Casanovas, Samuel Drouet, Carlos Álvares Lamsfus, Chen Zhang, Alvaro Fernández Álvarez, Carlos Pinheiro, Luca Digianantonio, Luis Miguel Martínez Prieto, Israel Cano, Julian Crespo Gutiérrez, Andreas Sergides and David Poirot for their valuable time that we shared together in this adventure.
Thank you to my teammates Lorraine, Mai-Phuong, Yan, Laura, Lea, Thiquyen, Elisa, Jorge, Ionut, Mahmoud, Lluìs, Laurent, Paul, Iskander, Adrien B., Adrien S., Karl, Thomas and François, for their friendship.
Special thanks to my friends in Mexico Itzel, Hamlet, Hiroshi, Miguel, Fernando A., Diego, Fernando L. and Is-boset, for always giving me a good reason to laugh.
I would like to thank my parents Gabriela and Roberto for giving me their love and guidance through all my life. To my sister Jimena for always being with me even in the worst moments and for giving me the cutest nephew, Santi. To my uncles José and Joaquín for always being there for me. To my aunt Guillermina for being the light in my road. Also, I would like to thank to my grandmother Marina and my aunts Malena and Miriam for being so supportive. To my cousin Juan for sharing many adventures. To my grandma Consuelo who always will be in my heart.
Finally, I would like to thank my wife Ana who was and will be always by my side in this journey.
TABLE OF
CONTENTS
AKNOWLEDGMENTS ... 3 TABLE OF CONTENTS ... 5 LIST OF FIGURES ... 10 LIST OF SCHEMES ... 15 LIST OF TABLES ... 16 ABBREVIATIONS... 19 GENERAL INTRODUCTION ... 21CHAPTER I GENERAL BACKGROUND ... 25
1.1METAL NANOPARTICLES:INTERESTS,PROPERTIES AND APPLICATIONS ... 27
1.2SYNTHESIS OF METAL NANOPARTICLES ... 33
1.2.1 Synthesis of MNPs in Solution ... 34
1.2.2 Formation Mechanism of MNPs ... 35
1.2.3 Stabilization of MNPs ... 37
1.2.4 Synthesis of MNPs by the Organometallic Approach ... 39
1.3DFT FOR MODELING ORGANOMETALLIC NANOCATALYSTS ... 40
1.3.1 Methods for Describing MNPs ... 42
1.3.2 Strategy Used to Define the Surface of MNPs ... 43
1.4RUTHENIUM NANOPARTICLES ... 45
1.4.1 Synthesis of RuNPs ... 46
1.4.2 Stabilization of RuNPs ... 47
1.4.3 Experimental and Theoretical Characterization of RuNPs ... 49
1.4.4 Modification of RuNPs by Ligand Exchange... 51
TABLE OF CONTENTS
CHAPTER II ETHANOIC ACID-CAPPED RUNPS: EXPERIMENTAL AND THEORETICAL STUDIES ... 57
2.1INTRODUCTION ... 59
2.2SYNTHESIS AND STRUCTURAL CHARACTERIZATION OF RUNPS ... 66
2.2.1 Organometallic Ruthenium Precursor ... 66
2.2.2 Synthesis of Ethanoic Acid-Capped RuNPs ... 68
2.2.2.1 Structural Characterization of RuNPs Stabilized with 0.2 equiv. of CH3COOH ... 69
2.2.2.2 Structural Characterization of RuNPs Stabilized with 0.4 equiv. of CH3COOH ... 72
2.3STUDY OF THE ETHANOIC ACID INTERACTIONS WITH THE SURFACE OF RUNPS ... 78
2.3.1 Proton-Liquid NMR Characterization ... 78
2.3.2 Diffusion-Ordered Proton NMR Experiments ... 84
2.4CARBOXYLIC ACID POSSIBLE DEPROTONATION ... 89
2.4.1 Carboxylic Adsorption Strengths and CH3COO-H Bond Dissociation ... 90
2.4.2 Solid-NMR Characterization ... 94
2.4.3 Vibrational Properties ... 100
2.5SURFACE COMPOSITION ... 104
2.5.1 Experimental Titration of Surface Hydrides ... 104
2.5.2 DFT Titration of Surface Species ... 106
2.5.3 On the Possible Presence of THF at the NPs Surface ... 117
2.6ELECTRONIC PROPERTIES ... 124
2.6.1 Electronic States ... 125
2.6.2 Atomic Charges in RuNP ... 127
2.7HYDROGEN EVOLUTION REACTION:APOSSIBLE APPLICATION ... 129
2.8CONCLUSION ... 133
CHAPTER III CARBOXYLIC ACID-CAPPED RUNPS: USE OF LIGANDS WITH LONGER ALKYL CHAIN LENGTH ... 137
3.AINTRODUCTION ... 139
3.1PENTANOIC ACID-CAPPED RUNPS ... 142
3.1.1 Synthesis of RuNPs Stabilized by Pentanoic Acid ... 142
3.1.2 Adsorption Energies Analysis in Ru55 NP Model Covered by Pentanoic Moieties... 145
3.1.3 1H-NMR Study of Rux(C4H9COOH)0.4 NPs ... 147
3.1.4 DOSY 1H-NMR Analysis of Rux(C4H9COOH)0.4 NPs ... 149
3.2OCTANOIC ACID-CAPPED RUNPS ... 182
3.2.1 Assisted-Synthesis of RuNPs Stabilized by Octanoic Acid... 183
3.2.2 Theoretical Determination of Adsorption Energies of Carboxylic Acids onto Ru55 Model ... 193
3.2.3 THF Strength as Solvent-Controlled RuNPs ... 196
3.2.4 RuNPs Stabilized with Octanoic Acid in Pentane ... 202
3.2.5 Optimized Synthesis of RuNPs Stabilized with Octanoic Acid ... 204
3.2.5.1 Structural Analysis of Rux(C7H15COOH)0.20 NPs ... 206
3.2.5.2 Organic Molecules Surrounding the Rux(C7H15COOH)0.20 NPs Surface ... 208
3.2.5.3 Quantification of Organic Molecules Attached onto the Surface of Rux(C7H15COOH)0.20 NPs ... 218
3.2.5.3.1 Quantification of Stabilizing Agent Interacting with the Rux(C7H15COOH)0.20 NPs by 2D-NMR ... 218
3.2.5.3.2 Microanalyses applied to Rux(C7H15COOH)0.20 NPs ... 226
3.2.5.3.3 Quantification of Reactive Hydrogen at the Surface of Rux(C7H15COOH)0.20 NPs ... 228
3.2.5.3.4 Titration of Rux(C7H15COOH)0.20 NPs by DFT calculations ... 230
3.2.5.3.5 Surface Saturation of Rux(C7H15COOH)0.20 NPs ... 237
3.2.5.3.6 Exposure of Rux(C7H15COOH)0.20 NPs under 13CO Atmosphere ... 244
3.2.5.4 Evaluation of Rux(C7H15COOH)0.20 NPs for the HER by DFT Calculations ... 248
3.2.6 Conclusion ... 252
CHAPTER IV LIGAND EXCHANGE AT THE SURFACE OF OCTANOIC ACID STABILIZED RUNPS ... 257
4.1INTRODUCTION ... 259
4.2LIGAND EXCHANGE AT RUNPS SURFACE:OCTANOIC ACID VS BENZOIC ACID ... 262
4.2.1 One-Step Synthesis of RuNPs Stabilized by Benzoic Acid ... 263
4.2.2 Titration of Octanoic vs Benzoic Acid Ligand Exchange at RuNPs Surface ... 266
4.2.3 DFT Modelling of the Involved Species in the Ligand Exchange ... 279
4.3LIGAND EXCHANGE AT RUNPS SURFACE:OCTANOIC ACID VS TFA ... 285
4.3.1 Titration of Octanoic vs TFA Exchange on the RuNPs Surface ... 286
4.3.2 DFT Modelling of the Involved Species in the Ligand Exchange ... 295
4.4CONCLUSION ... 297
CHAPTER V TOWARD HYBRID [RU(BPY)3]2+-NPS NANOMATERIALS: PRELIMINARY STUDY BY DFT ... 301
5.1INTRODUCTION ... 303
5.2STUDY OF THE COORDINATION OF A BIPYRIDINE-BASED RUTHENIUM COMPLEX ONTO RUNPS BY DFTCALCULATIONS ... 306
5.2.1 Interaction of PS with Ru55 NP with at Low Surface Coverage ... 308
5.2.2 Interaction of PS with Ru55 NP at Intermediate Surface Coverage... 311
5.2.3 Interaction of PS1 with Ru55 NP at High Surface Coverage ... 316
5.3CONCLUSION ... 319
CHAPTER VI EXPERIMENTAL AND THEORETICAL DFT SPECIFICATIONS ... 323
6.1EXPERIMENTAL PART ... 325
6.1.1 Generals and Chemical Products ... 325
6.1.2 Synthesis Procedures ... 326
6.1.2.1 Synthesis of [Ru(COD)(COT)] ... 326
TABLE OF CONTENTS
6.1.3 Characterization Techniques ... 330
6.1.3.1 Transmission Electron Microscopy (TEM), High-Resolution TEM (HRTEM) and Energy-Dispersive X-Ray Spectroscopy (EDX) ... 330
6.1.3.2 Microanalysis ... 331
6.1.3.3 Vibrational Spectroscopy ... 331
6.1.3.4 Gas Chromatography ... 332
6.1.3.5 Wide-Angle X-Ray Scattering ... 332
6.1.3.6 Liquid Nuclear Magnetic Resonance ... 333
6.1.3.6.1 Calculation of Hydrodynamic Radius ... 334
6.1.3.6.2 Quantification of Ligand Surface Coverage ... 335
6.1.3.6.3 RuNPs Surface Saturation ... 336
6.1.3.6.4 Ligand Exchange Quantification ... 336
6.1.3.7 Solid-State Nuclear Magnetic Resonance ... 336
6.1.4 Surface Reactivity Studies and Catalysis ... 337
6.1.4.1 Quantification of Surface Reactive Hydrogen Atoms ... 337
6.1.4.2 Surface Mapping with 13CO ... 338
6.2DFTCALCULATIONS ... 338
6.2.1 Ru55 Nanoparticle Model ... 338
6.2.2 Periodic DFT Calculations of Ru55 Nanoparticles ... 340
6.2.3 Ligand Adsorption Energies Calculations ... 342
6.2.4 Reaction Barriers ... 342
6.2.5 NMR Calculations of Organic Moieties on Small Ruthenium Clusters ... 343
6.2.6 Ab initio Thermodynamics ... 344
6.2.7 Normal Modes of Vibration ... 346
6.2.8 Calculation of Atomic d-Band Centers ... 346
6.2.9 pDOS, pCOHP and Atomic Charges Calculations... 346
6.2.10 Qualitative Average Bond Strength ... 347
6.2.11 Gibbs Free Energy for HER Reaction ... 347
GENERAL CONCLUSION ... 349
RESUME DE LA THESE ... 353
APPENDIX A ... 379
A.1ADSORPTION OF HYDROGEN (H) ONTO RU55NP ... 379
B.1ADSORPTION OF PENTANOATE ONTO HYDROGENATED AND BARE RU55NP... 386
B.2ADSORPTION OF OCTANOATE ONTO HYDROGENATED AND BARE RU55NP ... 387
B.3ADSORPTION OF A SINGLE OCTANOIC,BENZOIC AND TRIFLUOROACETIC CARBOXYLIC MOIETY ONTO BARE RU55NP ... 388
B.4ADSORPTION OF COMBINED OCTANOATES AND BENZOATES MOIETIES ONTO BARE RU55NP ... 388
B.5ADSORPTION OF PS ONTO LOW CROWDED RU55NP ... 389
B.6ADSORPTION OF PS ONTO INTERMEDIATE CROWDED RU55NP ... 389
B.7ADSORPTION OF PS1 ONTO HIGH CROWDED RU55NP ... 389
APPENDIX C ... 390
C.1ADSORPTION OF ETHANOIC ACID ON CROWDED RU55NP ... 390
C.2ADSORPTION OF THF ON CROWDED RU55NP ... 390
C.3ADSORPTION OF THF ON CROWDED RU55NP ... 391
APPENDIX D ... 392
D.1VIBRATION CORRECTIONS FOR RU-H ONTO RU55NP ... 392
D.2VIBRATION CORRECTIONS FOR RU-CH3COOH ONTO RU55NP ... 392
D.3VIBRATION CORRECTIONS FOR RU-CH3COO ONTO RU55NP ... 393
APPENDIX E ... 394
E.1ADSORPTION OF HYDROGEN ON RU55(CH3COO)X(H)YNPMODEL. ... 394
E.2ADSORPTION OF HYDROGEN ON RU55(C4H9COOH)14(H)14NPMODEL. ... 395
E.3ADSORPTION OF HYDROGEN ON RU55(C7H15COOH)14(H)14NPMODEL. ... 395
APPENDIX F... 396
LIST OF FIGURES
LIST OF FIGURES
FIGURE 1.1 ENERGY LEVEL DIAGRAM FROM BULK METAL TO MOLECULAR MOIETIES. ... 28
FIGURE 1.2 REPRESENTATION OF THE QUANTUM SIZE EFFECT AND DISCRETE ELECTRONIC ENERGY LEVELS IN MNPS. ... 29
FIGURE 1.3 COMPARISON OF THE SURFACE AREA IN BULK MATERIALS AND METAL NANOPARTICLES. ... 29
FIGURE 1.4 NANOCATALYST ARE CLAIMED TO HAVE BETTER ACTIVITY AND SELECTIVITY THAN THAT OF BULK MATERIALS.[28] ... 32
FIGURE 1.5 MNPS USED IN THE WATER SPLITTING REACTION. A) HER[31] & B) OER.[32] ... 33
FIGURE 1.6 MAIN APPROACHES FOR THE SYNTHESIS OF MNPS.[38] ... 34
FIGURE 1.7 REPRESENTATION OF STABILIZED MNP. ... 38
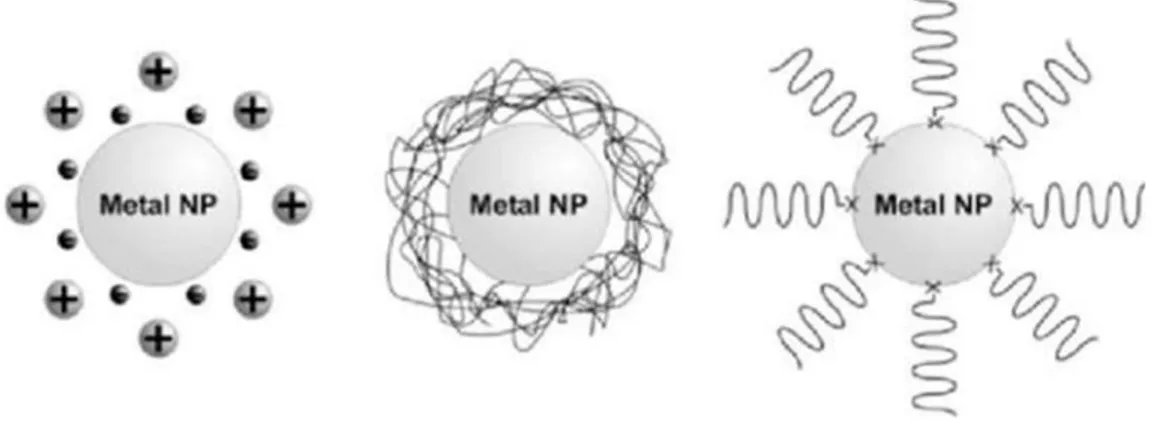
FIGURE 1.8 REPRESENTATION OF MNPS STABILIZED BY ELECTROSTATIC INTERACTIONS, POLYMERS AND ORGANIC LIGANDS, RESPECTIVELY.[54] ... 38
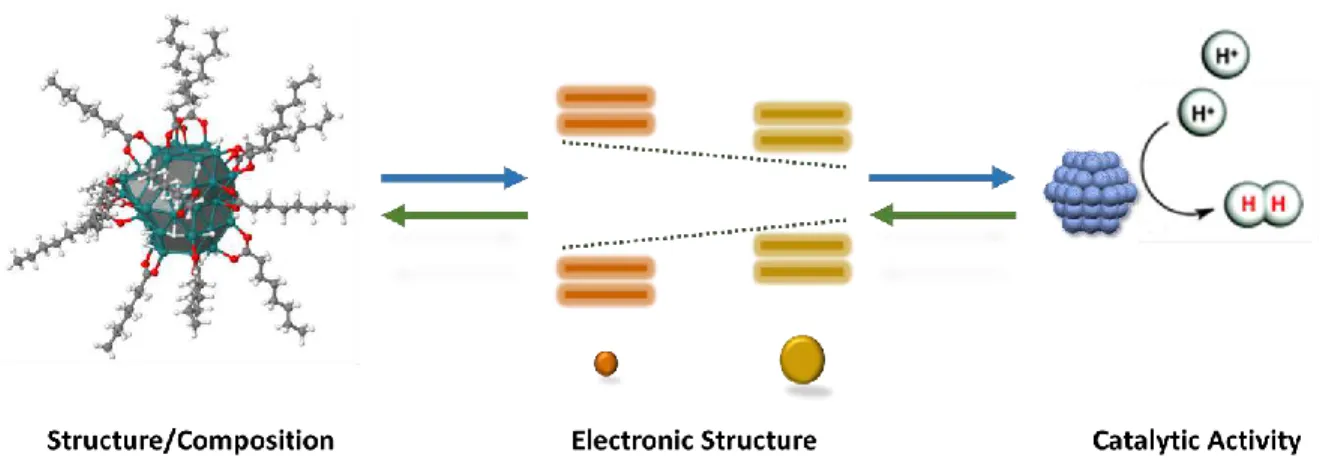
FIGURE 1.9 REPRESENTATION OF THE LINK BETWEEN MNPS STRUCTURE-COMPOSITION, ELECTRONIC STRUCTURE AND CATALYTIC ACTIVITY (E.G. HER). ... 41
FIGURE 1.10 REPRESENTATION OF A PTNP SUPPORTED ONTO AN OXIDE SUBSTRATE (SUPPORT). THE PTNP EXHIBITS A COMBINATION OF A PT(111) SLAB LAYERS FOR THE INNER FACETS AND PT79 NANOPARTICLES FOR MODELING THE EDGE, CORNER, AND NEARBY SITES.[81] ... 43
FIGURE 1.11 RU55 HCP CLUSTER IN A UNIT CELL OPTIMIZED BY VASP.. ... 45
FIGURE 1.12 REPRESENTATION OF ORGANOMETALLIC PRECURSOR USED TO SYNTHETIZE RUNPS. [RU3(CO)12], [RU(COD)(Η3-C3H5)2], [RU(COD)(COT)], RESPECTIVELY. ... 46
FIGURE 1.13 VARIATION OF THE SIZE OF RUNPS SYNTHETIZED BY THE ORGANOMETALLIC APPROACH IN RELATION WITH THE LIGAND DONOR STRENGTH OF THE STABILIZERS. LIGANDS: 1,3- DICYCLOHEXYLIMIDAZOLIUM-2-DI-P-TOLYLCARBODIIMIDE; 1,3- DIMETHYL-4,5-DIUNDECYL IMIDAZOL-2-YLIDENE; BIS-(DIPHENYLPHOSPHINO)BUTANE, HEPTANOL, RESPECTIVELY.[93] ... 48
FIGURE 1.14 REPRESENTATION OF LIGAND EXCHANGE AT THE SURFACE OF MNPS. ... 52
FIGURE 1.15 SOME HYDROPHOBIC AND HYDROPHILIC CAPPING LIGANDS USED FOR MNPS PHASE TRANSFER.[121] ... 53
FIGURE 1.16 REPRESENTATION OF THE SELECTIVE HYDROGENATION CATALYSIS PERFORMED ON RUNPS. ... 55
FIGURE 2.1 NANOMATERIALS SIZE IN COMPARISON WITH ORGANIC AND INORGANIC STRUCTURES.[139] ... 60
FIGURE 2.2 INTEREST ON METAL NANOPARTICLES IN DIFFERENT FIELDS: (A) MEDICINE;[145] (B) CATALYSIS;[146] (C) BIOLOGY.[144] ... 61
FIGURE 2.3 METAL NANOPARTICLE PROTECTED BY: (A) POLYMER; (B) LIGAND MOLECULES.[150] ... 62
FIGURE 2.4. (A) DIFFERENT TYPE OF LIGANDS USED FOR STABILIZING RUNPS;[93] (B) REACTION PATHWAYS FOR THE FORMIC ACID DECOMPOSITION.[151] ... 63
FIGURE 2.5 SYNTHESIS OF RUX(C66(COOH)12)Y NANOPARTICLES. [109] ... 64
FIGURE 2.6 GOLD MODEL NANOPARTICLE COVERED BY P-MERCAPTOBENZOIC ACID (AU102(P-MBA)44) AND THEIR DIFFERENT COORDINATION MODES.[153] ... 65
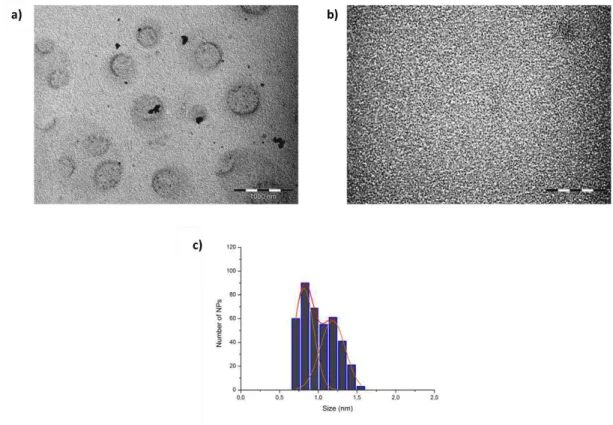
FIGURE 2.7 TEM MICROGRAPHS OF RUX(CH3COOH)0.2 NPS SAMPLE; (A) RUTHENIUM SUPERSTRUCTURES; SCALE BAR: 1000 NM; (B) ULTRA-SMALL RUNPS; SCALE BAR: 50 NM; (C) SIZE HISTOGRAM OF INDIVIDUAL RUNPS. ... 70
FIGURE 2.15 1H-NMR
(THF-D8); (BLUE) RUX(CH3COOH)0.4 NPS; (RED) CH3COOH. ... 79
FIGURE 2.16 [RU6] NANOCLUSTERS USED AS MODEL FOR THE DFT CHEMICAL SHIFT CALCULATIONS. ... 80
FIGURE 2.17 DFT MEAN METHYL PROTONS CHEMICAL SHIFT OF (A) ETHANOIC ACID DIMER & (B) ETHANOATE. ... 81
FIGURE 2.18 DFT MEAN METHYL PROTONS CHEMICAL SHIFT OF CH3COOH INTERACTING WITH [RU6] NANOCLUSTER IN DIFFERENT COORDINATION MODES; (A) Η; (B) Μ. ... 82
FIGURE 2.19 DFT MEAN METHYL PROTONS CHEMICAL SHIFT OF CH3COO MOIETY INTERACTING WITH [RU6] NANOCLUSTER IN DIFFERENT COORDINATION MODES; (A) CHAIR: Σ CARBON, Μ3; (B) MONODENTATE: Η; (C) BIDENTATE: Μ. ... 82
FIGURE 2.20 DFT MEAN METHYL PROTONS CHEMICAL SHIFT OF TWO CH3COO MOIETIES INTERACTING WITH MG2+. ... 83
FIGURE 2.21 EXPERIMENTAL 1H-NMR (THF-D8) OF RUX(CH3COOH)0.4 NPS (BLUE) IN COMPARISON WITH FREE CH3COOH (RED). DFT 1H-NMR CHEMICAL SHIFTS OF THE METHYL GROUP IN VARIOUS MODELS ((CH3COOH)2, CH3COO-, [RU6] CLUSTERS). ... 84
FIGURE 2.22 DIFFUSION-FILTERED DOSY 1H-NMR (THF-D8) SPECTRUM OF RUX(CH3COOH)0.4 NPS. ... 86
FIGURE 2.23 DIFFUSIONAL ATTENUATION OF THE [1.9 - 2.2 PPM] AREA FOR RUX(CH3COOH)0.4 NPS DISPERSED IN THF-D8 AT R.T. DATA WERE ANALYZED WITH A BI-EXPONENTIAL LEAST-SQUARE FITTING. ... 87
FIGURE 2.24 THEORETICAL MODELS USED FOR STUDYING THE ETHANOIC ACID INTERACTION WITH (A) RU55 NP; MODEL 1 & (B) RU55(CH3COO)15H32 NP; MODEL 2. THE FACETING OF THE SURFACE IS HIGHLIGHTED WITH TRANSLUCENT GRAY PLANES. ... 91
FIGURE 2.25 ENERGY PROFILE OF THE CH3COO-H BOND DISSOCIATION. BLACK PROFILE: O-H ACTIVATION ON THE RU55 NP (MODEL 1); RED PROFILE: O-H ACTIVATION ON THE RU55(CH3COO)15H32 NP (MODEL 2). GEOMETRIES ARE SHOWN FOR THE MODEL 1, SIMILAR PARAMETERS WERE FOUND IN MODEL 2. ENERGIES ARE GIVEN IN KCAL.MOL-1. SOME CHARACTERISTIC BOND LENGTHS ARE ALSO GIVEN, IN Å (SAME COLOR CONVENTION AS THE ENERGY PROFILES). ... 92
FIGURE 2.26 13C CP HAHN-MAS NMR OF RU X(CH3COOH)0.4 NPS DILUTED IN POROUS SILICA. ... 95
FIGURE 2.27 DFT MEAN CHEMICAL SHIFT OF THE CARBOXYLIC CARBON ATOMS IN THE ETHANOIC ACID DIMER. ... 96
FIGURE 2.28 METHYL CARBON DFT CHEMICAL SHIFT OF THE ETHANOIC MOIETIES INTERACTING WITH [RU6] NANOCLUSTER. DIFFERENT COORDINATION MODES (A) CH3COOH; Σ CARBON, Μ, (B) CH3COO; Μ, (C) CH3COO; Η & (D) CH3COOH; Η. ... 97
FIGURE 2.29 CARBOXYLIC CARBON DFT CHEMICAL SHIFT OF THE CARBOXYLIC MOIETIES FREE AND INTERACTING WITH [RU6] NANOCLUSTER. DIFFERENT COORDINATION MODES (A) CH3COO; Η, (C) CH3COOH; Σ CARBON, Μ, (D) CH3COO; Σ CARBON, Μ3 & (B) FREE CH3COO... 98
FIGURE 2.30 CARBOXYLIC CARBON DFT CHEMICAL SHIFT OF THE CARBOXYLIC MOIETIES INTERACTING WITH [RU6] NANOCLUSTER. DIFFERENT COORDINATION MODES (A) CH3COOH; Η & (B) CH3COO; Μ. ... 99
FIGURE 2.31 EXPERIMENTAL 13C SOLID-NMR OF RUX(CH3COOH)0.4 NPS AND DFT 13C-NMR CHEMICAL SHIFTS OF THE METHYL (RED) AND CARBOXYLIC CARBON (BLUE) IN VARIOUS MODELS ((CH3COOH)2, CH3COO- & [RU6] CLUSTERS). ... 100
FIGURE 2.32 EXPERIMENTAL FTIR SPECTRUM OF RUX(CH3COOH)0.4 NPS AND MAIN PEAKS ASSIGNMENTS. THE EXPERIMENTAL PEAKS POSITION AND ASSIGNMENT OF SODIUM ETHANOATE (CH3COONA) ARE ALSO INDICATED: IN THE SOLID (GREEN) AND LIQUID STATE (PURPLE). Ν: STRETCHING; Δ: BENDING; Ρ: ROCKING; Ω: WAGGING; SS OR S: SYMMETRIC; AS: ASYMMETRIC. ... 101
FIGURE 2.33 EXPERIMENTAL FTIR SPECTRUM OF RUX(CH3COOH)0.4 NPS AND THEORETICAL HARMONIC FREQUENCIES CALCULATED FOR MODEL 2 CH3COO*, H* (BLUE: RU-H MODES; RED: RU-ETHANOTE MODES). THE SIGNALS OF CH3COONA ARE ALSO SHOWN. ... 102
FIGURE 2.34 PROGRESSIVE METHODOLOGY APPLIED TO OPTIMIZE RU55 NP STRUCTURES WITH DIFFERENT LIGAND (H & CH3COOH) COVERAGES. ... 107
FIGURE 2.35 ΔAG° (𝑝𝐻2, [CH3COOH]) PHASE DIAGRAM FOR H2 (GAS) AND CH3COOH (LIQUID) ADSORPTION ON RU55 NP AT 300 K (PRESSURE IN BAR, CONCENTRATION IN MOL.L-1). ... 110
FIGURE 2.36 MOST STABLE [RU55] STRUCTURES IN EACH DOMAIN. (DOMAIN 39: RU55(CH3COO)16(H)16; DOMAIN 40: RU55(CH3COO)16(H)25; DOMAIN 19: RU55(CH3COO)4(H)74; DOMAIN 37: RU55(CH3COO)14(H)14; DOMAIN 3: RU55(H)35; DOMAIN 7: RU55(CH3COO)(H)54; DOMAIN 8: RU55(CH3COO)(H)71; DOMAIN 5: RU55(H)70). ... 111
FIGURE 2.37 ΔAG° (𝒑𝑯𝟐, [CH3COOH]) PHASE DIAGRAM FOR H2 (GAS) AND CH3COOH (LIQUID) ADSORPTION ON RU55 NP AT 200 K (PRESSURE IN BAR, CONCENTRATION IN MOL.L-1). ... 113
FIGURE 2.38 ADDITIONAL STABLE [RU55] CLUSTERS FOUND AT 200 K. (DOMAIN 41: RU55(CH3COO)16(H)33; DOMAIN 35: RU55(CH3COO)12(H)65). ... 114
FIGURE 2.39 ΔAG° (𝒑𝑯𝟐, [CH3COOH]) PHASE DIAGRAM FOR H2 (GAS) AND CH3COOH (LIQUID) ADSORPTION ON RU55 NP AT 450 K (PRESSURE IN BAR, CONCENTRATION IN MOL.L-1). ... 115
FIGURE 2.40 ADDITIONAL STABLE [RU55] CLUSTERS FOUND AT 450 K. (DOMAIN 27: RU55(CH3COO)10(H)10; DOMAIN 1: RU55; DOMAIN 2: RU55(H)17; DOMAIN 3: RU55(H)53). ... 116
FIGURE 2.41 TEM MICROGRAPHS OF RUX(THF)Y NPS; (A) RU AGGLOMERATES; SCALE BAR: 200 NM; (B) RUNPS; SCALE BAR: 50 NM; (C) SIZE HISTOGRAM OF INDIVIDUAL RUNPS. ... 118
FIGURE 2.42 OPTIMIZED GEOMETRY OF RU55(CH3COO)15(H)32(THF). ... 121
FIGURE 2.43 ΔAG° (𝒑𝑯𝟐, [THF]) PHASE DIAGRAM FOR H2 (GAS) AND THF (LIQUID) ADSORPTION ON RU55 NP AT 300 K (PRESSURE IN BAR, CONCENTRATION IN MOL.L-1). ... 123
FIGURE 2.44 MORE STABLE [RU55] CLUSTERS FOUND AT 300 K. (DOMAIN 46: RU55(THF)(H)53; DOMAIN 49: RU55(THF)2(H)53; DOMAIN 52: RU55(THF)3(H)53). ... 124
FIGURE 2.45 PROJECTED COHP & DOS PROFILES FOR RUX(CH3COO)16(H)33 NP MODEL. DASHED RED LINE AND DOTTED RED LINE ON THE PDOS PROFILE: D-BAND CENTER OF SURFACE AND CORE RU ATOMS, RESPECTIVELY; BROWN LINE: FERMI ENERGY. THE BACKDONATION OBSERVED IS ALSO HIGHLIGHTED. ... 126 FIGURE 2.46 ATOMIC PMPA CHARGES SHOWN AS COLOR MAPS. (A) RU55; (B) RU55(H)17; (C) RU55(CH3COO)16(H)33. THE CHARGE SCALE IS SHOWN ON THE LEFT. CHARGES ARE ALSO
LIST OF FIGURES
FIGURE 2.47 ATOM D-BAND CENTER IS SHOWN AS COLOR MAP (SCALE IN EV) FOR (A) RU55(CH3COO)16(H)16, (B) RU55(CH3COO)(H)54 AND (C) RU55. THE ΔGH* ARE GIVEN (KCAL.MOL-1)
AND THE ARROWS INDICATE THE ADSORPTION SITES. THE SURFACE, CORE AND TOTAL AVERAGE D-BAND CENTER VALUES ARE ALSO PRESENTED (EV). ... 131
FIGURE 3.1 HRTEM IMAGES OF (A) FCC AND (B) HCP RUNPS. INSETS OF DECAHEDRAL STRUCTURE AND ILLUSTRATION OF HCP LATTICE ON THE (100) DIRECTION, RESPECTIVELY; SCALES BAR 1.0 NM.[92] ... 139
FIGURE 3.2 RU55 NP MODEL STABILIZED BY (A) PENTANOIC ACID AND (B) OCTANOIC ACID. ... 141
FIGURE 3.3 TEM MICROGRAPHS OF RUX(C4H9COOH)0.4 NPS; (A) SELF-ORGANIZED NPS DUE TO SOLVENT EVAPORATION; SCALE BAR: 500 NM; (B) ULTRA-SMALL RUNPS; SCALE BAR: 50 NM; (C) SIZE HISTOGRAM OF INDIVIDUAL RUNPS. ... 144
FIGURE 3.4 RU55 NP MODELS WITH A HIGH COVERAGE VALUE OF CARBOXYLATE AND HYDRIDES ENTITIES; MODEL 1: RU55(CH3COO)12(H)12; MODEL II RU55(C4H9COO)12(H)12. ... 146
FIGURE 3.5 1H-NMR (THF-D8); (BLUE) RUX(C4H9COOH)0.4 NPS; (RED) C4H9COOH... 148
FIGURE 3.6 DIFFUSION-FILTERED DOSY 1H-NMR (THF-D8) SPECTRUM OF RUX(C4H9COOH)0.4 NPS. ... 150
FIGURE 3.7 EXPERIMENTAL FTIR SPECTRUM OF RUX(C4H9COOH)0.4 NPS AND MAIN PEAKS ASSIGNMENTS. EXPERIMENTAL CHARACTERISTIC PEAKS OF PENTANOIC ACID (GREEN BARS, C4H9COOH) AND THF (YELLOW BARS) ARE ALSO INDICATED. Ν: STRETCHING; Δ: BENDING; S: SYMMETRIC; AS: ASYMMETRIC. PEAKS ATTRIBUTED FOR COORDINATED THF AT THE RUNPS SURFACE ARE LIKEWISE SHOWN (BLUE). ... 152
FIGURE 3.8 TEM MICROGRAPHS OF RUX(C4H9COOH)0.05 NPS; (A) & (B) AGGLOMERATION OF PARTICLES; SCALE BAR: 50 NM & 500 NM, RESPECTIVELY. ... 156
FIGURE 3.9 (A) TEM MICROGRAPH OF RUX(C4H9COOH)0.05 NPS; SCALE BAR: 50 NM; (B) CORRESPONDING SIZE HISTOGRAM OF INDIVIDUAL RUNPS. ... 156
FIGURE 3.10 (A) TEM MICROGRAPH OF RUX(C4H9COOH)0.20 NPS; SCALE BAR: 50 NM; (B) CORRESPONDING SIZE HISTOGRAM OF INDIVIDUAL RUNPS. ... 157
FIGURE 3.11 (A) TEM MICROGRAPH OF RUX(C4H9COOH)0.30 NPS; SCALE BAR: 50 NM; (B) CORRESPONDING SIZE HISTOGRAM OF INDIVIDUAL RUNPS. ... 158
FIGURE 3.12 (A) TEM MICROGRAPH OF RUX(C4H9COOH)0.50 NPS; SCALE BAR: 50 NM; (B) CORRESPONDING SIZE HISTOGRAM OF INDIVIDUAL RUNPS. ... 159
FIGURE 3. 13 TEM MICROGRAPH OF RUX(C4H9COOH)0.60 NPS; SCALE BAR: 50 NM; (B) CORRESPONDING SIZE HISTOGRAM OF INDIVIDUAL RUNPS. ... 159
FIGURE 3.14 1H-NMR (THF-D8) OF RUNPS; (1) RUX(C4H9COOH)0.05; (2) RUX(C4H9COOH)0.20; (3) RUX(C4H9COOH)0.30; (4) RUX(C4H9COOH)0.40; (5) RUX(C4H9COOH)0.50; (6) RUX(C4H9COOH)0.60. PEAKS ATTRIBUTED TO SIDE PRODUCTS ARE DENOTED WITH AN “X” AND THE SIGNALS FOR PENTANOIC ACID PEAKS ARE DISPLAYED IN BARS AT THE BOTTOM OF THE FIGURE. THE SIGNAL SURROUNDED BY AN ORANGE CIRCLE CORRESPONDS TO FREE LIGAND. ... 163
FIGURE 3.15 1H-NMR (THF-D8) OF RUNPS; (GROUP 1, BROWN PROFILE), RUX(C4H9COOH)0.05; (GROUP 2, GREEN PROFILE), RUX(C4H9COOH)0.30; (GROUP 3, PURPLE PROFILE), RUX(C4H9COOH)0.60. PEAKS ATTRIBUTED TO SIDE PRODUCTS ARE DENOTED WITH AN “X” AND THOSE OF PENTANOIC ACID ARE DISPLAYED IN BARS AT THE BOTTOM OF THE FIGURE. ... 164
FIGURE 3.16 1H-NMR (THF-D8) OF RUNPS; (RED PROFILE) RUX(C4H9COOH)0.20; (BLUE PROFILE) RUX(C4H9COOH)0.30. PEAKS ATTRIBUTED TO SIDE PRODUCTS ARE DENOTED WITH AND “X” AND THE PEAKS FOR PENTANOIC ACID ARE GIVEN AS BARS AT THE BOTTOM OF THE FIGURE... 165
FIGURE 3.17 13C CP HAHN-MAS NMR OF RU X(C4H9COOH)0.3 NPS DILUTED IN POROUS SILICA. PENTANOIC ACID PEAKS ARE GIVEN IN BARS AT THE BOTTOM OF THE FIGURE. ... 170
FIGURE 3.18 SOME OF THE SELECTED RU55 NP OPTIMIZED STRUCTURES WITH DIFFERENT LIGAND SURFACE COVERAGE (C4H9COO & H)... 173
FIGURE 3.19 ΔAG° (𝒑𝑯𝟐, [C4H9COOH]) PHASE DIAGRAM FOR H2 (GAS) AND C4H9COOH (LIQUID) ADSORPTION ON RU55 NP AT 300 K (PRESSURE IN BAR, CONCENTRATION IN MOL.L-1). ... 175
FIGURE 3.20 MORE STABLE [RU55] STRUCTURES FOUND AT 300 K FOR RUX(C4H9COOH)0.3 NPS. DOMAIN 63: RU55(C4H9COO)14(H)14; DOMAIN 64: RU55(C4H9COO)14(H)31. ... 176
FIGURE 3.21 ΔGH* (KCAL.MOL-1) IN DIFFERENT ADSORPTION SITES (INDICATED BY ARROWS) OF RU55(C4H9COO)14(H)14 NP. ... 179
FIGURE 3.22 TEM MICROGRAPHIES OF (RUX(C7H15COOH)0.4)THF NPS; (A) GENERAL VIEW, SCALE BAR: 100 NM; (B) ZOOM ON THE NANOSYSTEMS, SCALE BAR: 50 NM; (C) CORRESPONDING SIZE HISTOGRAM OF INDIVIDUAL RUNPS. ... 185
FIGURE 3.23 EXPERIMENTAL FTIR SPECTRUM OF (RUX(C7H15COOH)0.4)THF NPS AND MAIN PEAKS ASSIGNMENTS. EXPERIMENTAL PEAKS POSITION FOR FREE OCTANOIC ACID (GREEN BARS, C7H15COOH) AND THF (YELLOW BARS) ARE ALSO INDICATED. Ν: STRETCHING; Δ: BENDING; Ρ ROCKING; S: SYMMETRIC; AS: ASYMMETRIC. PEAKS ATTRIBUTED TO COORDINATED THF (BLUE) ARE LIKEWISE SHOWN. THE ΝAS(COOH) VIBRATIONAL MODE REGION IS HIGHLIGHTED WITH AN ORANGE CIRCLE. ... 187
FIGURE 3.24 COMPARISON OF EXPERIMENTAL FTIR DATA: (A) RUX(CH3COOH)0.4; (B) RUX(C4H9COOH)0.4; (C) (RUX(C7H15COOH)0.4)THF NPS. HIGHLIGHTED REGIONS: (BLUE) Ν (CO); (ORANGE) Ν (COO(H)); (GREEN) Ν (THF). ... 190 FIGURE 3.25 COMPARISON OF EXPERIMENTAL FTIR DATA: (BLUE) RU(CHCOOH) ; (RED) RU(CHCOOH) ; (BLACK) (RU(CH COOH) ) NPS. ZOOM IN TWO DIFFERENT
FIGURE 3.31 TEM MICROGRAPHS OF RUX(C7H15COOH)0.20 NPS; (A) GENERAL VIEW, SCALE BAR: 100 NM; (B) FOCUS ON THE NANOSYSTEMS, SCALE BAR: 50 NM; (C) CORRESPONDING SIZE
HISTOGRAM OF INDIVIDUAL RUNPS. ... 205
FIGURE 3.32 HRTEM ANALYSIS OF RUX(C7H15COOH)0.20 NPS; (A) MICROGRAPHS; (B) FFT (C) MILLER PATTERN. ... 207
FIGURE 3.33 (A) WAXS SPECTRUM OF RUX(C7H15COOH)0.20 NPS (RED PROFILE) COMPARED WITH RU HCP PATTERN (BLUE PROFILE); (B) RDFS COMPARISON IN REAL SPACE OF TWO DIFFERENT BATCHES OF RUX(C7H15COOH)0.20 NPS. ... 208
FIGURE 3.34 EXPERIMENTAL FTIR SPECTRUM OF RUX(C7H15COOH)0.20 NPS AND MAIN PEAKS ASSIGNMENTS. CHARACTERISTIC PEAKS OF OCTANOIC ACID (GREEN BARS, C7H15COOH) AND THF (YELLOW BARS) ARE ALSO INDICATED. Ν: STRETCHING; Δ: BENDING; Ρ ROCKING; S: SYMMETRIC; AS: ASYMMETRIC. REGIONS CORRESPONDING TO Ν(CO) & ΝAS(COO) ARE HIGHLIGHTED IN BLUE AND ORANGE RESPECTIVELY. ... 209
FIGURE 3.35 1H-NMR (BENZENE-D6); (RED) RUX(C7H15COOH)0.20 NPS; (BLUE) C7H15COOH. ... 212
FIGURE 3.36 13C CP HAHN-MAS NMR SPECTRUM OF RU X(C7H15COOH)0.20 NPS DISPERSED IN POROUS SILICA. C7H15COOH PEAKS (CDCL3) ARE DISPLAYED IN BARS AT THE BOTTOM OF THE FIGURE. ... 215
FIGURE 3.37 13C HETCOR MAS NMR OF RUX(C7H15COOH)0.20 NPS DILUTED IN POROUS SILICA. ... 217
FIGURE 3.38 DOSY 1H-NMR (C6D6) RECORDED FOR NON-PURIFIED RUX(C7H15COOH)0.20 NPS. THE DIFFERENT OBSERVED CURVES PRESENTED ARE OBTAINED AS A RESULT OF THE DIFFERENT GRADIENT STRENGTH APPLIED. ... 219
FIGURE 3.39 DIFFUSION-FILTERED 1H-NMR SPECTRUM (C 6D6) RECORDED FOR RUX(C7H15COOH)0.20 NPS. C7H15COOH PROTONS CHEMICAL SHIFTS ARE REPRESENTED IN GREEN BARS AT THE BOTTOM OF THE FIGURE. ... 220
FIGURE 3.40 NOESY NMR SPECTRUM (C6D6) OF RUX(C7H15COOH)0.20 NPS. ... 226
FIGURE 3.41 SELECTION OF RU55 NP OPTIMIZED STRUCTURES WITH DIFFERENT LIGAND SURFACE COVERAGE (C7H15COO & H). ... 232
FIGURE 3.42 ΔAG° (𝒑𝑯𝟐, [C7H15COOH]) PHASE DIAGRAM FOR H2 (GAS) AND C7H15COOH (LIQUID) ADSORPTION ON RU55 NP AT 300 K (PRESSURE IN BAR, CONCENTRATION IN MOL.L -1 ). ... 234
FIGURE 3.43 MORE STABLE [RU55] NP FOUND AT 300 K FOR RUX(C7H15COOH)0.20 NPS. (DOMAIN 73: RU55(C7H15COO)14(H)14; DOMAIN 70: RU55(C7H15COO)10(H)27; DOMAIN 68: RU55(C7H15COO)8(H)25. ... 235
FIGURE 3.44 1H-NMR (C 6D6) SPECTRA OF RUX(C7H15COOH)0.20 NPS WITH DIFFERENT LIGAND ADDITION. (BLUE) REFERENCE, 0.20 EQUIV.; (RED) + 25 %, 0.25 EQUIV.; (GREEN) + 50 %, 0.30 EQUIV.; (PURPLE) + 75 %, 0.35 EQUIV.; (GRAY) + 100 %, 0.40 EQUIV. C7H15COOH PROTONS CHEMICAL SHIFTS ARE REPRESENTED IN GREEN BARS AT THE BOTTOM OF THE FIGURE. ... 239
FIGURE 3.45 TEM MICROGRAPHS OF RUX(C7H15COOH)0.20+0.20 NPS; (A) GENERAL VIEW, SCALE BAR: 200 NM; (B) FOCUS ON THE NANOSYSTEMS, SCALE BAR: 50 NM; (C) MICROGRAPH OF INITIAL RUX(C7H15COOH)0.20 NPS; SCALE BAR: 50 NM. ... 243
FIGURE 3.46 NOESY-NMR SPECTRUM (C6D6) OBTAINED FOR RUX(C7H15COOH)0.20+0.20 NPS. POSITIVE NOE IS HIGHLIGHTED IN GREEN CIRCLES. ... 244
FIGURE 3.47 COORDINATION MODES OF CO AT THE NPS SURFACE IN RELATION WITH THE FREE SURFACE SITES.[93] ... 245
FIGURE 3.48 13C MAS NMR SPECTRUM OF A SAMPLE OF POROUS SILICA IMPREGNATED WITH OCTANOIC ACID AFTER EXPOSURE UNDER 1 BAR OF 13CO. ... 246
FIGURE 3.49 13C MAS NMR SPECTRUM OF RU X(C7H15COOH)0.20 NPS DISPERSED IN POROUS SIO2. AFTER EXPOSURE UNDER 1 BAR OF 13CO FOR 24 H. SPINNING SIDE BANDS ARE IDENTIFIED AS SSB. ... 247
FIGURE 3.50 ΔGH (KCAL.MOL-1), ARROWS INDICATE THE ADSORPTION SITES OF RU55(C7H15COO)14(H)14 NP. ... 250
FIGURE 4.1 REPRESENTATION OF THE ARENE REDUCTION PATHWAYS: INFLUENCE OF THE MNPS AS CATALYST IN MILD CONDITIONS. ... 260
FIGURE 4.2 EXPECTED PARTIAL OR TOTAL REDUCTION OF ARYL GROUPS IN STABILIZING LIGANDS OF RUNPS... 261
FIGURE 4.3 1H-NMR (THF-D8) ANALYSES OF THE DECOMPOSITION OF [RU(COD)(COT)] UNDER 3 BAR H2 IN THE PRESENCE OF 0.2 EQUIV. OF BENZOIC ACID AND OF THE POSSIBLE FORMATION OF RUNPS... 265
FIGURE 4.4 ZOOM OF THE AROMATIC REGION OF THE 1H-NMR (THF-D8) SPECTRA PROVIDED IN FIGURE 4.3. ... 266
FIGURE 4.5 1H-NMR (C6D6) SPECTRA OF RUX(C7H15COOH)0.20 NPS, REPRESENTED AS 0.20 OCAC, AFTER ADDITION OF AN INCREASING QUANTITY OF BENZOIC ACID. (RED) INITIAL RUNPS STABILIZED WITH 0.20 EQUIV. OF OCAC; (DARK GREEN) 0.20 OCAC + 0.05 EQUIV. OF BAC; (GREEN) 0.20 OCAC + 0.10 EQUIV. OF BAC; (BLUE) 0.20 OCAC + 0.20 EQUIV. OF BAC; (PURPLE) 0.20 OCAC + 0.30 EQUIV. OF BAC. CHEMICAL SHIFTS OF THE OCTANOIC ACID PROTONS (C7H15COOH) ARE PRESENTED IN GREEN BARS AT THE BOTTOM. ... 268
FIGURE 4.6 DIFFUSION-FILTERED 1H-NMR SPECTRA (C6D6) OBTAINED FOR RUX(C7H15COOH)0.20 NPS, REPRESENTED AS 0.20 OCAC, DURING ADDITION OF BENZOIC ACID. (RED) INITIAL RUNPS STABILIZED WITH 0.20 EQUIV. OF OCAC; (DARK GREEN) 0.20 OCAC + 0.05 EQUIV. OF BAC; (GREEN) 0.20 OCAC + 0.10 EQUIV. OF BAC; (BLUE) 0.20 OCAC + 0.20 EQUIV. OF BAC; (PURPLE) 0.20 OCAC + 0.30 EQUIV. OF BAC... 270
FIGURE 4.7 LEFT: ESTIMATED INITIAL SURFACE MAPPING OF RUX(C7H15COOH)0.20 NPS; RIGHT: ESTIMATED NEW SURFACE COVERAGE OBTAINED AFTER THE LIGAND EXCHANGE WITH 0.10 EQUIV. OF BENZOIC ACID... 274
FIGURE 4.8 NOESY NMR SPECTRUM (C6D6) RECORDED GATHERED AFTER ADDITION OF 0.05 EQUIV. OF BENZOIC ACID TO COLLOIDAL SUSPENSION OF RUX(C7H15COOH)0.20 NPS. THE POSITIVE NOE IS HIGHLIGHTED IN GREEN CIRCLES. ... 275
FIGURE 4.9 TEM MICROGRAPHS OF (A) RUX(C7H15COOH)0.20 NPS, SCALE BAR: 50 NM; AND (B) RUX(C7H15COOH)0.20 NPS + 0.30 EQUIV. OF BAC, SCALE BAR: 50 NM. FAST NPS FREQUENCY COUNT IS PRESENTED FOR EACH SAMPLE. ... 276
LIST OF FIGURES
FIGURE 4.11 THEORETICAL MODELS REPRESENTING THE INTERACTION OF CARBOXYLIC MOIETIES WITH THE RU55 NP OVER THE (001) PLANE. (A) OCTANOIC ACID; (B) BENZOIC ACID; (C)
OCTANOATE; (D) BENZOATE. THE EADS (KCAL.MOL-1) ARE ALSO PRESENTED... 280
FIGURE 4.12 LIGAND EXCHANGE REACTIONS BETWEEN OCTANOIC AND BENZOIC ACIDS ONTO RU55 NP STUDIED BY DFT. ... 281
FIGURE 4.13 REPRESENTATION OF LIGAND EXCHANGE BETWEEN OCTANOIC AND BENZOIC ACIDS ACCORDING TO THE OBTAINED DFT ENERGIES FOR THE STUDIED REACTIONS. ... 283
FIGURE 4.14 1H-NMR (C 6D6) SPECTRA OF INITIAL RUX(C7H15COOH)0.20 NPS, REPRESENTED AS 0.20 EQUIV. OCAC, AND AFTER ADDITION OF OCTANOIC AND TFA. (BLUE) INITIAL NPS STABILIZED WITH 0.20 EQUIV. OF OCAC; (GREEN) RUX(C7H15COOH)0.20 NPS + 0.20 EQUIV. OF OCAC; (RED) RUX(C7H15COOH)0.20 NPS + 0.20 EQUIV. OF OCAC + 0.10 EQUIV. OF TFA. CHEMICAL SHIFTS OF THE PROTONS OF FREE OCTANOIC ACID (C7H15COOH) ARE GIVEN AS GREEN BARS AT THE BOTTOM ... 288
FIGURE 4.15 19F-NMR (C6D6) SPECTRA OF RUX(C7H15COOH)0.20+0.20 NPS AFTER THE ADDITION OF 0.10 EQUIV. OF TFA. THE DECONVOLUTION OF THE SPECTRUM AND CONTRIBUTION PERCENTAGE (%) OF THE SIGNAL ARE ALSO PRESENTED. ... 289
FIGURE 4.16 REPRESENTATION OF THE OCTANOIC ACID VS TRIFLUOROACETIC ACID LIGAND EXCHANGE WITH ESTIMATED NUMBERS OF EACH TYPE OF LIGAND SURROUNDING THE PARTICLES IN INITIAL RUX(C7H15COOH)0.20+0.20 NPS AND THOSE OBTAINED AFTER ADDITION OF 0.10 EQUIV. OF TFA. LIGAND STRONGLY ATTACHED (IS), WEAKLY INTERACTING (IW) AND IN EXCHANGE OR FREE (IF). ... 292
FIGURE 4.17 TEM MICROGRAPHS OF (A) RUX(C7H15COOH)0.20 NPS, SCALE BAR: 50 NM; (B) RUX(C7H15COOH)0.20+0.20 NPS, SCALE BAR: 50 NM; (C) RUX(C7H15COOH)0.20+0.20 NPS + 0.10 EQUIV. OF TFA, SCALE BAR: 50 NM. ... 294
FIGURE 4.18 THEORETICAL MODELS USED TO STUDY THE INTERACTION OF THE THREE CARBOXYLATES WITH THE RU55 NP OVER THE (001) PLANE. (A) OCTANOATE; (B) BENZOATE; (C) TRIFLUOROACETATE. THE EADS (KCAL.MOL-1) ARE GIVEN FOR EACH CASE. ... 296
FIGURE 5.1 EXAMPLE OF BIPYRIDINE-BASED RUTHENIUM (II) PHOTOSENSITIZER. [RU(BPY)3]2+. ... 304
FIGURE 5.2 REPRESENTATIVE DIAGRAM OF THE PS INCORPORATION ON PREFORMED RUNPS. ... 305
FIGURE 5.3 BIPYRIDINE-BASED RUTHENIUM COMPLEXES PHOTOSENSITIZERS USED FOR DFT CALCULATIONS... 307
FIGURE 5.4 OPTIMIZED THEORETICAL MODELS FOR THE INTERACTION OF PS1 (LEFT) & PS2 (RIGHT) MOLECULES WITH THE RU55(CH3COO)2(H)2. THE EADS (KCAL.MOL-1) ARE ALSO PRESENTED. ... 309
FIGURE 5.5 OPTIMIZED THEORETICAL MODELS FOR THE INTERACTION OF PS3 (LEFT) & PS4 (RIGHT) MOLECULES WITH RU55(CH3COO)2(H)2 NP. THE EADS (KCAL.MOL-1) ARE ALSO PRESENTED. ... 310
FIGURE 5.6 OPTIMIZED THEORETICAL MODELS FOR THE INTERACTION OF (A) PS1, (B) PS2 AND (C) PS4 MOLECULES WITH RU55(CH3COO)10(H)27 NP AND CORRESPONDING EADS (KCAL.MOL -1 ). ... 313
FIGURE 5.7 OPTIMIZED THEORETICAL CALCULATIONS FOR THE REACTION OF PS1 AND OF PS4 WITH RU55(CH3COO)12(H)29 NP. ... 314
FIGURE 5.8 OPTIMIZED THEORETICAL CALCULATIONS FOR THE INTERACTION OF PS1 WITH THE (A) RU55(CH3COO)10(H)27 NP AND (B) RU55(CH3COO)14(H)31 NP. THE EADS (KCAL.MOL-1) ARE ALSO PRESENTED. ... 317
FIGURE 6.1 3D BALL REPRESENTATION OF [RU(COD)(COT)] COMPLEX. ... 327
FIGURE 6.2 1H-NMR OF [RU(COD)(COT)]: (RIGHT) C7D8; (LEFT) CDCL3. ... 328
FIGURE 6.3 MAXIMUM NOE OBTAINED IN NOESY (SOLID LINE) AND ROESY EXPERIMENT (DASH LINE) AS A FUNCTION OF ΤC.[274] ... 334
FIGURE 6.4 ULTRA-SMALL RU55 MODEL. ... 339
FIGURE 6.5 RU55 HCP-BASED NP; DIFFERENT SURFACE SITES ARE HIGHLIGHTED.[82] ... 340
FIGURE 6.6 TRANSLATIONAL SYMMETRY OF THE SUPERCELL METHOD WITHIN PERIODIC-DFT CALCULATIONS: ORTHOROMBIC UNITCELL (A = 27.0 Å, B = 27.0 Å, C = 27.5 Å) THAT CONTAINS RU55(CH3COO)16H16 PERIODICALLY REPLICATED 3 X 3 X 3. ... 341
LIST OF SCHEMES
SCHEME 1.1 MECHANISM OF FORMATION OF MNPS DESCRIBED FOR THE METAL SALT REDUCTION METHOD. ... 36
SCHEME 1.2 HETEROGENEOUS AND HOMOGENEOUS FORMATION OF MNPS ACCORDING TO THE GROWTH PROCESS. ... 37
SCHEME 1.3 REPRESENTATION OF THE SYNTHESIS OF MNPS BY THE ORGANOMETALLIC APPROACH. ... 40
SCHEME 2.1 GENERAL SYNTHESIS PATHWAY OF NPS BY FOLLOWING THE ORGANOMETALLIC APPROACH. ... 66
SCHEME 2.2 REACTIONS PROFILE OF [RU(COD)(COT)] WITH VARIOUS TYPES OF PHOSPHINES.[156] ... 67
SCHEME 2.3 SYNTHESIS OF RUNPS STABILIZED BY 0.2 EQUIV. OF ETHANOIC ACID. ... 69
SCHEME 2.4 SYNTHESIS OF RUNPS STABILIZED BY 0.4 EQUIV. OF ETHANOIC ACID. ... 73
SCHEME 2.5 (A) HYDRODYNAMIC DIAMETER REPRESENTATION AND (B) FAST EXCHANGING LIGAND PROPOSED. ... 89
SCHEME 2.6 [RU6] NANOCLUSTER GEOMETRICAL ILLUSTRATION. ... 96
SCHEME 2.7 SURFACE HYDRIDES TITRATION BY A CATALYTIC REDUCTION OF 2-NORBORNENE IN THE PRESENCE OF RUX(CH3COOH)0.4 NPS. ... 105
SCHEME 2.8 SYNTHESIS OF RUNPS STABILIZED BY THF ... 118
SCHEME 2.9 REPRESENTATION OF THE POSSIBLE CONTINUOUS LIGAND EXCHANGE BETWEEN ETHANOIC ACID OR HYDROGEN AND THF. ... 120
SCHEME 3.1. MNPS STABILIZATION LAYER OF (A) COORDINATED LIGAND AND (B) POLYMER. Δ IS THE ADLAYER THICKNESS COMPARISON.[229] ... 140
SCHEME 3.2 SYNTHESIS OF RUNPS STABILIZED BY 0.4 EQUIV. OF PENTANOIC ACID (RUX(C4H9COOH)0.4). THE RESULTING NANOPARTICLE IS COVERAGE FOR PENTANOATE AND HYDRIDES AS IT IS EXPECTED FROM CHAPTER II. ... 143
SCHEME 3.3 PROPOSED CONFIGURATION FOR RUX(C4H9COOH)0.4 NPS ACCORDING TO SOLUTION 1H-NMR SPECTROSCOPY. ... 148
SCHEME 3.4 SYNTHESIS OF RUNPS STABILIZED BY OCTANOIC ACID IN THF. THE FORMED NANOPARTICLE IS EXPECTED TO BE COVERED BY OCTANOATES, HYDRIDES AND THF AS WERE FORESEEN IN CHAPTER II & SECTION 3.1. ... 184
SCHEME 3.5 LIGANDS INTERACTING WITH THE RUNPS SURFACE FOR (A) (RUX(C7H15COOH)0.40)THF VS (B) (RUX(C7H15COOH)0.15)THF... 201
SCHEME 3.6 SYNTHESIS OF RUNPS IN PENTANE USING 0.20 EQUIV. OF OCTANOIC ACID. THE FORMED RUX(C7H15COOH)0.20 NPS ARE EXPECTED TO BE COVERED BY OCTANOATES AND HYDRIDES. ... 204
SCHEME 3.7 GRAPHICAL REPRESENTATION OF TWO TYPES OF INTERACTING MOLECULES FOR RUX(C7H15COOH)0.20 NPS AS SUGGESTED BY DOSY NMR. (D1) STRONGLY COORDINATED LIGAND AND (D2) LIGAND WEAKLY COORDINATED IN FAST EXCHANGE. ... 222
SCHEME 3.8 REPRESENTATION OF THE SURFACE MAPPING OF RUX(C7H15COOH)0.20 NPS COMPLETED BY THE ESTIMATED NUMBERS OF EACH TYPE OF LIGAND PER RUNP. (IS) STRONGLY COORDINATED, (IW) WEAKLY COORDINATED AND (IF) “FREE”IN EXCHANGE. ... 225
SCHEME 3.9 HYDRIDES TITRATION AT THE SURFACE OF RUX(C7H15COOH)0.20 NPS BY THE NORBORNENE TEST. ... 229
SCHEME 3.10 APPROXIMATED COMPOSITION OF RUX(C7H15COOH)0.20 NPS ... 230
SCHEME 3.11 REPRESENTATION OF THE EVOLUTION OF THE QUANTITY OF IS AND IW LIGANDS DEPENDING ON THE QUANTITY OF LIGAND ADDED. THE SCHEME IS FOCUS ON THE RUNPS SATURATION THAT WAS OBTAINED FOR THE RUX(C7H15COOH)0.30 NPS. ... 241
SCHEME 4.1 SYNTHESIS OF RUNPS STABILIZED BY BENZOIC ACID IN THF-D8. ... 264
SCHEME 4.2 REPRESENTATION OF THE LIGAND EXCHANGE STUDIED BETWEEN C7H15COOH AND C6H5COOH ONTO PREFORMED RUX(C7H15COOH)0.20 NPS. ... 267
SCHEME 4.3 REPRESENTATION OF THE LIGAND EXCHANGE REACTION BETWEEN C7H15COOH AND CF3COOH AT STARTING FROM RUNPS SAMPLE RUX(C7H15COOH)0.20 NPS + 0.2 EQUIV. OCAC. ... 287
SCHEME 5.1 REPRESENTATION OF AN INCORPORATION OF A PS ADSORPTION ONTO CROWDED RU55 NP. (LEFT) PS1 AND (RIGHT) PS4 LIGAND ... 318
LIST OF TABLES
LIST OF TABLES
TABLE 1.1 CLOSE-PACKED MAGIC NUMBER CLUSTERS. THE REST OF THE METAL SURFACE ATOMS HIGHLIGHTED IN BLUE ARE LOCATED IN THE NP FACES. ... 31
TABLE 1.2 EXPERIMENTAL AND THEORETICAL TECHNIQUES FOR DETERMINING RUNPS PROPERTIES. ... 51
TABLE 2.1 NUMBER OF ATOMS FOR METAL NANOPARTICLE OF 1.0 AND 2.0 NM IN SIZE FOLLOWING THEIR TYPICAL CRYSTALLINE STRUCTURE. ... 60
TABLE 2.2 EDX ANALYSIS FOR ELEMENT QUANTIFICATION OF OXYGEN & RUTHENIUM RATIO IN COMPARISON WITH THE EXPERIMENTAL SYNTHESIS RELATION FOR RUX(CH3COOH)0.2 NPS. . 72
TABLE 2.3 EDX ANALYSIS FOR ELEMENT QUANTIFICATION OF OXYGEN & RUTHENIUM RATIO RATIO IN COMPARISON WITH THE EXPERIMENTAL SYNTHESIS RELATION FOR RUX(CH3COOH)0.4 NPS. ... 77
TABLE 2.4 OPTIMIZED STRUCTURES USED FOR THE DFT SURFACE TITRATION. THE TOTAL NUMBER AND COVERAGE RATIO OF COORDINATED LIGANDS ARE ALSO SHOWN WITH THE CORRESPONDING DFT ENERGY (EV). (A) NUMBER OF HYDRIDES THAT COME FROM THE DISSOCIATIVE ADSORPTION OF H2; (B) TOTAL NUMBER OF HYDRIDES I.E. THAT COMES FROM A AND FROM THE CH3COO-H BOND DISSOCIATION. ... 108
TABLE 2.5 OPTIMIZED STRUCTURES USED FOR THE (𝒑𝑯𝟐, [THF]) PHASE DIAGRAM. LIGAND COVERAGE RATIOS ARE ALSO SHOWN WITH THE CORRESPONDING DFT ENERGY (EV). (A) NUMBER OF HYDRIDES THAT COME FROM THE DISSOCIATIVE ADSORPTION OF H2. ... 122
TABLE 3.1 SWEEP OF PENTANOIC ACID MOLAR EQUIVALENTS USED FOR THE SYNTHESIS OF RUNPS. * PREVIOUSLY DESCRIBED. ... 155
TABLE 3.2 SCOPE OF PENTANOIC ACID QUANTITY USED FOR THE RUNPS SYNTHESIS WITH THEIR CORRESPONDING MEAN SIZE AND SIZE DISPERSION OBTAINED BY TEM ANALYSES. ... 160
TABLE 3.3 DIFFERENT GROUPS FOUND BY SWEEPING THE PENTANOIC ACID CONCENTRATION FOR THE RUNPS SYNTHESIS. ... 160
TABLE 3.4 DOSY ANALYSES PERFORMED ON A SCOPE OF RUNPS STABILIZED BY DIFFERENT QUANTITY OF PENTANOIC ACID WITH THEIR CORRESPONDING DIFFUSION COEFFICIENTS, CALCULATED HYDRODYNAMIC DIAMETER AND ESTIMATED SIZE RUNPS SPECIES. ... 166
TABLE 3.5 COMPARISON BETWEEN THE DATA OBTAINED BY TEM STUDIES VS DOSY ANALYSES FOR RUNPS SYNTHETIZED WITH DIFFERENT QUANTITIES OF PENTANOIC ACID. ... 168
TABLE 3.6 ELEMENTAL ANALYSIS OF RUX(C4H9COOH)0.3 NPS ... 171
TABLE 3.7 OPTIMIZED STRUCTURES USED FOR THE RUX(C4H9COOH)0.3 DFT SURFACE TITRATION. THE TOTAL NUMBER AND COVERAGE RATIO OF COORDINATED LIGANDS ARE ALSO GIVEN WITH ITS CORRESPONDING DFT ENERGY (EV). (A) NUMBER OF HYDRIDES THAT COME FROM THE DISSOCIATIVE ADSORPTION OF H2; (B) TOTAL NUMBER OF HYDRIDES I.E. THAT COMES FROM A AND FROM THE C4H9COO-H BOND DISSOCIATION. ... 174
TABLE 3.8 DFT TITRATION COMPARISON BETWEEN RUX(CH3COOH)0.4 AND RUX(C4H9COOH)0.3 NPS. ... 177
TABLE 3.9 H2 DISSOCIATIVE ADSORPTION GIBBS FREE ENERGY (ΔGH) COMPARISON IN DIFFERENT RU55 NP SITES BETWEEN RU55(CH3COO)16(H)16 AND RU55(C4H9COO)14(H)14 MODELS. ... 180
TABLE 3.10 COMPARISON OF THE MEAN SIZES OF RUNPS (OBTAINED BY TEM) STABILIZED WITH THE SAME AMOUNT OF ETHANOIC, PENTANOIC AND OCTANOIC ACID. SOLVENT (A) PENTANE; (B) THF. ... 186
TABLE 3.19 OPTIMIZED STRUCTURES USED FOR THE RUX(C7H15COOH)0.20 DFT SURFACE TITRATION. THE TOTAL NUMBER AND COVERAGE RATIO OF COORDINATED LIGANDS AND ITS
CORRESPONDING DFT ENERGY (EV) ARE ALSO PROVIDED. (A) NUMBER OF HYDRIDES COMING FROM THE DISSOCIATIVE ADSORPTION OF H2; (B) TOTAL NUMBER OF HYDRIDES COMING
FROM A AND FROM THE C7H15COO-H BOND DISSOCIATION. ... 233
TABLE 3.20 COMPARISON BETWEEN THE EXPERIMENTAL AND THEORETICAL SURFACE COVERAGE CHARACTERIZATION OF RUX(C7H15COOH)0.20 NPS. ... 236
TABLE 3.21 COMPARISON BETWEEN EXPERIMENTAL AND THEORETICAL TITRATIONS OF RUNPS STABILIZED BY THE STUDIED CARBOXYLIC ACID. ... 237
TABLE 3.22 ESTIMATED QUANTITIES OF THE DIFFERENT TYPE OF INTERACTING LIGANDS IN THE RUX(C7H15COOH)0.20 NPS DETERMINED BY DOSY NMR DATA. ... 240
TABLE 3.23 HYDRODYNAMIC DIAMETERS VS THE EXTRA-LIGAND ADDED FOR PREFORMED RUX(C7H15COOH)0.20 NPS. ... 242
TABLE 3.24 H2 DISSOCIATIVE ADSORPTION GIBBS FREE ENERGY (ΔGH). COMPARISON BY DIFFERENT RU55 NP SITES OF RU55(CH3COO)16(H)16, RU55(C4H9COO)14(H)14 AND RU55(C7H15COO)14(H)14 MODELS. ... 251
TABLE 4.1 DIFFUSION COEFFICIENTS OF OCTANOIC ACID AND BENZOIC ACID MOIETIES AND CORRESPONDING SIGNAL WEIGHT FOR EACH ADDITION OF BENZOIC ACID TO COLLOIDAL SUSPENSION OF RUX(C7H15COOH)0.20 NPS... 271
TABLE 4.2 MAPPING OF THE RUNPS SURFACE AFTER LIGAND EXCHANGE EXPERIMENTS BETWEEN OCTANOIC AND BENZOIC ACID. ... 272
TABLE 4.3 DFT ENERGIES OBTAINED FOR LIGAND EXCHANGE REACTIONS BETWEEN OCTANOIC AND BENZOIC ACID ONTO RU55 NP. ... 282
TABLE 4.4 AVERAGE ADSORPTION ENERGY IN RU55 NP COVERED BY OCTANOATES AND A MIXTURE OF CAPPED LIGANDS. ... 284
TABLE 4.5 DIFFUSION COEFFICIENTS OF OCTANOIC ACID MOIETIES AND CORRESPONDING SIGNAL WEIGHT FOR THE ADDITION OF TFA TO A COLLOIDAL SUSPENSION OF RUX(C7H15COOH)0.20+ 0.20 NPS. ... 290
TABLE 4.6 DOSY NMR DATA EXTRACTION OF THE QUANTITY OF DIFFERENT TYPE OF INTERACTING LIGANDS IN THE RUX(C7H15COOH)0.20+0.20 NPS. ... 291
TABLE 4.7 COMPARISON OF THE LIGAND EXCHANGE REACTION DEPENDING ON THE NATURE OF THE INCOMING LIGAND, NAMELY BENZOIC ACID OR TRIFLUOROACETIC ACID. THE DATA CORRESPOND TO THE ADDITION OF 0.10 EQUIV. OF EACH INCOMING LIGAND. ... 293
TABLE 5.1 COMPARISON OF ADSORPTION ENERGIES FOR DIFFERENT PS ONTO RU55 NP WITH LOW AND INTERMEDIATE SURFACE COVERAGE WITH THAT OF TWO ETHANOATES IN THE SAME CONDITIONS. ... 312
TABLE 5.2 DFT REACTION ENERGIES FOR THE LIGAND EXCHANGE REACTION BETWEEN RU55(CH3COO)12(H)29 NP AND PS1 & PS4... 315
TABLE 5.3 COMPARISON OF ADSORPTION ENERGIES FOR PS1 ONTO DIFFERENT RU55 NP MODELS (AT LOW, INTERMEDIATE AND HIGH SURFACE COVERAGE RATIO) WITH THAT OF TWO ETHANOATES IN THE SAME CONDITIONS. ... 316
TABLE 5.4 DFT REACTION ENERGY FOR THE LIGAND EXCHANGE REACTION BETWEEN RU55(CH3COO)16(H)33 NP AND PS1 ... 317
TABLE 6.1. DIFFERENT QUANTITIES OF LIGAND USED FOR RUNPS SYNTHESIS. ... 329
TABLE 6.2 BENZENE AND THF VISCOSITY IN RELATION WITH THEIR TEMPERATURE. ... 334
TABLE A.1 HYDROGEN COVERAGE RATIO, HYDROGEN COORDINATION MODES, DFT ENERGY OF THE OPTIMIZED STRUCTURES AND HYDROGEN MEAN ADSORPTION ENERGY. ... 379
TABLE A.2 RU55 NP ADSORPTION SITE OF ETHANOIC ACID, CH3COOH COORDINATION MODE, DFT ENERGY OF THE OPTIMIZED STRUCTURE AND ETHANOIC ACID ADSORPTION ENERGY... 380
TABLE A.3 RU55 NP ADSORPTION SITE OF ETHANOATE, (CH3COO) COORDINATION MODE, DFT ENERGY OF THE OPTIMIZED STRUCTURE AND ETHANOATE ADSORPTION ENERGY. ... 380
TABLE A.4 HYDROGEN COVERAGE RATIO, RU55 NP ADSORPTION SITE OF ETHANOIC ACID AND COORDINATION MODE, DFT ENERGY OF THE OPTIMIZED STRUCTURE AND ETHANOIC ACID ADSORPTION ENERGY. ... 381
TABLE A.5 HYDROGEN AND THF COVERAGE RATIO, THF ADSORPTION SITE IN Η MODE, DFT ENERGY OF THE OPTIMIZED STRUCTURE AND THF MEAN ADSORPTION ENERGY. ... 381
TABLE A.6 ETHANOATE & HYDROGEN COVERAGE RATIOS, (CH3COO) & H COORDINATION MODES, DFT ENERGY OF THE OPTIMIZED STRUCTURE AND CARBOXYLIC MOIETY MEAN ADSORPTION ENERGY. ... 382
TABLE B.1 PENTANOATE & HYDROGEN COVERAGE RATIOS, (C4H9COO) & H COORDINATION MODES, DFT ENERGY OF THE OPTIMIZED STRUCTURE AND PENTANOATE MEAN ADSORPTION ENERGY. ... 386
TABLE B.2 OCTANOATE & HYDROGEN COVERAGE RATIOS, (C7H15COO) & H COORDINATION MODES, DFT ENERGY OF THE OPTIMIZED STRUCTURE AND OCTANOATE MEAN ADSORPTION ENERGY. ... 387
TABLE B.3 STUDIED CARBOXYLIC MOIETIES DEPOSED ONTO THE SAME ADSORPTION SITE OVER THE PLANE [100], DFT ENERGY OF THE OPTIMIZED STRUCTURE AND CARBOXYLIC MOIETY ADSORPTION ENERGY. ... 388
TABLE B.4 OCTANOATE, BENZOATE & H COVERAGE RATIOS, DFT ENERGY OF THE OPTIMIZED STRUCTURE AND CARBOXYLIC MEAN ADSORPTION ENERGY. ... 388
TABLE B.5 DFT ENERGY OF THE OPTIMIZED RU55(CH3COO)2(H)2 STRUCTURES INTERACTING WITH DIFFERENT PHOTOSENSITIZER AND ITS ADSORPTION ENERGY. ... 389
TABLE B.6 DFT ENERGY OF THE OPTIMIZED RU55(CH3COO)10(H)27 STRUCTURES INTERACTING WITH DIFFERENT PHOTOSENSITIZER AND ITS ADSORPTION ENERGY. ... 389
TABLE B.7 DFT ENERGY OF THE OPTIMIZED RU55(CH3COO)14(H)31 STRUCTURES INTERACTING WITH PS1 AND ITS ADSORPTION ENERGY. ... 389
TABLE C.1 ETHANOATE & HYDROGEN COVERAGE RATIOS, DFT ENERGY OF THE OPTIMIZED STRUCTURE AND ETHANOIC ACID ADSORPTION ENERGY. ... 390
TABLE C.2 ETHANOATE & HYDROGEN COVERAGE RATIOS, DFT ENERGY OF THE OPTIMIZED STRUCTURE AND THF MEAN ADSORPTION ENERGY. ... 390
TABLE C.3 ETHANOATE & HYDROGEN COVERAGE RATIOS, DFT ENERGY OF THE OPTIMIZED STRUCTURE AND THF MEAN ADSORPTION ENERGY. ... 391
TABLE D.1 HYDROGEN COORDINATION MODES AND THEIR CORRESPONDING VIBRATIONAL FREQUENCIES (RU-H) ONTO RU55 NP. ... 392
LIST OF TABLES
TABLE E.1 ETHANOATE & HYDROGEN COVERAGE RATIOS, H COORDINATION SITE IN Μ MODE, HYDROGEN ADSORPTION ENERGY AND HYDROGEN GIBBS FREE ENERGY. ... 394 TABLE E.2 PENTANOATE & HYDROGEN COVERAGE RATIOS, H COORDINATION SITE IN Μ MODE, HYDROGEN ADSORPTION ENERGY AND HYDROGEN GIBBS FREE ENERGY. ... 395 TABLE E.3 OCTANOATE & HYDROGEN COVERAGE RATIOS, H COORDINATION SITE IN Μ MODE, HYDROGEN ADSORPTION ENERGY AND HYDROGEN GIBBS FREE ENERGY. ... 395
ABBREVIATIONS
Å: Angstrom
AIM: Atoms in Molecule AO: Atomic Orbital
ATR-FTIR: Attenuated Total Reflectance Fourier-Transform Infrared
BDE: Bond-Dissociation Energy
BEP: Brønsted-Evans-Polanyi (BEP) Relations.
bpy: Bipyridine
cc-pvdz: Correlation-Consistent Polarized Valance Double Zeta Basis Set cc-pvtz: Correlation-Consistent Polarized
Valance Triple Zeta Basis Set
CINEB: Climbing Image Nudge Elastic Band
13
CO: 13C Labeled Carbon monoxide COD: 1,5-Cyclooctadiene (C8H12)
COT: 1,3,5-Cyclooctatriene (C8H10)
CP-MAS: Cross Polarization - Magic Angle Spinning
DFT: Density Functional Theory DOSY: Diffusion-Ordered Spectroscopy dppb: bis-(diphenylphosphino)butane
(C28H28P2)
EA: Elemental Analysis
EDX: Energy-Disperse X-Ray Spectroscopy
EtAc: Ethanoic acid (CH3COOH)
FFT: Fast-Fourier Transform FTIR: Fourier-Transform Infrared FTS: Fisher-Tropsch Synthesis GC: Gas Chromatography
GGA: Generalized Gradient Approach GIAO: Gauge Including Atomic Orbital GIPAW: Gauge Including Projected
Augmented Wave
hcp: Hexagonal Close Pack
HDA: Hexadecylamine (CH3(CH2)15NH2)
HEC: Hydrogen Evolution Catalyst HER: Hydrogen Evolution Reaction Hz: Hertz
ICP-AES: Inductively Coupled Plasma Atomic Emission Spectroscopy
IEFPCM: Integral Equation Formalism Polarizable Continuum Model
MAS: Magic Angle Spinning MEP: Minimum Energy Pathway MNPs: Metal Nanoparticles MPA: Mulliken Population Analysis MS: Mass Spectrometry
ABBREVIATIONS
NMR: Nuclear Magnetic Resonance NOESY: Nuclear Overhauser Effect
Spectroscopy
NPA: Natural Populations NPs: Nanoparticles
OcAc: Octanoic acid (C7H15COOH)
PAW: Projector Augmented Waves Method
PBE: Perdew-Burke-Ernzerhof Functional pCOHP: Projected Crystal Orbital
Hamilton Populations
pDOS: Projected Density of States PDT: Photodynamic Therapy PentAc: Pentanoic acid (C4H9COOH)
pMPA: Projected Mulliken Population Analysis
PS: Photosensitizer
PTA: 1,3,5‐Triaza‐7‐phosphaadamantane
(C6H12N3P)
QSE: Quantum Size Effects r.t.: Room Temperature
RDF: Radial Distribution Function RuNPs: Ruthenium Nanoparticles SDD-ECP: Stuttgart-Dresden Relativistic
Effective Core Potential SMD: Solvation Model Density
TEM: Transmission Electron Microscopy THF: Tetrahydrofuran (C4H8O)
TFA: Trifluoroacetic acid (CF3COOH)
TMS: Tetramethylsilane (Si(CH3)4)
TS: Transition State TST: Transition State Tool
VASP: Vienna Ab initio Simulation Package
WAXS: Wide-Angle X-ray Scattering WOC: Water Oxidation Catalyst WOR: Water Oxidation Reaction ZPE: Zero-Point Energy
GENERAL
INTRODUCTION
The search for renewable energy is one the greatest challenges of our modern society. Even when sunlight can be considered as an almost inexhaustible source of energy, that could bring our world to adopt a new paradigm of sustainable development, harnessing it requires its
conversion to storable fuels, such as hydrogen (H2).([1],[2]) Having this in mind, this PhD manuscript
is an upstream study in the general context of the solar hydrogen production via photocatalytic water splitting, as illustrated in the image hereafter.
General Introduction
Two combined catalytic reactions are involved in the photoproduction of hydrogen from water: hydrogen evolution (HE) and water oxidation (WO). However, each reaction of this green
route needs to be improved. The rational design of catalysts,([3],[4]) as well as the understanding of
their photophysical and catalytic properties, are real challenges. Metal nanoparticles (MNPs) have
been reported as efficient HE and WO catalysts.([5]–[7]) Such nanomaterials have shown to exhibit
high electrocatalytic activities, with respect to WO and HE reactions, with a low overpotential. Among other factors, comparison with bulk materials brings out the importance of using materials that possess a high surface area as catalysts for water splitting process. The main drawback of such catalysts lies in their cost, which is significantly higher than state-of-the-art catalysts. Therefore, it is necessary to develop MNPs that can be used as a better alternative.
Different ruthenium-based nanomaterials with various composition, morphologies, structures and sizes have been reported in the literature as catalyst for water splitting process. In particular, ruthenium nanomaterials have proven to be interesting alternatives to Pt and Pd based
catalysts for HER.[8] Improvement of the electrocatalytic performance of ruthenium nanoparticles
(RuNPs) compared to that of Ru black powder has been established and attributed to the greater specific area that the RuNPs display. Very recently, the potential of RuNPs stabilized with
phenylpyridine or MeOH/THF for the HER has been demonstrated.[5],[9]
Regarding RuNPs, despite their diversity, there is still a need to modify their surface in order to improve their properties and functionality. The physical and chemical properties of RuNPs depend on their structural characteristics like their shape, size, defects, but also on the nature of capping ligands used to stabilize them and on the number of adsorbed species onto the metal surface. Although carboxylic acids are widely used as surfactants in colloidal synthesis, the direct adsorption of carboxylic acids onto ruthenium metal surfaces has received less attention.
For this purpose, we started studying the surface properties of RuNPs stabilized by carboxylic acids as model systems. Alkyl chains with different lengths are considered. On the experimental side, RuNPs were synthesized following the organometallic approach using ethanoic (EtAc), pentanoic (PentAc) and octanoic acid (OcAc) as stabilizers. TEM characterization revealed small NPs with a homogeneous morphology and good dispersion. The surface state of these RuNPs was probed by analytical techniques such as IR, WAXS, NMR, etc., leading to a trustful mapping of their surface. Once the optimal ligand ratio to get RuNPs of similar sizes and their synthetic conditions were established, it was possible to determine the influence of the alkyl chain length of the carboxylic acid ligands on the surface properties of the NPs.
In parallel, density functional theory (DFT) calculations were performed according to a thermodynamic model fed with DFT energies. Also, a systematic analysis of the bond properties and of the electronic states (Density of States, Crystal Orbital Hamilton Population, atomic charges) was carried out.
DFT calculations of the vibrational features of model Ru55 NPs and of the chemical shifts of
model [Ru6] clusters also allowed to corroborate the spectroscopic experimental assignations.
Spectroscopic data as well as DFT mechanistic studies showed that the carboxylic acids lie on the metal surface as carboxylates, together with hydrogen atoms. The experimental and theoretical titration results are in good agreement, indicating it as a relevant step to build a model to understand the ligand influence on RuNPs properties.
For the optimal surface composition, the hydrogen adsorption Gibbs free energy was found
close to the 0 kcal.mol-1 criterion which, according to the seminal work of NØrskov et al.,[10] makes
these RuNPs a promising HEC. As a result, the best nanocatalyst revealed to have both, intermediate crowded metal surface and intermediate alkyl chain length for the capping ligand, indicating the RuNPs stabilized by pentanoic acid as the most promising catalyst.
Since RuNPs are known to be active catalysts for the reduction of arenes, the direct use of a polypyridyl complex as stabilizer during the synthesis of RuNPs under hydrogen atmosphere may lead to the reduction of the bipyridine ligands. To circumvent this potential issue, synthesis PS-modified RuNPs can be envisaged by a ligand exchange method. For this purpose, exchange ligand viability studies have been performed starting from RuNPs pre-stabilized with octanoic acid and exposed to incoming ligands (benzoic and trifluoroacetic acids). Moreover, theoretical studies
General Introduction
on the reliability of this procedure with actual photosensitizers, namely [Ru(bpy)x(bpy-(RCOOH)x)
3-x]2+, were performed.
This thesis dissertation is divided into six chapters.
The first chapter gives a general overview to situate this work in the current context based on bibliographic data. In general, it presents the interests of metal nanoparticles (MNPs) according with their novel properties. Furthermore, a focus is given on the synthesis and catalytic properties of RuNPs. Also, DFT methods for modelling MNPs are described.
The second chapter is dedicated to the experimental and theoretical description of RuNPs stabilized by ethanoic acid, where it can be found a complete surface mapping of this optimized nanosystem together whit its viability for HER.
Meanwhile, in chapter three the optimal surface coverage of RuNPs stabilized by pentanoic and octanoic acid is described by a combination of experimental and theoretical tools. The viability of these catalysts and the ligand alkyl chain length influence on the formation and activity of RuNPs are deeply discussed.
In the fourth chapter are presented studies of ligand exchange at the surface of preformed RuNPs stabilized by octanoic acid when adding benzoic or trifluoracetic acids. These studies were boarded as prove of content for the viability of this strategy to anchor photosensitizers with carboxylic acid pending groups onto the surface of preformed RuNPs. This approach has been theoretically studied as presented in the chapter five.
The sixth chapter deals with the experimental and theoretical techniques used for the development of this PhD work. At the end of the manuscript, several appendices can be found that include the calculated DFT energies and general information utilized for theoretical calculations.
CHAPTER I
General
Background
1.1 Metal Nanoparticles: Interests, Properties and
Applications
In the past twenty five years, metal nanoparticles (MNPs) have been strongly attracting the attention of the scientific community and enterprises due to their unique properties located
between those of bulk materials and molecules.([11],[12]) It is well-known that controlling the
structure of these nanomaterials can directly influence their physical and chemical properties, that can be of interest for applications in various fields ranging from biology, medicine, optoelectronics,
catalysis, energy, etc.[13] Especially, their catalytic reactivity can be tuned by a fine control of their
structure,[14] leading to novel characteristics contrasting to that exhibited by molecules and bulk
materials.([15],[16])
MNPs have a different chemical and physical behaviors due to their electronic change when reaching a critical nanoscale size, [1 – 100 nm]. For example the decrease in its boiling and
melting point[17] or the change in its optical properties (color).[18] In comparison to bulk materials,
the size reduction towards the nanoscale carries a decrease in the electron mobility (delocalized
electrons) that leads to quantum size effects (QSE).[19] As a consequence, the properties of MNPs
do not follow the same rules as those of bulk materials because of the appearance of particular nano-effects.
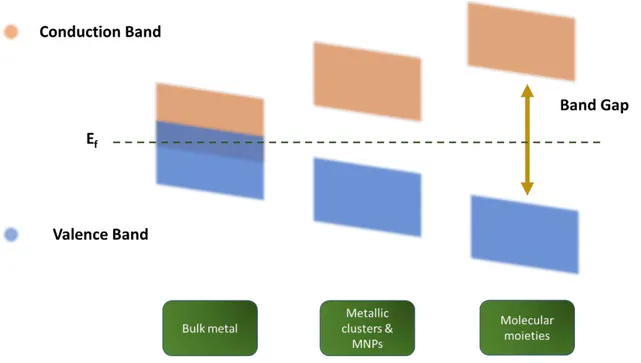
The particular properties of MNPs can be explained in terms of QSE by describing the relationship between the valence and conduction band in these materials. In bulk metals these bands at some point overlap leading to a partial occupation of the conduction band by the valence electrons (s & d). This lets highly mobile electrons which are responsible for the electrical conductivity of these materials. When the valence and conduction bands are slightly separated by a gap, materials act as semiconductor materials. However, if the observed gap is too large, materials are named as insulators.
The continuum band existing in bulk metals begins to separate when the quantity of metal atoms in the material decreases which is the case in nanomaterials. Meaning that the band overlapping does not longer exist, and the material tends to be a semiconductor. The gap between the valence and the conduction bands increases while the material size decreases till getting a similar situation as for molecular entities where discrete energy levels exist (figure 1.1). At this
CHAPTER I MNPs Properties and Applications point, the properties of bulk metals are replaced for those of quantum dots which follow the quantum mechanical rules. This induces a change in the electronic properties of nanomaterials, making it metal nanoparticles to display intermediate properties comparatively to those of bulk
metals and molecular species.[20]
Figure 1.1 Energy level diagram from bulk metal to molecular moieties.
The previous phenomenon is particularly true for metal nanoparticles in the size range [1 10 nm] because they are expected to exhibit an intermediate state among bulk metal and molecular moieties. As it was described, in this size range the properties of the material is highly dependent on the number of metal atoms held into the nanocluster, this phenomenon is explained due to the change in the quantized energy levels, the so-called quantum size effect (figure 1.2).
Figure 1.2 Representation of the quantum size effect and discrete electronic energy levels in MNPs.
Additionally, the properties of MNPs are dependent of the number of metal atoms present at their surface compared to the ones of the core. The surface to volume ratio increases with the size reduction of the MNPs, which makes very small NPs to have high quantities of surface atoms. Given their higher surface-to volume ratio compared with bulk metal entities (figure 1.3), MNPs display higher numbers of potentially active surface sites, making them to be highly attractive
systems for several applications such, as catalysis.[15]
CHAPTER I MNPs Properties and Applications Furthermore, nanoparticles can be tuned with different shapes (like spheres, cubes, wires, etc.) and diverse crystallographic facets. MNPs can be designed to contain different types of atoms depending on their location in corners, faces or edges, that will present different reactivity
properties, which can be of interest for selective catalysis.[21]
Well-crystallized MNPs have close packed structures (bcc, fcc or hcp) where the central atom is surrounded by successive layers of atoms in order to decrease their surface energy. They are considered as full-shell clusters and the magic number rules for them can be applied, allowing to obtain several data on the different atoms presented in the outer and inner shell of the
materials.[22] For example, a full-shell cluster containing a total of 13 atoms, which is the smallest
possible size, apart from the central atom, the surface layer is made of 12 atoms corresponding to the maximum possible coordination number. Larger clusters will contain a total number of atoms as 55, 147, 309, etc., leading to NPs of ca. 1.1, 1.6 and 2.0 respectively, in the case of ruthenium. The ratio of surface metal atoms in NPs is accessible by knowing the NP crystalline structure and
the mean size.[23]
In addition, it is possible to calculate the approximate number of metal atoms depending
on their location at the surface of the NPs, i.e. edges, corners and faces (table 1.1).[24] It can be
observed that smaller the NPs are, higher their surface atom numbers are. Some NPs have been
Table 1.1 Close-packed magic number clusters. The rest of the metal surface atoms highlighted in blue are located in the NP faces. General description Number of shells 1 2 3 4 Size of RuNP (nm) 0.7 1.1 1.6 2.0 Total number of metal atoms 13 55 147 309 Number of surface atoms (%) 92 76 63 52 Edge atoms (%) 0 54 41 29 Corner atoms (%) 92 22 8 2
Thus, at very small sizes ([1.0 - 2.0 nm]) the properties of MNPs can be highly variable due to their difference in metal surface area, size, shape, composition, crystalline structure, etc. Therefore, a precise control of MNPs size, stability and reactivity becomes crucial. Meaning that the synthesis of MNPs has a major impact or a direct correlation in modifying the energy gap, which is part of the novel properties of these materials.
The potential of MNPs in catalysis has been known since decades through the development of heterogeneous catalysts where metal nanoparticles are deposited into a
support.[26] In the last 25 years, the field of MNPs has known a renewed interest with numerous
efforts devoted to their controlled synthesis, which is a great advantage for an accurate study of their catalytic properties and make them suitable for a target reaction.
The use of MNPs in catalysis (figure 1.4) is based on the assumption of their high metal surface area, where surface active sites may have a direct interaction with the substrates, thus
CHAPTER I MNPs Properties and Applications mimicking homogeneous catalysts. But due to their low solubility in reaction solvents, which depends on the stabilizing agents used for their synthesis, MNPs are often described as a
semi-heterogeneous catalyst.[27] Moreover, catalysis is considered as colloidal when MNPs form
stable suspensions in the reaction solvent (aqueous or organic). In the other hand, supported catalysis concerns to MNPs deposited onto or in the pores of a support (carbon-based materials,
metal oxide materials such as SiO2, TiO2, Al2O3, etc.).
Figure 1.4 Nanocatalyst are claimed to have better activity and selectivity than that of bulk materials.[28]
Published studies have demonstrated that metal nanoparticles are more active than their
bulk metal material counterparts for several catalytic reactions ([14],[29],[30]) Some of these reactions
are for instance:
Reforming reaction Hydrocracking Heck type couplings
McMurry couplings Hydrosilylation Suzuki couplings
Figure 1.5 MNPs used in the water splitting reaction. a) HER[31]
& b) OER.[32]
Since a precise control of the MNPs characteristics (size, shape, crystalline structure, etc.), stability and surface reactivity are crucial for their application in catalysis, different synthesis tools have been developed.
1.2 Synthesis of Metal Nanoparticles
With the noticeable exception of some 11 superatomic clusters that are electron- and
atom-precise compounds,([33]–[35]) nanostructures with well-defined structures (nanoclusters) are
not often found in the literature. In most cases, nanosystems presenting a lower crystalline order in their outer and inner structures are reported. This is particularly true for very small NPs which are often less crystallized. In this context the materials are named as nanoparticles, nanostructure, colloids or nanosystems.
There are two main methodologies to synthesize MNPs (figure 1.6). The top-down procedure involves the granulating of bulk materials to reduce their size by different physical methodologies (thermal and mechanical) or chemical grinding and the subsequent stabilization of the generated material by adding a protective agent. Nevertheless, this approach produce
irreproducible materials with non-controlled size.[36]
The other technique, bottom-up, is widely used by the scientific community interested in catalysis because it can provide nanoparticles with well-controlled size, structure and surface which is crucial for designing a reliable catalyst. Additionally, this methodology allows to get
CHAPTER I Synthesis of MNPs reproducible nanosystems that can be deeply analyzed and characterized. This approach is based on the release of metal atoms, followed by their nucleation into seeds or nuclei and then the growth of NPs till certain size is reached. The growth is determined by the reaction medium or/and
the presence of protective ligands.[37]
Figure 1.6 Main approaches for the synthesis of MNPs.[38]
1.2.1 Synthesis of MNPs in Solution
Our goal in this work was to synthetize well-defined metal nanoparticles which can be studied by an experimental and theoretical approach. Therefore, a bottom-up type of synthesis
was chosen. MNPs can be formed in diverse ways, either in vapor (flame synthesis)[39] or solution.
Due to experimental performance, instruments and basically to the difficulties met in the NPs synthesis, solution methodology was selected as the synthesis approach of MNPs.
Synthesis of MNPs in solution usually offers homogeneous populations with narrow size distributions. However, this depends on the mechanism of NPs formation and consequently on the reaction conditions.
1.2.2 Formation Mechanism of MNPs
The uniformity and reproducibility of MNPs populations depend on the nucleation
mechanism and the subsequent growth of them.[27]
Whilst the formation of MNPs has been described by the LaMer mechanism for supersaturate reaction media, however this approach was not accurate enough to describe diluted
systems.[48] The gradual formation of nanoparticles is based on a three step process: nucleation,
growth and agglomeration.[49] In the past decade, a four-step general mechanism has also been
published for the salt reduction method that consist in two autocatalytic surface steps, namely


![Figure 2.1 Nanomaterials size in comparison with organic and inorganic structures. [139]](https://thumb-eu.123doks.com/thumbv2/123doknet/13479618.413251/61.918.173.751.105.337/figure-nanomaterials-size-comparison-organic-inorganic-structures.webp)