DATA-POP ALLIANCE
WHITE PAPER SERIES
Beyond Data Literacy:
Reinventing Community
Engagement and Empowerment
in the Age of Data
September 2015
DATA-POP ALLIANCE
WHITE PAPER SERIES
Beyond Data Literacy:
Reinventing Community
Engagement and
Empowerment in the Age
of Data
September 2015
Table of Contents
Foreword ... i
Glossary of key terms and concepts ... ii
Executive Summary ... iv
Introduction ... 1
1 Genesis, contours and limits of ‘data literacy’ ... 3
1.1 Data literacy: an emerging concept of the ‘Data Revolution’ ... 3
1.2 Data literacy as competencies of an extractive and transformative industry? ... 5
1.3 Reconsidering ‘data literacy’ through the lens of history ... 6
2 Moving from ‘data literacy’ towards ‘literacy in the age of data’ ... 7
2.1 Attempt at (re)defining ‘data literacy’ ... 7
2.2 Foundational pillars of ‘data literacy’ ... 10
2.3 Conceptualizing ‘data literacy’ as ‘literacy in the age of data’ ... 15
3 Promoting data literacy for and via social inclusion ... 16
3.1 Making Big Data small(er) ... 16
3.2 Understanding and designing for data literacy and inclusion using human-‐ centered approaches ... 19
4 Fostering social inclusion as data inclusion ... 20
4.1 Understanding and leveraging the power of words and language(s) ... 20
4.2 Politicizing the (Data) Revolution: towards data inclusion ... 23
Concluding Remarks: The data revolution, data inclusion and data generations ... 25 Appendices ... a
Appendix 1: “Data science without conscience….” ... a
Appendix 2: Claude Lévi-‐Strauss on writing and illiteracy programs in the original ... c
Appendix 3: Literacy throughout history ... d
Appendix 4: The evolution of programming languages ... e
Foreword
About this document
This document is part of Data-Pop Alliance’s White Papers Series developed in collaboration with our partners. This White Paper was developed in collaboration with the Internews Center for Innovation and Learning—who also provided funding—and researchers from the MIT Media Lab Center for Civic Media, as well as Data-Pop Alliance.
Data-Pop Alliance is a coalition on Big Data and development jointly created by the Harvard Humanitarian Initiative (HHI), the MIT Media Lab, and the Overseas Development Institute (ODI) to promote a people-centred Big Data revolution.
About the co-authors
This paper was written by the following co-authors:
• Rahul Bhargava, Researcher, MIT Media Lab Center for Civic Media
• Erica Deahl, Innovation Specialist, 18F, General Services Administration; formerly graduate student and research assistant, MIT Media Lab Center for Civic Media
• Emmanuel Letouzé (Lead and corresponding author), Director and co-Founder, Data-Pop Alliance; Visiting Scholar, MIT Media Lab. eletouze@datapopalliance.org
• Amanda Noonan, Director of Research Design & Learning Internews Center for Innovation & Learning
• David Sangokoya, Research Specialist, Data-Pop Alliance • Natalie Shoup, Program Manager, Data-Pop Alliance Acknowledgements
This paper benefited from guidance from Mark Frohardt (Internews) as well as comments from William Hoffman (World Economic Forum), Alex ‘Sandy’ Pentland (MIT and Data-Pop Alliance), and Alessia Lefébure (Columbia University).
Box 3 was written by Lauren Barrett, Communication Strategist, Data-Pop Alliance, who also provided comments. Appendix 3 was developed by Gabriel Pestre, Research Scientist, Data-Pop Alliance, and Carson Martinez, Research Intern, Data-Pop Alliance, who also edited the document. Funding
Funding for this paper was provided by Internews Center for Innovation and Learning, whose support is gratefully acknowledged, as well as the Rockefeller Foundation as part of their core
Glossary of key terms and concepts
Algorithms: In mathematics and computer science, an algorithm is a series of predefined instructions or rules – often written in a programming language intended for use by a computer – designed to define how to sequentially solve a recurrent problem through calculations and data processing. The use of algorithms for decision-making has grown in several sectors and services such as policing and banking.
Big Data: The ecosystem created by the concomitant emergence of ‘the 3 Cs of Big Data’:
• Digital Crumbs—pieces of data passively emitted and/or collected by digital devices which constitute very large data sets and streams and contain unique insights about their behaviors and beliefs;
• Big Data Capacities—what has also been referred to as Big Data Analytics, that is the set of tools and methods, hardware and software, know-how and skills, necessary to process and analyse these new kinds of data—including visualization techniques, statistical machine-learning and algorithms, etc;
• Big Data Communities—which describe the various actors involved in the Big Data ecosystem, from the generators of data to their analysts and end-users—i.e. potentially the whole population.
Civic technology: A type of technology that enables citizen engagement or makes government more accessible, effective, and efficient for the economic and social good of society. This specific type of technology helps to connect people to resources, ideas, and other people needed to improve their societies or communities.
Data: An object, variable, or piece of information that has the perceived capacity to be collected, stored, and identifiable. It comes largely in two forms: structured and unstructured.
Structured data are essentially answers to questions asked by the collector of data, are generally easy to organize and identify and have a strict hierarchy that is not easily manipulated (i.e. responses to a survey organized in a table format and information about people’s years of education and income in a chart).
Unstructured data are not readily amenable to automated analysis and often are used in ways that differ from the intended purpose when collected (such as photos, videos, tweets), and do not need to follow a hierarchical method of identification.
Data is also used as a policy concept and social phenomena (e.g. “data is changing the world”), or as a shortcut for data ecosystems, Big Data, etc.
Data ecosystems: Complex adaptive systems that include data infrastructure, tools, media, producers, consumers, curators, and sharers. They are complex organizations of dynamic social relationships through which data/information moves and transforms in flows.
Data exhaust: Data that are passively emitted from cell phones, sensors, social media and other platforms as digital translations of human actions and interactions.
Data inclusion: The universal ability of people to create, control, access and use data.
Data journalism: A new form of journalism stimulated by the open data movement, in which stories are presented or supplemented through graphics or visualizations of analyzed datasets. These static or interactive graphics include databases, maps, diagrams, grids, charts and many other forms of illustrations that have transformed the look of mainstream news media.
Data modeling: Using existing datasets to infer current conditions or predict future outcomes. The process involves resolving complex relationships among datasets in order to understand what data means and how the elements relate.
Data Revolution: A term that has become mainstream in the policy and development discourse since the High-Level Panel of Eminent Persons on the Post-2015 Development Agenda called for a “Data Revolution” to “strengthen data and statistics for accountability and decision-making purposes”. It refers to the applications and implications of data as a social phenomenon. The term “Industrial Revolution of Data” was coined by Computer Scientist Joseph Hellerstein in 2008.
Data science: A field of research and practice that focuses on solving real-world problems using large amounts of data by combining skills from often distinct areas of expertise: math, computer science (hacking and coding), statistics, social science, and even storytelling or art.
Digital divide: The differential access and ability to use information and communications technologies between individuals, communities and countries — and the resulting socioeconomic and political inequalities.
Literacy: As defined by UNESCO, "the ability to identify, understand, interpret, create, communicate and compute, using printed and written materials associated with varying contexts. Literacy involves a continuum of learning in enabling individuals to achieve their goals, to develop their knowledge and potential, and to participate fully in their community and wider society."4
Literacy in the age of data: See Literacy in a post-2015 world.
Open data- Data that is easily accessible, machine-readable, accessible for free or at negligible cost, and with minimal limitations on its use, transformation, and distribution
Popular data: The practice of engaging, empowering and participatory approaches to data-driven presentation and decision-making (R. Bhargava).
Small data: Explicitly collected data – the data is collected in the open, with notice, and on purpose. Small Data can be analyzed by interested laymen. Small Data doesn’t depend on technology-assisted analysis, but can engage it as appropriate." (R. Bhargava).
(Statistical) Machine learning- A subset of data science, falling at the intersection of traditional statistics and machine learning. Machine learning refers to the construction and study of computer algorithms — step-by-step procedures used for calculations and classification — that can ‘learn’ when exposed to new data. This enables better predictions and decisions to be made based on what was experienced in the past, as with filtering spam emails, for example. The addition of “statistical” reflects the emphasis on statistical analysis and methodology, which is the main approach to modern machine learning.
Executive Summary
The term ‘data literacy’ has gradually emerged as a mainstream term and potential buzzword of the ‘Data Revolution’ discussions, as experts, policymakers and advocates began considering what it would take to enable citizens to make better use of the vast amount of data available to them. Policymakers have advocated for more data science skills-training programs. Schools and non-profit organizations (such as Code for America, Girls Who Code, School of Data, etc.) have emerged to tackle the digital divide by providing coding programs and technical curricula for vulnerable populations, specifically for women and minorities. An increasing number of data journalists are using and writing about data. Open data and civic technology advocates have organized hackathons for civic hackers to use technical skills and foster new conversations on data for social good.
Despite its growing popularity as a much-needed “bottom-up” solution, data literacy is ill-defined or ambiguous at best. Are current conceptualizations of ‘data literacy’ adequate—or do they put too much emphasis on technical requirements and fail to challenge deeper structural and more politically controversial issues? What does it mean to be “data literate” in an age where data is everywhere— and how does it differ from being literate? Why and how should it be promoted? How might ‘data literacy’ promotion empower individuals and communities to keep governments accountable, solve local problems, and navigate their own data ecosystems? In a world of ubiquitous digital connectivity and rising inequity, should we in fact be concerned with and talking about data inclusion instead? We first discuss ‘data literacy’ as an emerging concept within a much longer historical narrative of literacy promotion. History sheds light on how defining and promoting literacy—who was literate and who was not—has been often entrenched with the constructs and perpetuation of power structures within societies—at odds with the notion of literacy as a necessarily empowering and enlightenment force. There is a risk that the same processes may play out in the age of data, at a speed and scope commensurable with those of the spread of data as a social phenomenon.
We define data literacy as “the desire and ability to constructively engage in society through and about data.” Five observations emerge from this definition:
1. “Desire and ability” highlights technology as a magnifier of human intent and capacity. 2. “Ability” underlines literacy as a continuum, moving away from the dichotomy of literate
and illiterate.
3. “Data” is understood broadly as “individual facts, statistics, or items of information.” 4. “Constructively engage in society” suggests an active purpose driving the desire and ability. 5. And “through or about data” offers the possibility for individuals to engage as data literate
individuals without being able to conduct advanced analytics.
This definition—as well as the nature of data itself—encompasses elements and principles from each of these sub-kinds of literacy (such as media, statistical, scientific computational, information and digital literacies), moving away from medium-centred definitions of literacy towards a more encompassing one.
In utilizing a definition of data literacy that builds on the elements of current sub-categories of literacy and expands beyond particular media—and their technocrats—we describe four key pillars that form its foundation: data education, data visualizations, data modelling, and data participation.
Our exploration of data literacy pushes us to further consider what it would mean to be “literate in the age of data” and denote four core pillars in literacy promotion:
- Data literacy promotion must be agile and adaptive, focusing on helping foster adaptive capacities and resilience rather than teaching platforms and technical languages that are bound to become out-dated.
- Data literacy promotion must build on the key features and pillars from all core sub-categories of literacy, viewing literacy as a continuum.
- Data literacy promotion must involve empowering people to navigate their current ecosystems and societies in ways that are meaningful and effective for them.
- Data literacy promotion must involve providing multiple pathways for people with different data literacy needs and capacities to interact within a complex system.
At the center of the rationale and attention around data literacy promotion should be the goal of empowering citizens and communities as free agents. This can only be achieved by considering data literacy as a significant means and metric for social inclusion—where data literacy as defined and conceptualized above is promoted for and via greater social inclusion—or, more appropriately, data inclusion.
Here we highlight the following three critical challenges in designing data literacy programs:
- Making Big Data smaller, on scale where most or many more people are willing and able to engage than is the case today
- Understanding the importance of context and utilizing elements of human-centered design; - Understanding and leveraging the power of words and language in communicating and
visualizing data
As we revisit the larger context of the Data Revolution in the last section and concluding remarks in the light of data literacy and social inclusion, it becomes clear that if this Data Revolution is to bring about positive change, it has to be an evolution towards social inclusion in the age of data – towards data inclusion. If a ‘business-as-usual’ framing for the Data Revolution continues unabated, our efforts toward greater data literacy may reinforce existing power dynamics that promote social exclusion. This transitional period is the opportune time to create a path towards empowerment. Data literacy focused on building data inclusion offers a doorway to understanding, interpreting, and managing data-driven decisions and arguments for all people.
Supporting data literacy is not primarily about enabling individuals to master a particular skill or to become proficient in a certain technology platform. Rather it is about equipping individuals to understand the underlying principles and challenges of data. This understanding will in turn
Introduction
There is no shortage of discussions and initiatives about the promise and perils of leveraging data in various sizes and forms to meet the world’s challenges as part of the “Data Revolution” called for by the United Nations and others.1. But how exactly is data expected
to change the world we live in? What is the ‘theory of change’? In February 2010, about a century ago in data years, The Economist published a widely cited article titled “The Data Deluge: Businesses, Governments and Society Are Only Starting to Tap Its Vast Potential” (Figure 1). One of the first online comments read, “Here’s our 21st century jobs, America. Please understand and educate the next
generation accordingly.”
Over the past couple of years, the concept of ‘data literacy’ has emerged as a key priority.
Schools and nonprofit
organizations have developed programs to teach children how to code at an early age. Advocates in the open data movement have long argued for expanding use of public data beyond experts and trained journalists. Millennial job seekers are taking courses on Coursera, edX, and other open online courses to develop data science skills and increase their competitiveness in the data era. The international development
and civic technology communities have also emphasized the need for data literacy as a requirement of the data revolution. These organizations highlight both the potential economic and social impact of data literacy in the physical world and, to a lesser extent, its potential democratizing effect.
However, when it comes to the revolutionary potential of data—and the nature and features of the ‘data revolution’—we often miss the big point. For the most part, the ‘data revolution’ discourse is based on the notion that what the world misses (and therefore needs most) is more and better data, and more people who are able to collect, analyze, crunch data, to make better decisions. This line of argumentation, on which most calls for enhancing ‘data literacy’ rests, is not entirely wrong, but it leaves out many complex and controversial questions about why the world of 2015 is in such a bad shape.
As always, valuable lessons can be drawn from history. Claude Lévi-Strauss in his seminal book Tristes tropiques,argued that writing and the early decades of literacy promotion served the purposes of power elites. A recent partial evaluation of major data science programs by Stanford researchers also points to major shortcomings in the training of future data scientists.2
Figure 1: “The Data Deluge” as depicted in 2010
The rationale for promoting data literacy may seem straightforward. However, society as a whole has little clarity about what data literacy is, much less what they should expect from it. Vital questions require answers before we begin to promote data literacy as an answer to the world’s pressing problems.
1. What is “data literacy”? What does it entail, and how is it distinguished from statistical literacy, mathematical literacy, digital literacy, numeracy, and similar concepts?
2. Why does data literacy matter? What societal goals are data literacy expected to serve? What is the theory of change that moves from improved data literacy to achievement of those goals?
3. How adequate are current conceptualizations of data literacy? Does the current emphasis on technical requirements fail to challenge deeper structural issues? Are we moving toward a dystopian future in which we have to rely on world-class data scientist to fix all our problems for us? (Appendix 1)
4. How might we foster more inclusive approaches to data literacy? How can pervasive data literacy be a force for social inclusion – for data inclusion?
This paper argues for an expansion of the concept of data literacy. We argue data literacy as a term is inadequate, reinforces existing inequities and should be replaced by the larger concept of inclusion. Fulfilling that vision will be much more demanding and disruptive than developing popular new software systems and delivering face-to-face trainings and MOOCS on statistical packages. Rather, it will involve understanding and defining data literacy in terms of how to effectively empower individuals to navigate their own data/information ecosystems to produce, engage with, communicate and use data. Additionally, as we promote data literacy, we must incorporate human-centered approaches by design, understanding the dynamic and appropriate context involved in curating, synthesizing and communicating data. As we move forward with the Data Revolution, this is an opportune time to go beyond what we’ve described as ‘data literacy’ today and reconsider literacy in the age of data. Further, we must recognize data literacy as the means and metric towards a social inclusion revolution— the deeper goals that make the Data Revolution truly “revolutionary”—towards what we term data inclusion.
To make these points, this paper continues with a discussion of current mainstream approaches to the concept of data literacy. Section 2 advocates for a broader definition of data literacy, and proposes to conceptualize it as literacy in the age of data. Section 3 argues that data literacy ultimately ought to be the means and metric of greater social inclusion and vice-versa. Section 4 presents options and requirements to support this desirable evolution towards greater social inclusion in the age of data that we term data inclusion. Finally, we provide concluding thoughts on today’s data generation and its contribution to the data revolution.
1 Genesis, contours and limits of ‘data literacy’
1.1 Data literacy: an emerging concept of the ‘Data Revolution’
In the new “Industrial Revolution of Data,”3 more and more actors have become interested in
tapping into data to solve complex problems. From open government data to sensor data to data exhaust from social media, cell-phones and other digital devices, the vast amount of data available should allow for policy-makers, experts, businesses and activists to ask more informed questions and thereby develop more effective policies and programs.
The term ‘data literacy’ has gradually emerged as a mainstream term and potential buzzword of the ‘data revolution’ discussions (Box 1), as experts, policymakers and advocates begin considering what it would take to enable citizens to make better use of the vast amount of data available to them. Arguments commonly put forth include the following:
1. ‘Data literacy’ increases the economic impact of Big, Small and Open Data. As companies aim to capitalize on the potential business value generated from data, employees with data science skills have become highly valuable in today’s economy. Businesses have begun investing in skill-based trainings to help their analysts “conduct data-driven experiments, to interpret data, and to create innovative data-based products and services.”4 For many managers and business owners, the more “data literate” their
workforce, the bigger their profit margins;
2. ‘Data literacy’ enables local populations to understand and solve local problems. Development actors and community advocates push data literacy as an opportunity to increase the efficiency and resilience of local actors and communities in solving local problems. Data literate local actors would need to be able to “work…with very granular data, or data limited in geographic scope, as opposed to statistics that are often aggregated to a higher level.”5
More critically, data literacy would empower local actors with the ability to not only work with existing data, but generate, own, use and monetize data;
3. ‘Data literacy’ empowers citizens to keep governments accountable and transparent. Increased access to government data does not inherently create societal impact. Rather, citizens must be able to interpret, understand and effectively use the data in order to keep governments accountable and “spread the benefits of open government to marginalized communities.”6 Data literacy can help civil society groups catalogue rights
violations, fuel data-driven journalism and spur citizen engagement in transparency and anti-corruption efforts. Additionally, advocates voice that increasing ‘data literacy’ can help bridge an ever-increasing digital divide.
Box 1: From the data revolution to data literacy in two UN-commissioned reports
In May 2013, as the UN began moving toward the post-2015 Sustainable Development Goals, a ‘High-Level Panel of Eminent Persons on the Post-2015 Development Agenda’ appointed by the UN Secretary-General published a report “call[ing] for data revolution for sustainable development…to improve the quality of statistics and
information available to people and governments.”7 The report contained three mentions of “literacy”, and those
referred to “basic” literacy explicitly distinguished from “numeracy”.
By contrast, a 2014 report by the UN Secretary-General’s Independent Expert Advisory Group on a Data Revolution for Sustainable Development (IEAG)used the term data literacy four times and treated it as one of five pillars of its suggested action plan. The report called for an “education program aimed at improving people’s,
Despite this attention, descriptions of what exactly is meant by and expected from data literacy have been absent or unclear. For example, although the concept fared prominently in the IEAG report (Box 1), no definition was provided. In particular, it remained ambiguous
whether and how the report distinguished the roles of “capacity” and “data literacy” in “break(ing) down barriers between people and data”—especially given that “capacity” was absent in an otherwise similar statement. It was also not clear whether and how the report distinguished data literacy and statistical literacy, and whether either separately or combined these concepts could be assimilated to “numeracy”. Last, it was not clear whether one or both should “ensur(e) that all people have capacity to input into and evaluate the quality of data and use them for their own decisions, as well as to fully participate in initiatives to foster citizenship in the information age”. Specifically, how much of the capacity “to input into and evaluate the quality of data and use them for their own decisions” versus “to fully participate in initiatives to foster citizenship in the information age” ought to be a result or expression of being data literate (versus statistically literate or a combination of both).
The point is not to criticize a report that contained many points and proposals that are currently shaping the global discussions about data, but to highlight how its ambiguities underline the inherent complexity of the issue at hand, beyond and beneath its surface. To date, the questions elaborated in the introduction do not have satisfactory answers.
1.2 Data literacy as competencies of an extractive and transformative industry? As suggested above, the most commonly voiced argument in favor of ‘data literacy’ is that people must know how to understand and use data for it to have an impact. As alluded to, the Open Data community has long stressed that making government data ‘open’—i.e. available on a website—is not enough; the ‘theory of change’ involves people having an incentive and the ability to access the site and data, the capability to download it, and the competencies and tools required to analyse it, etc. Similarly, when data in general and Big Data in particular were compared to “the new oil of the digital economy”9 a few years ago, one implicit but obvious step was the ‘refinement’ or
‘transformation’ stage. And indeed, Big Data has been defined as “a mindset (...) to turn mess into meaning”10. The cover of The Economist’s Data Deluge article conveys a similar argument about transforming a raw material into a source of growth.
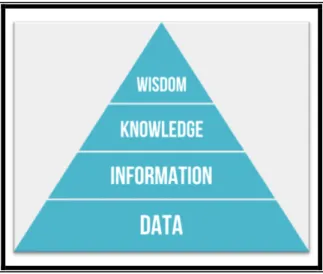
These arguments reflect and fuel the main stages of the widely-used vision of a process of transformation from data to information, information to knowledge—all the way up to wisdom, summarized by the DIKW model (Figure 2). 11 The choice of a pyramid and its highly symbolic dimension may actually not be entirely coincidental.
‘Data literacy’ would refer to the set of skills
and conditions for the first step up to occur. This approach and focus have been taken in most popular press articles on the subject. For example, a 2014 Forbes article defined data literacy as the “ability or ease” to “collect, analyse and visualize 18,446,744,073,709,600,000 data points per person in less than one second.”12
Figure 2: The Classic DIKW Pyramid
Even when the bar is set lower than being able to process over 1018 data points per second,
current conceptualizations of data literacy revolve closely around some version of “the ability to use and analyse data’”. As we shall see, this definition and its underlying assumptions and expectations about data’s potential to bring about change and inherent obstacles to this process is not flat-out wrong—but it focuses on skills required to perform tasks.
This conceptualization has implications that must be interrogated and challenged. For one, it says nothing about the ultimate objectives of the transformative process at play—at the top of the pyramid. It doesn’t question either the level of data collection—taking the availability of data as a given—like oil sitting there to be extracted and processed. It leaves hardly any room for ethical and political considerations. And yet the analogy with the ‘old oil’ should serve as a warning: oil fuels economies and emergency vehicles and as much as corruption, elite capture (and global warming).
To hammer in the point, it is tempting to bring up the Godwin’s point13 of Big Data:
Edward Snowden’s revelations about the nature and scope of the surveillance activities of the US National Security Agency. If ‘data literacy’ were just the ability to turn data into information, a society of junior NSA analysts (and their Amazon or Google counterparts) would be a highly data literate society. With quite a few caveats discussed below, in an era where concerns over data analytics-enabled government surveillance and corporate manipulations (as in the cases of the Facebook social experimentation14 or the recent
Volkswagen scandal15) are rising; one can feel intuitively that such a society may not be the
most progressive and inclusive. This, at minima, suggests that current conceptualizations of what data literacy is, means and entails, are not fully adequate.
1.3 Reconsidering ‘data literacy’ through the lens of history
One way to probe the concept of ‘data literacy’ is to reflect on its metaphorical roots—i.e. ‘standard’ or ‘traditional’ or ‘basic’ literacy—to understand how both literacy and efforts to promote it have been defined and conceptualized. History sheds light on how defining and promoting literacy has been often entrenched with the constructs and perpetuation of power structures within societies—at odds with the notion of literacy as a necessarily empowering and enlightening force.
Box 2: Claude Lévi-Strauss on the function of writing and literacy programs in history
“Writing is a strange thing. It would seem as if its appearance could not have failed to wreak profound changes in the living conditions of our ace, and that these transformations must have been above all intellectual in character. (…) Yet nothing of what we know of writing, or of its role in evolution, can be said to justify this conception. If my hypothesis is correct, the primary function of writing, as a means of communication, is to facilitate the enslavement of other human beings. …The use of writing for disinterested ends, and with a view to satisfactions of the mind in the fields either of science or the arts, is a secondary result of its invention and may even be no more than a way of reinforcing, justifying, or dissimulating its primary function. [T]he Europeanwide movement towards compulsory education in the nineteenth century went hand in hand with the extension of military service and the systematization of the proletariat. The struggle
Further, the literature on the effects of (and need for) literacy during the Industrial Revolution is rather ambiguous. By the mid nineteen century, the majority of European workers did not need to be literate, then measured by the ability “to sign one’s name”, but there was a point below which the process of industrialization could not have happened, as “it was useful to have a wide pool from which those who did need literacy—merchants, clerks, surveyors and engineers, for instance”.17 As Lévi-Strauss points out too, this period corresponded with the
heydays of European Nation-State building18—which in parts of Europe also implied the
systematic and brutal cracking down on regional languages to impose that of the central authority.19
Spurred by international organizations such as UNESCO as well as governments and civil society organizations, efforts to promote universal mass literacy began in the 1950s. As literacy became part of the agenda for an emerging international community post World War II, campaigns to eradicate “illiteracy” focused on promoting reading and writing as a basic set of skills for autonomy in and across countries. Definitions of literacy have differed across states and regions, and global campaigns against illiteracy became fragmented during the Cold War. Since then, the development of new technologies and globalization introduced new literacies, prompting literacy advocates to constantly reconsider the lowest bar of basic literacy.
The world has changed significantly since Lévi-Strauss wrote these lines. Various forms of literacy, including some related to the use of data, have undeniably made fundamental contributions to people’s enlightenment and empowerment—from the civil rights movement to fights for gender equality and environmental protection. But whereas it is not completely clear whether these effects were ‘secondary’ or explicitly intended, it is evident that literacy programs have always been embedded in local ontologies.
Taking an objective look at the state of affairs today suggests that advanced data analytics techniques, despite their potential to spur human progress, have so far worked especially well for governments and corporations. It is unclear whether and how promoting ‘data literacy’ the way it is currently conceptualized—by providing skills without much in the way of questioning their ends and means—may reverse or repeat the history of literacy promotion. This invites us to reconsider current approaches to data literacy that are based on overly mechanistic views of the world and its problems.
2 Moving from ‘data literacy’ towards ‘literacy in the age of
data’
2.1 Attempt at (re)defining ‘data literacy’
Two co-authors of this paper have previously20 proposed to define data literacy as the ability
to read, work with, analyse and argue with data:
• Reading data involves understanding what data is, and what aspects of the world it represents;
• Working with data involves creating, acquiring, cleaning, and managing it;
• Analysing data involves filtering, sorting, aggregating, comparing, and performing other such analytic operations on it;
• Arguing with data involves using data to support a larger narrative intended to communicate some message to a particular audience.
In this paper, we put forward a new definition of data literacy that goes one step further. We define data literacy as the “the desire and ability to constructively engage in society through or about data.”
At least five observations can be made about this definition.
1. Desire and ability echoes Kentaro Toyama’s conceptualization of technology as a magnifier of human intent and capacity.21 Awareness and opportunity to engage are front and
center;
2. Ability allows for varying levels of data literacy, away from dichotomy between data literate and data illiterate individuals. Obviously different positions and different goals require different levels of data literacy. Certain basic thresholds might be established to define minimal data literacy, and these could change over time;
3. Data is understood in its broader sense; data has been defined as “individual facts, statistics, or items of information, or “a body of facts”, and in that sense a news article whether printed or online, a tweet, an Instagram photo, a video – all of these are data. In the realm of data analytics, the distinction overlaps in great part although not fully with the distinction between unstructured data (such as files) and structured data (typically databases) (Box 3). Though this notion may indeed seem very broad, as it suggests that potentially everything, from music22 to a chair’s molecular structure and thus aspect, are or could be data, a
feature of the world’s future may very well be ubiquitous data-fication;
4. Constructively engage in society suggests an active sense of purpose—it suggests that literacy must be sought, deployed and measured in relation to specific goals that are deemed ‘constructive’; of course these will be highly dependent on context but these rule out, for instance, any goal that infringes on Human Rights23;
5. Through or about offers the possibility for individuals to engage in society through and/or about data—i.e. one can be data literate without being able to conduct advanced analysis. This definition also encompasses existing medium-based literacies. Evolutions in definitions of literacy have been on par with the emergence of ‘sub-kinds’ of literacies with their own specific definitions and requirements—statistical literacy, scientific literacy, media literacy, digital literacy and more. Breaking down ‘literacy’ into its constitutive pieces has practical value, but shaping various forms of literacy around emerging mediums increases the ‘silo-ification’ and technocracy around these mediums.
The attitudes and skills implied by our definition of data literacy can be pulled from the following sub-kinds of literacy24:
1. Information literacy is a pre-Internet era concept that emphasizes the importance of being able to locate and determine the credibility of information.
2. Scientific literacy focuses on the application of scientific concepts and experimentation methods needed for personal decision-making and civic
6. Digital literacy involves “the ability to find, evaluate, utilize, share, and create content using information technologies and the Internet.”29
Data literacy interacts with and builds on all six of these approaches and requires a combination of the technical, critical, quantitative and conceptual skills on which they are based (Figure 3). This definition—as well as the nature of data itself—encompasses elements and principles from each of these sub-kinds of literacy, moving away from medium-centred definitions of literacy towards a more encompassing one.
Figure 3: How different modern types of literacies interact
Source: authors’ elaboration based on secondary sources
Since data are used differently in various domains, researchers have proposed multiple, possible definitions of the competencies required to be data literate. These definitions differ in terms of the skills they emphasize, the level of technical proficiency they call for, and the methods and technologies they specify. Data literacy demands pedagogical approaches that are customized to the context of the learners, and every program will need to tailor its approach to focus on the competencies appropriate for its particular mission and audience. One facet of this definition of data literacy that is valuable in a pedagogical and research context is that it emphasizes the importance of interdisciplinary thinking as a core component of data literacy. Discipline-specific approaches to data literacy focus on either quantitative or qualitative investigation, which can bias the resulting interpretations. Quantitative analysis makes it possible to uncover hidden patterns and gain insight into complex datasets, while qualitative analysis makes it possible to surface individual stories within those aggregations. Increasingly, institutions have recognized that these methods can be complementary; by learning both approaches, individuals can explore an issue from multiple perspectives and reach more balanced and comprehensive conclusions.
Similar to the history of other literacy efforts, data literacy will not be a quick fix, but a rather slow exercise in behaviour change. Spurring engagement and enhancing the universal perceived value of data literacy will require marketing the skills as essential to everyday
functioning and long-term advancement and presenting data as accessible and applicable. It will be an evolution in intellectual dynamics.
As alluded to, the ethical and political implications of this new data age, such as human rights abuses, lie in our conceptualization of data literacy. To effectively engage participants in data ecosystems there will be a need to understand, design and communicate approaches that foster contextually relevant, human-centred, culturally resonant and effective engagement and use. The primary protection against encroachment of rights lies in data literate citizens with the desire and ability to comprehend and control the use of their data. If we conceptualize—and indeed confine, as we will discuss below—data literacy within these parameters, what does it look like, entail, and require? How can it be further unpacked? 2.2 Foundational pillars of ‘data literacy’
In utilizing a definition of data literacy that builds on the elements of current sub-categories of literacy and expands beyond particular media—and their technocrats—we describe four key pillars that form its foundation: data education, data visualizations, data modelling, and data participation.
The “data” in data literacy: data education
First, data literacy involves understanding what data is, or are, and does, or do—that is, basic data education. It entails, at minima, being able to define data; contrast and connect data with statistics”30; distinguish structured and unstructured data, qualitative and quantitative data, etc. (Box 3). It also implies critically assessing what they contain, convey, represent, even at a fairly abstract level—pieces of information that result from the translation, the coding, of some human experience into a language; numbers, words, pixels—with full or limited awareness of the object (be it an individual, a community, a country) characterized in the data.
It follows that central to basic data education is acknowledging the imperfect and biased nature of data. The simplistic assumptions that data, especially when they get bigger, are a neutral and unbiased representation of reality has been criticized by Crawford and others who have brought attention to the ethical dilemmas inherent in these data practices. Datasets are still “objects of human design” and therefore vulnerable to error and biases31. This can
happen at various stages of the process of data collection, analysis, and representation, unintentionally or through deliberate manipulation.
Specifically, structured data are created intentionally to answer a particular question, and, their creators often bias the way the data are created to get the answers they want. This limits the usefulness of the data to their viewpoint. (In other words, structured data is answers, not raw data). Unstructured data on the other hand are primarily created with intentions other
Box 3: What is data?
There is no agreed-upon definition of data. In general, data is an object, variable, or information that has the perceived capacity to be collected, stored, and identified. According to Oxford Dictionaries, data is
“facts and statistics collected together for reference or analysis.”33
There are two main types of data: structured and unstructured. The former are created intentionally to answer a particular question; as a result they are easy to search for, organize, and identify and have a strict hierarchy. The hierarchy for a
person’s favorite food might be: food, fruit, apple, red delicious. Each variable is clearly defined and labeled in a way that fits the structure’s taxonomy. Relational databases, popularized by IBM in the 1970s and 1980s, offered a significant improvement in the use of structured data in comparison to earlier hierarchical models. Unstructured data are everything else. It can be photos, word
documents, and other variables that do not need to follow a hierarchical method of identification. For example, someone can input data, such as an ‘apple’, without having to sequence it under the category of ‘fruits’ or know that there is a subcategory of ‘red delicious.’
Is unstructured data completely disorganized then? No. Metadata can be used to describe unstructured data. This can be .jpeg for example if it is used to describe a picture of an apple.
Over 90% of data is unstructured
data, and it is growing
exponentially in comparison to structured data because of the rapid creation of digital data, such as videos and tweets. As a World
Bank report notes, “a 10-minute
video of cats uploaded on YouTube may be quite heavy in terms of bytes but arguably contain less value than say Walt Whitman’s
Leaves of Grass.” 34
The Big Data revolution is a result
of this rapidly growing
unstructured data. Much of this unstructured data is qualitative, however, the large majority of tools
used to derive insights from data are quantitative in nature, such as statistics.35 As greater techniques and
tools are needed to analyze and make use of this data – i.e. actionable insights – there is a greater need to create quantitative, structured metadata surrounding these unstructured big data sets in order to employ these analytical tools.
Structured Unstructured
• Hierarchal structure • Least flexible
• ~10% of data and decreasing • Each unit corresponds with
a specific row and column, i.e. hierarchy. Follows ACID model: Atomicity,
Consistency, Isolation, Durability
• No set internal structure • Most flexible
• ~90% of data and increasing • Each unit may have its own
identifiable set of
information and does not correspond to a particular hierarchy, such as film clips, pictures, and text documents
Qualitative Quantitative
Responses to a survey about people’s activities during the weekend organized in a table format with columns and
rows
Information about people’s age (in years),
years of education, income, and amount spent in a table format with columns and rows
St
ru
ctu
re
d
Photos from weekend activities, which can be organized or unorganized by
size, type of photo (i.e. .jpeg), and photo descriptions, etc.
Field notes about people’s income, age or other quantitative data; or scans of the table described directly above
Un str uc tu re d
Data visualizations
Data visualizations, the typical vehicle through which data are conveyed to the public, are not necessarily accurate, accessible or appropriate within their contexts. A data visualization calls attention to a specific pattern or story within a dataset, illustrating one of many possible interpretations; a visualization cannot communicate the full complexity of a dataset. This raises the issue of the questions we ask of data – questions that inevitably will involve a degree of bias at least to some extent.
Creating and understanding data visualizations requires graphicacy. Graphicacy is“the ability to understand and present information in the form of sketches, photographs, diagrams, maps, plans, charts, graphs and other non-textual, two-dimensional formats”.36 It is a complementary skill that is
necessary for the effective communication of data-derived information. Beyond graphicacy, understanding different languages’ cultural appropriateness in terms of symbols, visuals and media is also necessary. At present our understanding of such languages is sparse. The challenge and opportunity will be to work with communities and individuals to surface their contextual understanding of data and the ways to understand, find, capture, use and communicate these, as illustrated in Box 4.
Furthermore, the bias in visualizations is often deliberate.37,38 A highly data literate person or
public will understand not only how to interpret data visualizations, but also how to assess the reliability and objectivity of the sources.
Box 4: Understanding data; case study in graphicacy
To test the accessibility and utility of data visualizations created for the Kenyan media, Internews led a pilot investigation. In Kenya and elsewhere, the publication of data visualizations in print news media is a recent phenomenon, linked to the popularization of data journalism.
The study tested four different textual and graphical representations of data. There was no significant difference in participants’ comprehension of text-based analysis versus graphic. Among the graphic representations, simple bar charts were most easily interpreted.
Pinker’s theory of graph comprehension contends that viewers must be able to recognize specific types of graphs to be able to translate their visual information into quantitative information. “If this type is unknown to the viewer, s/he will almost always struggle with interpretation at first glance. According to Pinker, there are three routes to comprehension: “being told,” induction, and deduction.
Improvement in the ability to read graphs may be best enhanced by explicit instruction. Furthermore, aesthetic preference and even the ability to read a graph may be culturally determined. Picture stories with which the audience can identify appear to facilitate recall. This finding aligns with the “active audience” theory in media reception studies.
the RAND Corporation’s recommendation to close numerous fire stations in one of New York City’s poorest neighbourhoods39. Another common issue that is as old as statistical
analysis is spurious correlations and confounding correlation and causation; one new challenge is the fact that with more data spurious correlations and meaningless patterns are easier to find—which has been referred to as “apophenia40”—which some policymakers,
salespersons and various advocates have been known to use and abuse to advance their own agendas or embellish their accomplishments.41
These examples illustrate the perils of an overreliance on data and data analytics when data modelling is used without taking into consideration existing local knowledge and the agility of human behaviours. Further, using abstruse methods of data analysis that seem authoritative makes policies harder for opponents to verify and critique. These issues all have a profound impact on individuals, most of whom do not know what predictive data modelling is, let alone have the knowledge to evaluate and point out its shortcomings. The public needs to be more data literate to interrogate and potentially challenge these very decisions and processes. This highlights the critical need for usable tools and trusted intermediaries that are able to open the ‘black boxes’ and unpack these processes and expose their potential biases in comprehensible and engaging ways.
Participation
Most people are excluded from engaging with data for a host of technological, technical, cognitive and practical barriers. As a result, they are unable to influence the types of applications that are built, and to direct those efforts toward outcomes that may benefit their communities. Even applications that are intended to engage diverse communities in contributing data run the risk of overlooking underserved communities who may lack access to the technology necessary to participate.42,43
The open data movement attempts to address this issue by making data free and readily available, thereby increasing the transparency of public institutions and encouraging public participation. Yet most of the individuals taking advantage of open data resources are civic technologists with existing expertise who come with their own biases and perspectives. Most people are still excluded from engaging with data since they require access to education, infrastructure, and technology.
Data literacy as a concept involves the interaction of multiple ecosystems containing both literate and illiterate actors. The ability to use data and to create actionable knowledge requires understanding of local information ecosystems: how data is transformed into information, then knowledge, as it flows through different points and channels in a dynamic, non-linear, networked system. The function or role of any node or point within an information ecosystem changes depending on the context. A farmer can be a consumer of information received through a mobile phone alert, a producer of information as they transcribe the information on a bag of rice, and a mover and influencer of information as they share it with the rest of their community and at the market.
An information ecosystem is not a static entity; it is by nature constantly evolving and changing. Nor is it a discrete form; it can be defined at many levels, from global to national to community to interest-based groupings within communities. It is a complex, adaptive system that includes information infrastructure, tools, media, producers, consumers, curators, and sharers. Data and data-derived information and communications are increasingly critical elements of information ecosystems. Research by the Internews Center for Innovation & Learning has described eight critical dimensions common to any data/information ecosystem (Figure 4).
Figure 4: Eight Critical Dimensions of Information Ecosystems
Key features here not only include logistical aspects such as demand, structures, applications and flow of information but also place a heavy focus on context; ease of accessing, finding, using, sharing, and exchanging different types of information; barriers to interaction and participation; and relevance of information. Extremely significant to these ecosystems as well and a resulting feature of their complexity is social trust – the influence of trust networks on the flow and use of information – which involves the data itself, the consumer and the influencers of the system.
Understanding how data/information ecosystems function and evolve is critical to fostering and expanding data literacy and therefore data engagement. This approach does not simply empower voices “from the ground” – it accounts for needs, challenges, and opportunities
2.3 Conceptualizing ‘data literacy’ as ‘literacy in the age of data’
Despite our attempt to clarify and broaden the definition of data literacy, it may not stand the test of time. Artificial intelligence, virtual reality, and other new technologies threaten to completely disrupt our current conceptualizations of data and how to use it. Data literacy, defined and conceptualized as “the desire and ability to engage constructively in society through or about data,” may not be enough to empower global citizens to use various kinds data to improve their lives and strengthen their communities.
As new discoveries and media change, data literacy must be able to adapt as well, focusing on fostering adaptive capacities and resilience rather than teaching platforms and technical languages that are bound to become out-dated. An even boarder concept is needed to ensure citizens may identify, navigate and participate in the rapidly changing data ecosystem. Promoting data literacy needs to move beyond the constraints of a sub-type of literacy and expand to promoting literacy in the age of data.
Promoting literacy in the age of data must be adaptive. Despite our increasing capacities to collect and capture data, we are still navigating the possibilities of data. Discovering the impact of a current dataset could take years: the emergence of new technologies and datasets may challenge our acceptance of current datasets and increase the risks involved in using them.
Promoting literacy in the age of data should not solely be based in new technologies or mediums, but involve empowering people to navigate their current ecosystems and societies in ways that are meaningful and effective for them. In the age of data, new data and technologies will continue to challenge and shape our individual and collective capacities to learn, communicate and make decisions. Data literacy promotion must move beyond solely focusing on platform-based skill development (e.g. writing, coding, etc.).
As it turns out, this is exactly in line with the evolution in the thinking about ‘standard’ literacy. In setting its goal for universal literacy under the motto of “Literacy as Freedom” in the mid-2000s—before the emergence of data and Big Data as core policy concepts— UNESCO noted:
“At first glance, ‘literacy’ would seem to be a term that everyone understands. But at the same time, literacy as a concept has proved to be both complex and dynamic, continuing to be interpreted and defined in a multiplicity of ways.”
It then proposed an expansive definition of literacy:
“[T]he conception of literacy has moved beyond its simple notion as the set of technical skills of reading, writing and calculating—the so-called ‘three Rs’—to a plural notion encompassing the manifold meanings and dimensions of these undeniably vital competencies. Such a view, attending recent economic, political and social transformations, including globalization, and the advancement of information and communication technologies (ICTs), recognizes that there are many practices of literacy embedded in different cultural processes, personal circumstances and collective structures” (UNESCO 2004, 6).44
Today, UNESCO defines literacy in a broad encompassing definition as follows:
Literacy refers to the "ability to identify, understand, interpret, create, communicate and compute, using printed and written materials associated with varying contexts. Literacy involves a continuum of learning in enabling individuals to achieve their goals, to develop their knowledge and potential, and to participate fully in their community and wider society".4
Although this definition did not make any reference to data, it is consistent with and includes core aspects of data literacy—although less emphasis is placed on ‘desire’.
Promoting literacy in the age of data should build on the key features and pillars from all core sub-categories of literacy – literacy as a continuum. Historically, a main feature of literacy has been the evolutionary nature and instrumental dimension of its definition and measurement: we noted earlier how it was once defined and measured by the ability to sign one’s name as opposed to tracing a cross. Over time, the standards by which literacy has been assessed have risen alongside literacy rates; at all times, literacy has been fundamentally redefined according to its purpose. The definition, promotion and evaluation of literacy have been and remain context and purpose-specific—not a-contextual, abstract and absolute. Even more so, literacy is only relevant within shared ontologies. This makes literacy both an instrument of power, and the condition for challenging it.
Further on this point, promoting literacy in the age of data must go beyond the binary conceptualization of being literate or illiterate. There are perilous dangers in thinking that a given individual or group are data literate, and thereby assuming the completeness of their potential ability to engage with and use data. The subtleties and grades of literacy are numerous and continue to evolve; as this evolution unfolds, so too must the fidelities of its systems, tools and supports.
Promoting literacy in the age of data must involve providing multiple pathways for people with different data literacy needs and capacities to interact within a complex system. In understanding literacy as a “continuum of learning,” efforts to promote literacy in the age of data must provide multiple entry-points for people to understand and consider data literacy in conjunction with their own goals for knowledge development and participation in their community and societies. In this sense, there are many levels of literacy as a way for people with different capacities and needs to interact in the complex ecosystems that exist.
3 Promoting data literacy for and via social inclusion
At the center of the rationale for data literacy promotion must sit the goal of empowering citizens and communities as free agents. This can only be achieved by considering data literacy as a significant means and metric for social inclusion—where data literacy as defined and conceptualized above is promoted for and via greater social inclusion; which we term data inclusion.
3.1 Making Big Data small(er)
Data may reinforce existing power structures and processes. This risk is most evident in the case of Big Data; the sources and features of Big Data’s potentially ‘disempowering’ effect have by now been well identified, notably by boyd and Crawford who as early as 2010 noted
involved, or used to discriminate against people.
This argument implies that the conceptualization and promotion of data literacy should not be disconnected from ethical considerations. Indeed it can be argued that data literacy is essentially an ethical imperative.
Box 5: Do you know where your data are?
In 2014, the Federal Trade Commission’s report on data brokers—companies that collect and sell personal consumer information—revealed that most consumers are unaware of how their personal data is being collected and used.47Although the work of data brokers can benefit consumers and the
economy by, for example, enabling fraud protection, most consumers simply do not know how extensively their personally identifiable information (PII), property information, and social media use are being sold for profit.
For example, CoreLogic’s database includes over 147 million records containing property-specific data for over 99% of all U.S. residential properties. RapLeaf’s data aggregator contains at least one data point, including PII, for over 80% of all U.S. consumer email addresses.ii
As the FTC report and many well-publicized data leaks brought attention to the risks to consumer privacy, marketers and data brokers responded to pressure to make terms-of-service agreements more accessible and detailed. However, many Americans still do not know how much of their data is being shared and the extent to which they can opt out of these practices. A study by the Annenberg School for Communication at the University of Pennsylvania concluded that marketers often frame data sharing as a tradeoff for the delivery of services or discounts. However, most consumers do not have the data literacy to make informed decisions to give up their data.48
Experts have suggested remedies based on the E.U.’s data protection directive and similar initiatives. For example, Alex Pentland of the MIT Media Lab and Data-Pop Alliance calls for a “new deal on data” to give users ownership of their data and control over its use.49
A dichotomy of Big Data versus Small Data is often delineated especially in relation to empowerment. While both concepts are significant to discussions of empowerment and engagement, the demarcation is not without limitations. As a particular type of data, ‘Big Data’ is actually a bit of a misnomer since the data in question are in fact many little data points related to people’s behaviors and beliefs to make up very large data streams and sets. As a field of research and practice, Big Data typically refers to the algorithmic analysis of large, passively collected, sets and streams to discover patterns and relationships, often not obvious at the onset of the analysis. The results provide insights into systems that otherwise wouldn't have been revealed but for the massive collection and automated, computer-enabled, analysis of data. Small Data, in contrast, centers on active data collection by engaged, willful, participants, with analysis using manual or computer-assisted techniques. Both practices may use qualitative and quantitative datasets and both can entail structured or unstructured data.
However, a distinction of Big Data is that it always involves structured quantitative data at some point in the analytics process. For example, in applying machine-learning, no matter the character or configuration of the source data, it is necessary to quantify the data in order to perform the necessary operations to give a result.