Better, Quicker, Together: Enabling Public Transport Service Quality
Co-monitoring Through a Smartphone-Based Platform
by
Corinna Lubin Li
B.A. in Ethics, Politics, and Economics Yale University (2011)
Submitted to the Department of Urban Studies and Planning and the Department of Civil and Environmental Engineering
in partial fulfillment of the requirements for the degrees of Master in City Planning
and
Master of Science in Transportation at the
MASSACHUSETTS INSTITUTE OF TECHNOLOGY
June 2016
© 2016 Massachusetts Institute of Technology. All Rights Reserved.
Author________________________________________________________________________________________ Department of Urban Studies and Planning
Department of Civil and Environmental Engineering May 19, 2016
Certified by __________________________________________________________________________________ P. Christopher Zegras Associate Professor of Urban Studies and Planning
Thesis Supervisor Certified by __________________________________________________________________________________
Jinhua Zhao Assistant Professor of Urban Studies and Planning Thesis Supervisor Accepted by__________________________________________________________________________________
P. Christopher Zegras
Associate Professor of Urban Studies and Planning Chair, MCP Committee
Accepted by____________________________________________________________________________________ Heidi Nepf Professor of Civil and Environmental Engineering Chair, Graduate Program Committee
3
Better, Quicker, Together: Enabling Public Transport Service Quality
Co-monitoring Through a Smartphone-Based Platform
By Corinna L. Li
Submitted to the Department of Urban Studies and Planning and the Department of Civil and Environmental Engineering on May 19, 2016
in partial fulfillment of the requirements of the degrees of Master in City Planning
and
Master of Science in Transportation at the
Massachusetts Institute of Technology
Abstract
Public transport system is an important part of cities, and the quality of public transport service – passengers’ perceived performance – is a key urban indicator. Customer
satisfaction surveys has been the traditional methods and metrics for monitoring and evaluating public transport service quality, but they come with a number of weaknesses. They are administered too infrequently and ask subjects to provide only general ratings. The infrequency results in potential delay for agencies to receive feedback, and the
abstractness reduces the possibilities of associating satisfaction levels to specific trips and their attributes, as well as using the data to inform service improvement decisions.
Given these shortcomings with conventional surveying practices, there is great value in engaging riders as additional sources of information. This reflects the concept of “co-monitoring” – agencies using public feedback to supplement the official monitoring and regulation. This is aided by the growing ubiquity of Internet-connected mobile devices, which enables citizens to generate and submit feedback without time or geographic constraints. From the data collection perspective, this would make the process more dynamic, low-cost, and in real-time. Equally importantly, it is poised to enhance public transport agencies’ relationship with their customers – conveying to customers that their experience and feedback are valued. The service sector today is increasingly striving to be more responsive to the customers’ needs and experiences, seeking to strengthen the relationships with customers. The benefits of co-monitoring may help public transport agencies adapt to these current service paradigm shifts towards “real-time” and “on-demand.”
This thesis documents the creation and piloting of a smartphone-based platform for
4
a team of academics and software engineers, the author leads the effort to adapt a
smartphone-based travel survey system, Future Mobility Sensing (FMS), to collect real-time customer feedback as well as objective operational measurements on specific bus trips. The system (FMS-TQ) uses a combination of GPS, Wi-Fi, Bluetooth, and cellphone accelerometer data to track transit trips, while soliciting users’ feedback on trip experience with built-in questionnaires. FMS-TQ has been piloted in partnerships with public authorities in Singapore and Boston. The pilots have demonstrated the platform’s capability to collect trip-specific performance data, as well as value for public transport operators and regulators.
The significance of this effort is three-fold. First, it embodies one of the first successes in making public transport service quality data associable, attributable, and actionable. One can associated this information to individual trips, and attribute performance excellence or shortfalls to specific infrastructure, personnel, or service operations. As a result, the data may reveal more actionable information for service quality monitoring. Second, the new kinds of data open up possibilities for new academic inquiries on travel satisfaction. Finally, the system’s public deployment signal the beginning of a mentality shift in
customer-engagement and relationship-building in the public transport sector. Collectively, the methodology and institutional innovations aim to contribute towards a better public transport service for the city and its people.
Thesis Supervisor: P. Christopher Zegras
Title: Associate Professor of Urban Studies and Planning
Thesis Supervisor: Jinhua Zhao
5
Acknowledgements
Over the last 33 months, there has not been a moment when I have not felt extremely privileged to be where I am, working with and learning from the most inspirational and supportive people. I owe everything to these professors, mentors, colleagues, friends, and family -- no words are adequate to describe my gratitude to you, but I take a stab here anyways.
I owe so much of my growth in graduate school to my advisers Professors Chris Zegras and Jinhua Zhao. Thank you for being the two best teachers, advisers, mentors, and thinkers that one could ever wish for.
To Chris: Thank you for bringing me to DUSP and the memorable journey with the FMS-TQ project over two continents. I am very grateful for all your support and guidance through every challenge and hurdle. Thank you for always believing in me, even during times when I doubt myself. You have shown me that in research it is okay to embrace the unknowns and take risks, and that a professor is can spend a day driving a pick-up truck all over Boston, hauling a ladder, and getting hands (literally) dirty for a project. Thank you for all the time and attention that you have given to this thesis.
To Jinhua: Thank you for the freedom to pursue my interest in emerging
smartphone technology for urban transportation. I am grateful for the invaluable academic training that you have coached me through: from the e-hail paper to the FMS-TQ project, the many grant proposals, peer reviews, conference presentations, and research meetings. Thank you have pushing me to achieve things that I did not previously know that I could.
When I look back on my time at MIT many years later, I am sure that I will also remember the mentorship from Fred Salvucci and Mikel Murga. I am not only super lucky to be their student, but also to have worked along their side as a teaching assistant. To Fred and Mikel: thank you so much for what you’ve inspired in me. You have shown me how to build
consensus among stakeholders, leverage technical expertise, and work tirelessly towards our visions for our cities (and, the 19-Step Process and 4-Step Model, of course).
I am deeply indebted to the team that has made FMS-TQ a technical reality. I sincerely thank Dr. Fang Zhao, Zhengquan (Robert) Qin, Kalan Vishwa Nawarathne, Dr. Francisco Pereira, Professor Moshe Ben-Akiva, Paola Garbagnoli, and Andrew TONG Kwok Cheong. I especially thank Fang and Zhengquan for their expertise, diligence, and patience, and apologize to Zhengquan for the many late nights that my questions and requests have put him through. I also thank my fellow MCP student and Ayesha Shahid for the comradery and help on the Boston pilot, and Andrew Carrel for his wisdom and advice.
This project would not have been possible without our many institutional partners. I thank our colleagues at the Singapore Land and Transport Authority (LTA), including George
6
SUN, Peng Yew SAM, TAN Chien Yeow, Wai Yan LEONG, for allowing us to experiment with the early efforts in Singapore. I am beyond thankful for the partnership and support of the Massachusetts Bay Transportation Authority (MBTA) and MassDOT: Laurel Paget-Seekins, Anna Gartsman, Dominick Tribone, Monica Tibbits-Nutt, the engineers and crew at the Southampton Garage, and other MBTA staff that have assisted us in bringing FMS-TQ to Boston’s Silver Line. To others who I may have inadvertently missed to thank here, thank you!
I would like to thank a number of organizations for their financial support: the Singapore-MIT Alliance for Research and Technology (SMART) for funding the FMS-TQ project, the Dwight David Eisenhower Transportation Fellowship Program for the graduate fellowship and travels to TRB, the Eno Center for Transportation for the Future Leaders Development Conference, and the WTS-Boston for the Ann Hershfang Scholarship.
I am very privileged to be mentored by a number of experts whom I will always look up to. I thank Alan Lubliner and Andrew Salzberg for my summer internships at Parsons
Brinckerhoff and Uber, respectively. I thank the MIT alumni who have given me invaluable guidance, encouragement and inspiration, especially Jason Lee (MST ’00), Holly Krambeck (MCP-MST ’06), and Jeff Sriver (MST ‘95).
Three years at MIT would not be the same without the company of my peers. To Jeff Rosenblum, Philip Kreycik, Zhan Zhao, Elizabeth Irvin, Patton Doyle, Oren Petraru, Adam Rosenfield, Qianqian Zhang, Darius Bunandar, and Wenji Ma: thank you for your friendship and comradery. You are amazing and I am glad that I will be able to say I knew you before you were famous.
To my beloved parents: thank you for all your love. I know it has been a big parental sacrifice to have your only child half a world away for the last nine years. I am so grateful for your instillation in me the dream to make this world a little better than the one that you’ve brought me into, and for your unceasing understanding and supporting of my pursuits.
To my partner Henry: thank you for all your incredible love, support, understanding, patience, and help on this journey. Time after time you have come to my rescue, be it accompanying me on late-night trips to the bus garage, helping me test the app in pouring rain, answering my many coding questions, and always supplying the moral support. Thank you for being my rock and my biggest fan.
To everyone who believes in the vision of efficient, equitable, and environmentally-sustainable transportation for our cities: thank you. Let’s keep fighting!
7
Table of Contents
1 Introduction ... 11
1.1 From Snowmaggaddon, an idea was born ... 11
1.2 Research questions ... 13
1.3 Organization ... 14
2 “So, how are we doing?” ... 16
2.1 Definitions ... 16
2.2 Understanding public transport service quality and customer satisfaction ... 23
2.3 Current industry practices ... 26
2.3.1 Intercept survey ... 30
2.3.2 Telephone-based survey... 33
2.3.3 Web-based survey ... 34
2.3.4 Other methods ... 36
2.4 Role of smartphones in advancing public transport service quality assessment ... 38
3 Customer Feedback: Data Collection, Institutional Learning, and Relationship-Building ... 44
3.1 Feedback as data collection ... 45
3.2 Feedback as institutional learning ... 49
3.3 Feedback as relationship-building ... 53
3.4 Challenges and Ways Forward ... 57
4 Future Mobility Sensing – Transit Quality (FMS-TQ) Platform ... 62
4.1 Future Mobility Sensing (FMS) ... 62
4.2 Future Mobility Sensing – Travel Quality (TQ) ... 66
4.3 Design Framework and Principles ... 70
5 A Tale of Two Cities: Singapore & Boston ... 77
5.1 Two cities at a glance ... 77
5.2 Singapore ... 79
5.2.1 The public transport system ... 80
5.2.2 Land Transport Authority (LTA) ... 85
5.3 Boston ... 86
5.3.1 The MBTA ... 87
5.3.2 The Silver Line ... 90
8 6.1 Trial design ... 95 6.2 Implementation... 104 6.3 Findings ... 105 6.4 Discussion ... 114 7 FMS-TQ in Boston ... 116 7.1 Trial design ... 116 7.2 Implementation... 123 7.3 Findings ... 128 7.4 Discussion ... 139
7.4.1 On the Boston pilot ... 139
7.4.2 A few overall thoughts on Singapore and Boston pilots ... 140
8 A Planner’s Reflection ... 143
9 Conclusion ... 152
9.1 Evaluation... 152
9.2 Areas for Future Research ... 153
9.3 Looking Forward: Enriching Mobility as a Service ... 154
Bibliography ……….. 156
9
List of Tables
Table 2.1 - Public transport quality attributes under the SERVQUAL model ... 19
Table 2.2 - Literature linking quality, value, and satisfaction to customer behavioral outcomes 22 Table 2.3 - Service quality/customer satisfaction survey methods used in Singapore and by top 10 U.S. transit systems ... 30
Table 2.4 - Results of the 2015 Singapore PTCSS ... 32
Table 4.1 - Comparison of FMS-TQ setup between Singapore and Boston ... 68
Table 4.2 - Service attributes surveyed by FMS-TQ in Singapore and Boston pilots ... 73
Table 5.1 - FMS-TQ pilot sites' comparative context ... 78
Table 6.1 – Service attributes to be assessed ... 99
Table 6.2 - Number of respondents and Responses ... 105
Table 6.3 - Onboard Questionnaire Response Summary ... 111
Table 7.1 - Number of respondents and Responses ... 129
Table 7.2 - Summary statistics of entrance questionnaires ... 130
Table 7.3 - Satisfaction ratings on service, by time period, and Fisher’s exact test results ... 134
Table 7.4 - Satisfaction ratings on service, by routes, and Fisher’s exact test results ... 135
Table 7.5 - Illustrative example of result of data fusing and inference ... 136
Table 7.6 - Number of onboard questionnaire responses with successful inference/match to MBTA data ... 138
List of Figures
Figure 2.1 – NJ Transit’s Scorecard ... 27Figure 2.2 - Flows of conducting various methods of customer surveys ... 37
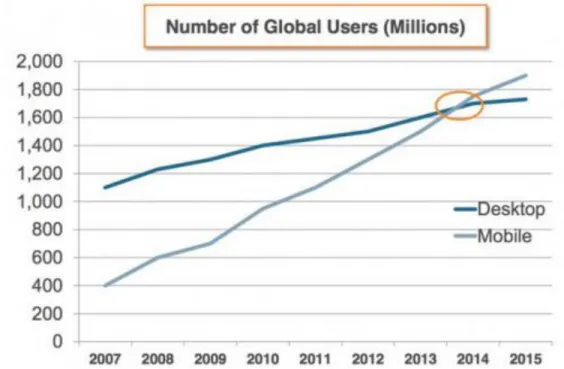
Figure 2.3 - Ownership of desktop vs. mobile computers ... 42
Figure 3.1 – Sample Twitter posts concerning public transport experiences ... 48
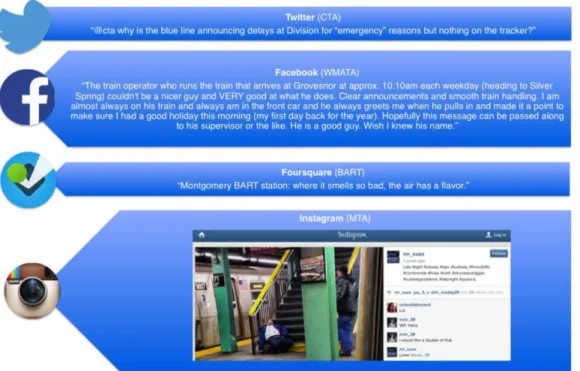
Figure 3.2 – Examples of public transport-related content from various social media ... 49
Figure 3.3 - SeeClickFix's Civic Points reward scheme ... 59
Figure 4.1 - FMS platform architecture ... 63
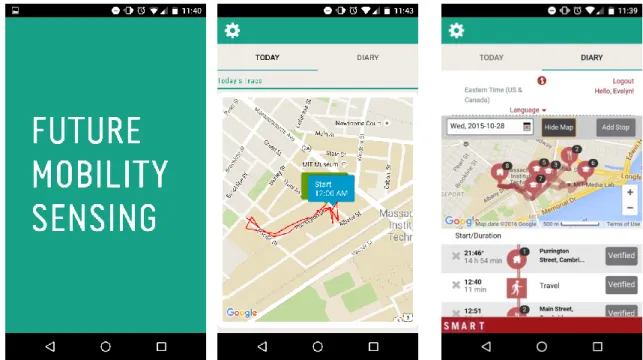
Figure 4.2 - FMS interface. Left: App launch screen; Middle: trace of user’s travels of the day; Right: activity diary showing travel mode and stop inferred from machine learning algorithms 63 Figure 4.3 - User validation mechanism. Left: web interface; Right: mobile app interface ... 65
Figure 4.4 - FMS-TQ system architecture. ... 66
Figure 4.5 - Select brands of BLE beacons. ... 67
Figure 4.6 - Physical objects and human bodies can reduce BLE Beacon signal strength ... 69
Figure 4.7 - Estimote beacon size and construction ... 70
Figure 4.8 - FMS-TQ questionnaire trip confirmation screens... 72
Figure 4.9 - Screenshot from FMS-TQ (Boston pilot), asking users to identify specific factors that affect their satisfaction ... 74
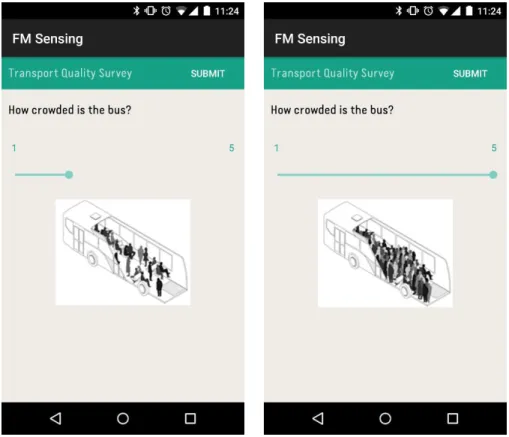
Figure 4.10 - Visuals help users answer questions that would otherwise lack a standard of judgement, such as crowding level ... 75
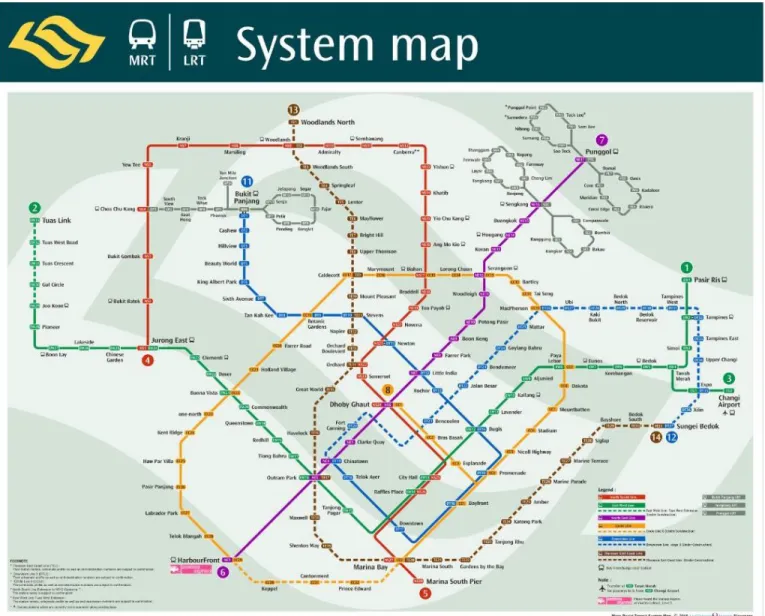
Figure 5.1 - Singapore's MRT and LRT system map ... 82
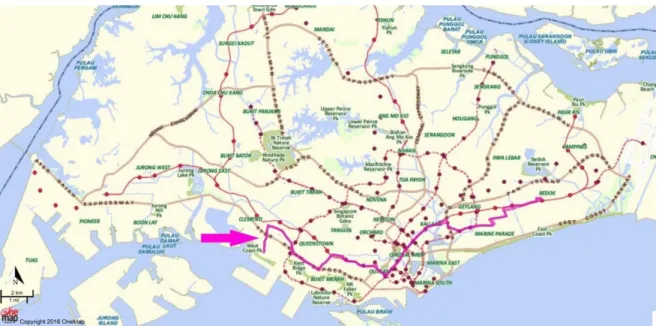
Figure 5.2 - Example of a trunk bus route (#33), route shown in magenta ... 83
10
Figure 5.4 - MBTA service routes – subway, key bus routes, commuter rail, and ferry lines ... 88
Figure 5.5 -MBTA service area ... 89
Figure 5.6 - Silver Line routes ... 91
Figure 5.7 - Silver Line vehicle and stop ... 91
Figure 5.8 - Silver Line stop infrastructure on Washington Street ... 94
Figure 6.1 - Trip stage detection and survey solicitation logic ... 96
Figure 6.2 - Location of the pilot stops in context of Singapore ... 97
Figure 6.3 - Participating bus stops... 97
Figure 6.4 - Beacons installed at bus stops ... 98
Figure 6.5 - Screenshots of select questions from the entrance questionnaire ... 101
Figure 6.6 - Screenshots of select questions from the at-stop questionnaire ... 102
Figure 6.7 - Screenshots of select questions from the onboard questionnaire ... 102
Figure 6.8 - Screenshots of select questions from the post-alight questionnaire ... 103
Figure 6.9 - Screenshots of select questions from the end-of-day questionnaire ... 103
Figure 6.10 - Passenger feedback on stop crowding level ... 106
Figure 6.11 - Passenger feedback on bus crowding level ... 107
Figure 6.12 - In-app visual references for various crowding levels ... 108
Figure 6.13 - Detailed qualitative feedback on onboard comfort and crowding conditions ... 108
Figure 6.14 - Passenger assessment of bus stops. Top: bus stop conditions; Bottom: bus service information at bus stop... 109
Figure 6.15 - Example of inferring bus trip from GPS coordinates collected by FMS-TQ ... 113
Figure 7.1 - FMS-TQ app logic and survey generation flow ... 118
Figure 7.2 - Select screenshots of entrance questionnaire ... 120
Figure 7.3 - End-of-trip questionnaire ... 121
Figure 7.4 - Screenshots from onboard questionnaire ... 122
Figure 7.5 - Estimote beacons used in the pilot ... 124
Figure 7.6 - Labeling and configuring the beacons ... 125
Figure 7.7 - Installing beacons on the buses ... 126
Figure 7.8 – Beacons installed on Silver Line stops and stations ... 127
Figure 7.9 - Distribution of number of questionnaires completed per user ... 129
Figure 7.10 - Satisfaction with service, as reported in onboard questionnaire responses ... 132
Figure 7.11 - Satisfaction with service, as reported in end-of-trip questionnaire responses ... 132
Figure 7.12 - Illustrative example of trip inference (Step #1) ... 136
Figure 7.13 - Schematic illustration of data analysis process ... 136
11
Chapter 1
Introduction
1.1 From Snowmaggaddon, an idea was born
The winter of 2015 was an unforgettable one for Boston. Ferocious blizzards slammed the city, dumping more than 110 inches of snow and shutting down this northern city that had been so used to the cold. The region paralyzed along with the transportation system. Travel bans were imposed, buses and subway trains broke down, and the entire public transport system shut down for a total of four days. Even after the shutdowns officially ended, the system struggled with rampant delays. Horror stories of typical 45-minute commutes turning into four-hour journeys
abound. The MBTA (Massachusetts Bay Transportation Authority), the region’s public transportation operator, became a subject of public criticism and apprehension. The day after the second shutdown ended, the MBTA’s General Manager resigned.
This episode highlights a conundrum for public transport operators and regulators. They work hard to keep the bus and trains running, but that scarcely make riders happy. For major systems that serve millions of rides per day across hundreds of routes on multiple modes, it takes monumental coordination and diligence to dispatch and safely run every vehicle and adjust to extenuating
circumstances. When service runs smoothly, there are scarce praises or recognition, but when hiccups occur, however minor, complaining voices surface loudly. Sure, there are many possible reasons for this phenomenon – image of public transport as a public good and a right, unpleasant emotions associated with commuting (i.e., going to work), economic impact of a bad trip (e.g. arriving late to work or an important meeting), heuristic biases that render negative experiences more salient than positive ones, etc.. Though many other service sectors encounter similar imbalance of
12
customer feedback between the positive and negative poles, the phenomenon poses extra issues for public transport operators and planners. First, public transportation affects so many people’s lives every day, so the relevant agencies need to have a good understanding of the true state of customer experience in order to bridge any service quality shortfalls. Second, there is scarcely another service that is featured so
saliently in the public and political spheres. Given that service quality and customer satisfaction are carefully-tracked metrics used to demonstrate performance and lobby for financial support, public transport agencies have to be able to obtain reliable, representative data on the state of the system with little time lag.
As the digital age brings shifts in customer preferences and ushers in new possible business models for urban mobility, these changes pose further challenges and opportunities for the public transport sector (Prahalad & Ramaswamy, 2004). Today’s customers, growingly more accustomed to the on-demand economy and customer-centric user experience, continue to hold services to ever higher standards. To remain sensitive to consumers’ needs, service providers need to increasingly focus on proactively engaging customers to understand their service experience and build stronger relationships. These evolving new norms in the service sector challenge traditional methods and metrics for monitoring and evaluating public transport service quality. Customer satisfaction surveys are administered too infrequently and ask respondents to provide only general, overall ratings. This abstractness reduces the possibilities of associating satisfaction levels to specific trips and their attributes. It also shortchanges the potential to use riders as sources of information, hindering agencies from obtaining more spatially and temporally precise results.
The research behind this thesis was born out of the desire to help the public transport sector innovate its tools and organizational paradigm. I aspire to develop new tools that would collect actionable data to guide improvement efforts, as well as to showcase a model for empowering customers in co-monitoring the public
transport service quality. The unprecedented richness of data would also enable researchers to examine interesting questions related to travel behavior, customer satisfaction, and service performance. With the advance in new sensing and analytics
13
technologies, I look to leverage distributed data collection to accomplish these purposes. These tools, as I hope, will both enable and be supported by positive institutional changes in how the public transport sector engages and build relationships with its customers.
The development and deployment of the tools, as described in this thesis, has been a team effort. Though I initiated the idea and have managed the whole process, numerous professors, research scientists, engineers, and public transport agency colleagues have been closely involved in the design, development, and pilot of the smartphone platform. Hence, from time to time in this thesis, I will use the pronoun “we” when talking about endeavors that involving collaborators. This highlights the enormous efforts that the team has dedicated to this project, and their valuable contribution that cannot be unacknowledged.
1.2 Research questions
This thesis presents work from the last 17 months in pursuit of following key research questions:
1. How do public transport agencies currently assess and interpret service quality and customer satisfaction metrics? What are the strengths and shortfalls?
2. Can we develop a system that solicits real-time, high-resolution feedback on public transport services, both objectively and from the customers, down to the level of a specific trip, while minimizing user burden?
3. Are there any differences between passenger’s real-time satisfaction (reported during the trip) and recalled satisfaction with service (reported long after the trip)?
14
4. How do passengers’ reported satisfaction relate to objective trip attributes (e.g. wait time, travel time, smoothness of the ride)?
1.3 Organization
Chapter 2 synthesizes how the public transport sector currently assesses the quality of their service delivery. It defines the key concepts of quality of service and customer satisfaction, and highlights the connections and differences between them. It also synthesizes prior academic efforts in understanding public transport service quality and customer satisfaction, as well as current practices within the industry. The chapter ends by discussing the opportunities and challenges for smartphone-based innovations in service quality assessment.
Chapter 3 examines the theories, challenges, and potential of engaging customers and citizens in public service delivery. Along with Chapter 2, this chapter completes the two halves of the theoretical foundation for this thesis. Public service agencies can think of soliciting customer feedback as three inter-related objectives: to collect better data, to further institutional learning, and to strengthen relationship with the customers. I will draw examples from both public and private sectors to illustrate these objectives, and discuss the particular value and challenges for the public transport sector.
Chapter 4 describes the technology of the foundational Future Mobility Sensing (FMS) platform and the principles and processes in designing the Travel Quality Survey (TQ) extension.
Chapter 5 places Singapore and Boston – sites of the two FMS-TQ pilots – side-by-side. It compares and contrasts the two regions’ urban and public transportation contexts, as well as institutional arrangements and priorities. These factors have significantly shaped the technological and implementation designs of the pilots.
Chapter 6 details the proof-of-concept pilot conducted in Singapore in summer 2015. We put the platform to test for the first time, which proves some of the key capabilities of interests and exposes a number of areas needing significant re-design.
15
The chapter covers the trial design, pilot implementation, findings, and lessons learned from the pilot.
Chapter 7 presents the Boston pilot conducted in spring 2016. The pilot assumes a design considerably different from that employed in the Singapore pilot. The chapter details the pilot’s design, implementation and findings, similar to Chapter 6. It concludes by discussing lessons learned from both pilots.
Chapter 8 reflects on this journey during the last one and a half years – building consensus among diverse stakeholders, designing for academic inquiry and for practical user experience, working with two different public transport agencies, etc. It accentuates the importance of institutional arrangement in determining success of public-facing projects.
Chapter 9 discusses the implications of this research, identifies area for future research, and concludes.
16
Chapter 2
“So, how are we doing?”
“How satisfied are you with our service?” This question constitutes the timeless yardstick in the service sector. It is not hard to find words such as “service quality” and “customer satisfaction” in surveys, reports, and initiatives of private and public sectors providers alike, though the search for clear definitions or best measuring practices – particularly for public services – is much more arduous. This chapter first defines and distinguishes quality of service and customer satisfaction – two concepts on which this thesis is founded. While the definitions described in this chapter are rooted in the public transport context, the discussion also takes a bigger-picture look at these concepts in the service sector in general. It then synthesizes prior academic undertakings in understanding public transport service quality and customer satisfaction, and presents current practices of measuring these metrics in the public transport industry. The chapter concludes by discussing areas in which the industry should, and could, significantly benefit from new tools, systems, and mentalities in assessing how well they are serving their customers.
2.1 Definitions
“Quality of service”
Public transport literature commonly defines “quality of service” as “perceived performance from passengers’ point of view” (Hensher, Stopher, & Bullock, 2003; Kittelson & Associates, National Research Council (U.S.), Transit Cooperative Research Program, United States, & Transit Development Corporation, 2013; Tyrinopoulos & Antoniou, 2008). This customer-oriented emphasis distinguishes itself from traditional performance measurements that focus on system throughput and efficiency – annual passenger trips, vehicle miles, etc. Hensher et al. (2003)
17
points out that passengers evaluate services in many ways beyond the quantity of service consumed, taking into account also qualitative factors and individual preferences. As the business world often considers customers as the best judges of service (Berry, Zeithaml, and Parasuraman 1990), the term “service quality” in the public transport context has essentially come to mean service aspects that directly influence how passengers perceive their trip and of the provider overall.
Enumerating the defining aspects of service quality is much more difficult, as there is little consensus among scholars and agencies on the best combination of attributes. Studies have measured these concepts with as few as six (Kittelson & Associates et al. 2013) and as many as 31 components (Habib, Kattan, & Islam, 2011); most fall between 8-22 factors (J. de Oña, de Oña, Eboli, & Mazzulla, 2013; Eboli & Mazzulla, 2007, 2010, 2011; European Committee for Standardization, 2002; Friman & Fellesson, 2009; Hensher et al., 2003; Tyrinopoulos & Antoniou, 2008). Of course, this diversity comes partially from the varying levels of specificity and ways to categorize attributes, so overlaps are common.
The most frequently included attributes are (in alphabetical order): Accessibility (distance and ease of access to stops);
Connectivity (whether route is direct, transfer facilities); Driver’s service; Fare; Information availability; Onboard comfort; Reliability; Safety; Service frequency;
Service of non-driver staff; Stop and station conditions; Travel time;
Vehicle cleanliness;
Vehicle crowding level; and Wait time
18
It should be noted, however, that many literatures blur the line between quality of service and customer satisfaction, so most of the above attributes are discussed in the former context in some literature but the latter context in other works. Indeed these two concepts are tightly connected, and I will further discuss their relationship later in the chapter.
Of all these service quality elements, which ones are the most fundamental? Taking a step back to examine the general concept of service quality, one would discover a wealth of scholarship and debate, stemming largely from the marketing discipline (Babakus & Boller, 1992; Brown, Churchill, & Peter, 1993; Cronin & Taylor, 1992) The hallmark constructs of service quality is the SERVQUAL model,
conceptualized by Parasuraman, Zeithaml, and Berry (1988). The authors conceptualize “service quality” as a comparative function between consumer expectations and actual service performance (the “Gap Model”). Through stated preference studies of multiple service industries, they identify five pillars of service quality, under the acronym RATER:
Tangibles: Physical facilities, equipment, and appearance of personnel; Reliability: Ability to perform the promised service dependably and
accurately;
Assurance: Knowledge and courtesy of employees and their ability to inspire trust and confidence;
Responsiveness: Willingness to help customers and provide prompt service; and
Empathy: Caring, individualized attention the firm provides its customers. With a few adjustments, this five-dimension framework can be adapted to fit the public transport context (Elmore-Yalch, 1998; Tripathi, Kumar, & Gunjan, 2012). Table 2.1 displays my own adaptation of the RATER model. The “Empathy” dimension is perhaps the trickiest, since mass transit service is, arguably, by nature at odds with delivering intimate, personalized services to customers. Some scholars hence propose excluding the “Empathy” category (Barabino, Deiana, & Tilocca, 2012; Too & Earl,
19
2009) when assessing public transport quality. I believe, however, that empathy is still possible through relationship-building: understanding the customers, seeking feedback on their experiences and input for improvement. While enabling this capacity for empathy in public transport services resembles a paradigm shift, it is an increasingly relevant priority. The so-called Transportation Networking Companies (TNCs) – providers of app-based, on-demand ride services – have been rapidly gaining mode share, and one of the key reasons for their popularity is the more
amicable interactions between customers and drivers (Li & Zhao, 2016). This thesis is largely inspired and motivated by the potential to drive this exact paradigm shift in the public transport sector through technological innovations, which I will discuss further in the next chapter.
Table 2.1 - Public transport quality attributes under the SERVQUAL model
Service quality aspects
Tangibles
Accessibility to stop/station Stop/station facilities Wait time
Travel speed/time Seating & personal space On-board comfort
Directness of route/ need for transfers
Reliability
Reliability of wait time
Reliability of being able to board bus/train Reliability of travel time
Assurance
Availability & accuracy of information Bus driver’s skills
Attitude and quality of customer service Sense of safety & security
Responsiveness Assistance to customers when needed
Empathy Understanding of customer experiences
20
“Customer satisfaction”
The term “customer satisfaction” has become synonymous with “service quality” in the public transport sector. Given that service quality is by definition customer-centric, assessing it typically involves customer satisfaction measurements (Eboli and Mazzulla 2009). Likewise, results of customer satisfaction surveys have become the de facto service quality indicators for many public transport agencies – I will reference multiple agencies’ approaches later in this chapter. Despite its
prevalence, the concept of customer satisfaction has scarcely been defined clearly in the public transport literature. Most surveys simply ask passengers to rate their satisfaction with the overall service and individual attributes on a Likert scale (Elmore-Yalch, 1998), and interpret the numeric value as the level of satisfaction.
Is equating “satisfaction” with “service quality” justified? As with “service quality,” most of the prior scholarship on customer satisfaction comes from the market research world. The “Disconfirmation Paradigm,” which highly resembles the “Gap Model” established by the service quality literature, views satisfaction as an emotion resulting from confirmation or disconfirmation of expectations (Cronin, Brady, & Hult, 2000; Cronin & Taylor, 1992; Oliver, 1981; Parasuraman et al., 1988; Rust & Zahorik, 1993). Namely, a consumer is satisfied when 1) the service
experience is as expected and her expectations are confirmed, or 2) the experience is better than expected and thus positively disconfirms the expectations. On the flip side, dissatisfaction arises when service is below expectation (Churchill & Surprenant, 1982).
Given these similarities, numerous researches have sought to disentangle the relationship between “service quality” and “customer satisfaction.” There is no clear consensus among the debate. Some theoretical papers distinguish satisfaction and quality by their timeframe – specific, short-term evaluation vs. more general, long-term judgements – though even scholars who prescribe to this distinction have conflicting views on the corresponding timeframe for each concept (Bitner & Hubbert, 1994; Oliver, 1993; Parasuraman, Zeithaml, & Berry, 1985). Subsequent
21
empirical studies find that people do not clearly distinguish the two concepts from each other – their assessment of service in respect to both “quality” and “satisfaction” posit a relative judgement of experience versus expectation and result in future purchase intentions as a consequence (Iacobucci, Amy, & Kent, 1995). Other scholars, assuming distinction between satisfaction and service quality, have looked at how the two concepts inter-relate. Among their research, there is a partial consensus that “customer satisfaction is the result of a customer’s perception of the value received, where value equals perceived service quality relative to price”(Cronin, Brady, and Hult 2000). This is to say, in case a customer perceives a service experience mediocre in quality, she might still be rather satisfied if she feels she has gotten a good “bang for the buck.”
Synthesizing the above literatures in the public transport context, I have decided to conform to the industry practice and use customer satisfaction as a measurable indicator for service quality. There is no strong evidence that these two terms evoke significantly different connotations, especially for the average rider. Even if we posit that there are granular differences at a theoretical level, the constant and low price of a bus or subway ride (between $1 - $3 in the U.S.) would only lessen the distinction between satisfaction – which has an associated value assessment -- and service quality. So in the public transport context, asking passengers the question “how satisfied are you with our service?” may in fact well answer the question “how are we doing in servicing our customers?”
The importance in studying and improving ways to assess service quality and customer satisfaction are two-fold. First, public transportation, being a service industry, has an inarguable responsibility to ensure that (most of) those whom it serves are happy with the service. Second and more practically, service quality and customer satisfaction have been proven to shape behaviors – this could affect
ridership and the health of the system. Numerous studies find that perceived service quality is one of -- if not the most – important determinants of customer satisfaction (Cronin et al., 2000; Eboli & Mazzulla, 2011; Fornell, Johnson, Anderson, Cha, & Bryant, 1996), and these two indicators are affirmed, by an even larger body of
22
literature (Table 2.2), to affect the customers’ intention for future patronage. As many new urban mobility services have emerged over the recent years, people now have more choices than ever when making a trip. For public transport to improve its appeal and maintain its relevance in urban mobility, it would have to accord higher priority to better understanding and improving users’ experiences. The next section summarizes the efforts in understanding public transport service quality and
customer satisfaction to date.
Table 2.2 - Literature linking quality, value, and satisfaction to customer behavioral outcomes
Source: Cronin, Brady and Hult (2000).
SQ = service quality; BI = behavioral intention, SAT = satisfaction, SAC = sacrifice, SV/VAL = service value
23
2.2 Understanding public transport service quality and customer
satisfaction
Academic research on these topics has overwhelmingly focused on identifying attributes that most strongly influence riders’ satisfaction of local public transport services. Most of these efforts aim at testing a particular model and devising a new service quality indicator ever-so-slightly different from the existent types. The studies are best differentiated along two dimensions: data collection and analysis method. As the results are heavily tied to the studies’ context – the status quo of the public
transport system, the local culture, etc. – there is little convergence among the findings.
One of the most common approaches involves asking respondents to rate the importance of various service attributes (e.g. wait time, comfort), their level of satisfaction with those attributes, and their satisfaction with the service overall (Efthymiou, Kaziales, Antoniou, & Tyrinopoulos, 2014; Tyrinopoulos & Antoniou, 2008). The main advantage of these so-called “stated importance” methods is ease of interpretation – it is simpler to obtain the attribute’s importance, and results are more intuitive (Weinstein 2000). But it has also some critical disadvantages. First, it is susceptible to the so-called “Top Box Problem.” Most customers, when asked about the importance of an attribute, tend to rate it as either “very important” or
“important” – ticking off one of the top boxes on the answer sheet (Morpace International et al. 1999). As Weinstein (2000) notes, passengers may rate police presence on buses as “very important”, but it may have little to do with their overall satisfaction with the service. This phenomenon mutes differentiation in importance ratings among the factors of interest, potentially masking truly significant drivers of satisfaction from being identified. Furthermore, stated importance methods add to the length of questionnaires – respondents would have to state the importance in
addition to rating the satisfaction level/perceived performance for each service
attribute (Weinstein, 2000).
A related approach – derived importance measures – purports to overcome the above mentioned disadvantages. It asks respondents to rate only their satisfaction
24
with individual service attributes (e.g. wait time, comfort) and the overall service (Budiono, n.d.; Celik, Aydin, & Gumus, 2014; J. de Oña et al., 2013; Del Castillo & Benitez, 2012; Eboli & Mazzulla, 2007, 2010; Habib et al., 2011). Researchers then determine the importance of each attribute from statistical association between individual attribute ratings and the overall satisfaction rating (Morpace International et al. 1999). This method mitigates the “Top Box Problem” and involves shorter questionnaires, and hence is often preferred by researchers and academics
(Weinstein, 2000). The downside, however, is the analytical complexity involved – the results are not always intuitive or easy to explain to stakeholders (R. de Oña, Eboli, & Mazzulla, 2014; Weinstein, 2000).
The last major approach attempts to quantify importance of attributes through stated preference experiments. Instead of asking passengers for ratings of individual attributes, this approach examines passengers’ expressed choices among hypothetical sets of alternatives with varying service attributes (Cantwell, Caulfield, & O’Mahony, 2009; Eboli & Mazzulla, 2008, 2010; Prioni & Hensher, 2000). The most seminal work on public transport quality using this approach is by Hensher et al (2003), which presents to respondents 27 “bus packages” – service scenarios with varying levels of performance for 13 attributes. The average number of passengers choosing a given bus package is used to approximate the overall perceived satisfaction with the service scenario; the contribution of each attribute to the overall satisfaction can also be computed through discrete choice models.
The data analysis that ensues is largely divided into two camps. The majority of studies seek to quantify the relationships between reported satisfactions of service overall and of individual attributes. For this research question, multiple regression analysis is the most common analytical technique (Kim & Lee, 2011; Weinstein, 2000) The overall reported satisfaction level is regressed on satisfaction rating for
individual attributes to tease out their significance. (Kim & Lee, 2011; Weinstein, 2000)Some studies, particularly those that include a large number of service attributes in their explanatory set, first perform structural equation modelling to identify potential latent variables, reducing the many service attributes tested into a
25
smaller numbers of dimensions that contribute to satisfaction measures (J. de Oña et al., 2013; Eboli & Mazzulla, 2007; Karlaftis, Golias, & Papadimitriou, 2001; Shaaban & Khalil, 2013; Stuart, Mednick, & Bockman, 2000). Studies that collect data through stated preference surveys tend to employ discrete choice models in analyzing service attributes’ importance for customer satisfaction (Eboli & Mazzulla, 2010, 2011; Hensher et al., 2003; Prioni & Hensher, 2000). The second, smaller group of studies attempt to discern potential heterogeneities in customers’ assessment of public transport services. Wallin and Andreassen (1995) find that high- and low- frequency public transport users have different preferences; Eboli and Mazzulla (2009) propose a Heterogeneous Customer Satisfaction Index that improves upon the Customer Satisfaction Index by taking riders’ heterogeneities in perception into account.
Given the diversity of service attributes examined by various studies, their findings offer little defining insights altogether. A wide range of service factors has been found to be important in customer evaluations of public transport service quality (Stathopoulos & Marcucci, 2014). A partial list includes: reliability (Friman, Edvardsson, and Gärling 2001); frequency, travel time and fare level (Hensher et al., 2003); comfort and cleanliness (dell’Olio, Ibeas, & Cecin, 2011; Eboli & Mazzulla, 2007); stops and waiting environment (Iseki & Taylor, 2010); safety issues (Friman and Fellesson 2009); network coverage/distance to bus stops (Tyrinopoulos & Antoniou, 2008), etc. If an agency were to look to these literatures for insights on service quality or customer satisfaction, it may be somewhat disappointed. Given the local nature of the results, one cannot simply generalize and reference the factors deemed significant in any study as the key characteristics to monitor within a
particular public transport agency. In terms of methodology, since rarely does a study apply and compare two approaches on the same data set, there is little insights on which method works best – and under what circumstances. Furthermore, much of the scholarly attention is placed on experimenting with new modelling and
score-building techniques, rather than exploring new methods to collect customer
satisfaction data in more efficient and meaningful ways. This latter pursuit is arguably more relevant to public transport agencies.
26
2.3 Current industry practices
In terms of measuring perceived service quality and customer satisfaction, the state of the art within the public transport sector may not be emblematic of the 21st century. In the U.S., the most prevalent channels are intercept surveys (onboard or at stops/stations), telephone surveys, and web-based surveys. Many agencies use multiple, complementary channels to capture a wider respondent pool. Intercept supplemented with telephone survey has been the most popular method, although an increasing number of agencies have adopted web-based tools in recent years. In Singapore, the country’s Land and Transport Authority (which plans, regulates, and oversees public transport services), conducts intercept surveys of riders at
stops/stations. There is no known case of agencies routinely leveraging newer technologies, such as smartphones1, to conduct customer satisfaction surveys.
Surveying frequency varies among agencies. In Spitz et al (2006)’s examination of survey practices among U.S. transit agencies, about 45% conduct customer
satisfaction assessment one or more times a year, 30% less than once a year, and 20% have never done one.
Typically, public transport agencies carry out repeated cross-sectional
sampling of customers. Each cross-section measurement thus resembles the one-time academic exercises discussed earlier. Akin to in academic studies, these
questionnaires also commonly ask respondents to rate their satisfaction with overall service and its individual attributes – wait time, reliability comfort, etc. The number of service attributes presented and the level of detail vary widely. In a TCRP review, the number of attributes measured by agencies ranges from as few as five and as many as 48 (Morpace International et al. 1999). Agencies may also solicit passengers’ reported importance of various service attributes. Evaluations are collected
periodically, and ratings are averaged to generate scores for historical comparisons among cross-sections. This is known as the “scorecard approach.” Agencies may
1 Smartphone: a cellular phone that performs many of the functions of a computer, typically having a
touchscreen interface, Internet access, and an operating system capable of running downloaded applications. (source: Oxford Dictionaries)
27
publish these scores to demonstrate the progress (or regress) made over the recent periods; some agencies, such as NJTransit, even call it “The Scorecard” (Figure 2.1). The idea is that public transport services can be aggregately measured and tracked from time to time, as, for example, with a student’s academic performance.
Figure 2.1 – NJ Transit’s Scorecard
The primary limitation of this scorecard approach is the incapability for ubiquitous, detailed assessment and feedback (Dunlop, Casello, & Doherty, 2015; Elmore-Yalch, 1998). Considering that public transport customer satisfaction surveys are often done at an annual (or lower) frequency, questionnaires often ask
respondents for general assessments of the service (Carrel, Mishalani, Sengupta, & Walker, 2015). This puts regulators and system administrators at a disadvantage in obtaining high-resolution data – information that can reveal performance variations by driver, route, and time of day, as well as the precise areas for commendation and targeted improvement (Elmore-Yalch, 1998). For example, according to NJTransit’s
28
Scorecard, customers’ overall satisfaction decreases from 6.4 in 2014 (first quarter) to 6.1 a year later, and satisfaction scores have dropped for virtually all service attributes (NJ Transit 2015). But what does this mean for the agency? Are the differences significant? If so, to which areas should the resource-strapped agency devote its capital and personnel for improvement? Even if a few attributes – say, cleanliness, service frequency – have been identified as priority areas, it still reveals little information as to which routes, vehicles, and/or stops should be improved. Of course, traditional in-person questionnaires, administered during or after the ride, can solicit trip-specific assessment, but their scopes are limited without a major commitment to staffing. Public transport experiences can vary from trip to trip, but it would not be realistic to deploy survey teams to every bus, stop, and station every day.
Some agencies have attempted to go beyond the general service assessment by asking their customers about specific trips in gauging service quality. For example, the Massachusetts Bay Transportation Authority (MBTA) asks their Customer
Opinion Panel members to choose a particular recent trip to base their reflections on (Boroyan, 2014). Singapore’s Land Transport Authority (LTA) asks respondents to reflect on their most recent bus or subway trip in answering the customer satisfaction surveys (Land Transport Authority, 2016c). However, such recalled assessment may be inaccurate, as people’s actual and recalled experiences often differ due to
psychological heuristics or unobserved events (Fredrickson & Kahneman, 1993). Pedersen et al (2011), by recording 62 volunteers’ predicted, experienced, and remembered satisfaction of bus and subway trips for a month, reveal that recalled satisfaction is significantly lower than experienced satisfaction. Abou-Zeid et al (2012) observe a similar bias, noting that subjects report lower satisfaction with public transport after experiencing a commute by automobile. This phenomenon implies that, the sooner that a rider is given the chance to report her level of satisfaction, the more accurate she is able to report the extent of disconfirmation. Recently, and as detailed further below, some public transport agencies have
29
solicitation with new technological tools. Our project, FMS-TQ, is a further attempt at capturing more accurate, high-resolution, and actionable customer feedback on public transport experience.
Another approach uses panel-based instead of cross-sectional surveys. Panel surveys are advantageous for several reasons. They reduce the chance of confounding differences in measured satisfaction across years with differences between cross-sectional samples (Spitz et al., 2006). Since changes in behavior of each individual are directly observed, the sample sizes required to measure differences in customer satisfaction can be much lower than the cross-sectional approach. Panel surveys also allow for the costs of recruiting individuals to complete surveys to be spread out over multiple survey periods (Chow, 2014). A number of agencies – NJTransit, Metrolink (Los Angeles), and GO Transit (Greater Toronto and Hamilton, Canada) – tracks customer satisfaction with panels through the use of web-based surveys (Chow, 2014; Spitz et al., 2006).
The prevalence, merits, and shortcomings of the common customer
satisfaction survey channels -- intercept, telephone, web, and hybrid methods – are described below. The discussion will reference practices in Singapore by the Land and Transport Authority (LTA), as well as at the top 10 U.S. transit systems (as measured by unlinked passenger trips): New York City Transit (NYCT), Chicago Transit Authority (CTA), Los Angeles County Metropolitan Transportation Authority (LACMTA), Washington Metropolitan Area Transit Authority (WMATA),
Massachusetts Bay Transportation Authority (MBTA), Southeastern Pennsylvania Transportation Authority (SEPTA), New Jersey Transit Corporation (NJ TRANSIT), San Francisco Municipal Railway (MUNI), Metropolitan Atlanta Rapid Transit Authority (MARTA), and MTA Bus Company (MTABUS). Table 2.3 summarizes the practice, which shows that even among the top agencies, data collection approaches are divided somewhat equally among intercept, web, and telephone channel.
30
Table 2.3 - Service quality/customer satisfaction survey methods used in Singapore and by top 10 U.S. transit systems
Agency Most recent survey
(publically available) Intercept
Web-based Phone Other Singapore
LTA 2015 Public Transport Customer
Satisfaction Survey X
United States
NYCT 2014 Customer Satisfaction
Survey X
CTA 2013-2014 RTA Customer
Satisfaction studies X X
LACMTA Spring 2015: Metro
Rail/Bus/System-wide Customer Satisfaction Survey
X x Focus
groups
WMATA Voice of the Customer survey
(1st Quarter, FY 2013) X
Mystery rider
MBTA Customer Opinion Panel X
SEPTA 2012 Customer Satisfaction
Survey X X
NJTransit ScoreCard (2nd Quarter, FY2016) X
MUNI 2013 MUNI On-board Customer
Survey X X
MARTA 2014 Quality of Service Survey X
MTABUS Unknown
2.3.1 Intercept survey
The most common method for measuring service quality and customer satisfaction is intercept survey, either onboard or at stops/stations. The LTA has employed this method annually for Singapore’s public transport services since 2006 (Land Transport Authority, 2016c). Of the 27 U.S. transit agencies and Metropolitan Planning Organizations (MPO) surveyed in 2006, three-quarters report using intercept surveys (Spitz et al., 2006). Under this approach, questionnaires are distributed to passengers onboard vehicles or waiting at stops or stations. Questionnaires can be in paper format, which
respondents may complete and return either in-person or mail back later. Onboard surveys can also be conducted as personal interviews, in which case a surveyor asks riders a short series of questions and records the answers. With the aid of technology,
31
interviewers may also administer surveys on tablets, digitally recording the results directly (Agrawal, Granger-Bevan, Newmark, & Nixon, 2015; Ching, 2012; Schaller et al., 2005). In addition to customer satisfaction, intercept surveys are also used by agencies to collect information on rider demographics, origin and destination of the trip, and reasons for taking public transport (Schaller et al., 2005). The exact types and wording of questionnaire, as well as survey frequency, vary among agencies. Large agencies typically conduct five or more on-board/intercept surveys annually, primarily focused on specific routes or geographic areas. Smaller agencies typically conduct surveys every one to three years, often covering the entire network (Schaller et al., 2005).
Singapore’s Public Transport Customer Satisfaction Survey (PTCSS), conducted annually by the LTA, interviews close to 4,000 regular bus and subway commuters at stops and stations. Respondents are asked to rate their level of satisfaction with, and importance of, eight service attributes for their recalled last public transport trip. The satisfaction ratings are weighed by their respective importance measures to produce an overall satisfaction rating for the bus and subway services (Land Transport Authority, 2016c).
32
Table 2.4 - Results of the 2015 Singapore PTCSS
Source: Land Transport Authority, 2016
Most of the top 10 U.S. transit systems also use intercept survey to gauge service quality and customer satisfaction, though many of them use it in parallel with telephone- or web-based questionnaires as well. The Los Angeles County
Metropolitan Transportation Authority (LACMT) stands out as the only Top 10 agency that uses onboard surveys as the primary method for gauging customer satisfaction. Since 2001, the LACMT has distributed paper surveys once a year on buses and trains. The questionnaire focuses on service quality indicators such as on-time performance, operator courtesy, cleanliness, and overall satisfaction with service. It boasts a high response rate of over 50%, with 15,000 to 20,000 surveys usually completed every year (LACMT 2016). The onboard survey effort is
supplemented by focus groups, which provide more in-depth qualitative information about one or two specific topics – ticketing vending machine redesign, using real-time information, etc. (LACMT 2016). Likewise, the Metropolitan Atlanta Rapid Transit Authority (MARTA) conducts its Quality of Service Survey on an almost annual basis by randomly sampling from patrons on rail platforms and on fixed-route buses. During fiscal year 2014, the agency collected 6,512 responses in total (MARTA, n.d.).
The prevalence of intercept surveys stems largely from their advantages in gaining direct access to customers and obtaining relatively representative samples. Surveys can be conducted on particular lines, or at specific locations or times, to
33
examine the service quality and customer satisfaction in detail. For instance, the King County Metro of Seattle, Washington has surveyed only riders in the downtown Ride Free Area (Schaller et al., 2005). The Chicago Transit Authority (CTA) has conducted one survey of riders on all bus and rail routes on the West Side and another on the Douglas Line segment of the Blue Line (Schaller et al., 2005). The stratified samples, combined together, can render a highly representative cross-sectional view of the entire system. In fact, for municipalities where only a small percentage of the
population uses public transport, these advantages make intercept surveys the most cost-effective way to gather information (Schaller et al., 2005).
On the other hand, conducting intercept surveys for an extensive system can be resource intensive. Staff is needed to administer and retrieve every individual survey, and then enter data into a database. Surveying a whole network, or even a large number of lines, may take several months (Chow, 2014). Given the personnel involvement required, the frequency of surveying – and hence the comprehensive and continuity of information collected – may be limited. Public transport
experiences can well vary from trip to trip, but it would not be realistic to deploy survey teams to every bus, stop, and station every day. Of course, this last
shortcoming is relevant to all conventional public transport survey methods, rather than being unique to intercept surveys.
2.3.2 Telephone-based survey
Telephone-based methods have been popular among public transport
agencies in collecting customer feedback, and often used as a supplement to intercept surveys. Respondents are recruited in-person, by telephone, or via other channels (such as mailing), and once indicating interest in participating, an interviewer contact the respondents by phone. Since the 1990s this is usually conducted with the use of computer-assisted telephone interviewing, CATI. The interviewer reads questions from a computer screen to the respondent, and type the responses into the computer.
34
Depending on the logical flow of the questionnaire, CATI can skip parts of the questionnaire and bring up the intended question based on the response entered. Since responses are immediately entered and recorded into a computer, CATI
eliminates manual data transfers and reduces transcription errors. Its weaknesses, on the other hand, lie in the difficulty in recruiting a representative or targeted sample, especially in municipalities where a small percentage of the general population are public transport users. Given these weaknesses, some guides discourages smaller public transport agencies from using CATI for surveying customers (Baltes, 2002).
Of the Top 10 U.S. transit agencies, three use telephone surveys as the main service quality assessment tool: the New York Metropolitan Transportation Authority (NYMTA), the Washington Metropolitan Area Transit Authority (WMATA), and the Southern Pennsylvania Transportation Authority (SEPTA). The 2014 NYMTA Customer Satisfaction Survey, for instance, interviewed over 1,800 New York City residents using a random sample of landline and cell phone numbers. In-depth interviews were conducted with 1,200 customers who took at least one ride in the past 30 days. The interviews were conducted in English, Spanish, and Chinese, and lasted on average 27 minutes (New York City Transit 2014). The WMATA Voice of the Customer survey administers a 17-minute phone survey to approximately 770
customers each quarter. Similar to the NYMTA survey, it randomly samples from landline and cellphone numbers, and respondents need to have taken the local public transport service in the past 30 days in order to be eligible. WMATA also conducts a separate phone survey of its paratransit users on a semi-annual basis (Washington Metropolitan Area Transit Authority 2014). SEPTA’s Customer Satisfaction Survey samples households in the service region by phone, and asks respondents about their public transport experiences in the previous 7 days (SEPTA 2013).
2.3.3 Web-based survey
Web-based method is a late entrant into the public transport survey realm. In 2006, when the Transit Cooperative Research Program (TCRP) published the most
35
recent report on this matter in the sector, just 25% of the 36 agencies interviewed had used web surveys to collect customer satisfaction information (Spitz et al., 2006). Schaller (2005)’s sampling of 52 U.S. public transport agencies found 44% of
organizations using web surveys for any purpose. However, most of these practices still relied largely on in-person or telephone recruitment – only 6% of the agencies surveyed recruited respondents by e-mail or with a web link (Spitz et al., 2006).
The primary advantage of web-based surveys is time and cost efficiency. In Spitz et al (2006)’s report, 70% of respondents who were using web-based surveys then cited “fast turn-around” and “cost effectiveness” as their motivations for
employing such tools. Several studies have found that online surveys have the ability to collect a large sample more quickly at a lower cost compared to traditional surveys (Chow, 2014). The cost saving stems not only from the reduced need for in-the-street fieldwork, but also from the faster turn-around and less effort for data entering and cleaning (Schaller et al., 2005). Web-based method have other valuable advantages, allowing for presentation of complicated subject matter, question design, and
graphics, and for strict ordering of the questions to be completed (Chow, 2014; Evans & Mathur, 2005; Schaller et al., 2005). Web-based methods also provide for
convenience in tracking respondents over time for panel studies, as people’s email addresses tend to change infrequently.
The main concern for using web-based technology for surveys has been biases against population with no, or limited, access to the Internet. In Schaller’s 2005 report, nearly all agencies that used web-based surveys reported worrying about not being able to reach a reliable cross-section of their audience (Schaller et al., 2005). The saliency of this disadvantage has since decreased, as Internet access has much proliferated over the past decade. Web-based channel has become the dominant or sole survey method for several of the largest transit agencies in the U.S. Since 2011, NJTransit has been conducting system-wide online customer satisfaction surveys, with the most recent 18th tracking period completed in November and December
2015 (NJ Transit 2015). The Massachusetts Bay Transportation Authority (MBTA) gathers ongoing feedback through a web survey, which is sent to a rotating third of
36
their customer panel every month (Boroyan, 2014). These initiatives within leading public transport agencies have shown web-based surveys as a viable method, and we are likely to see more adoption of this approach in the future.
2.3.4 Other methods
Aside from the techniques above, agencies may combine multiple methods as complements. For example, when the Regional Transportation Authority last
conducted a customer satisfaction survey for three agencies in the Chicago region, it leveraged the web via email invites as well as onboard recruitment efforts (RSG 2015). The San Francisco Municipal Railway (MUNI) conducts quarterly online customer satisfaction surveys, sampling from an opt-in online panel; in addition, it also conducts a multilingual onboard survey (last completed in 2013) of over 22,000 customers (SFMTA 2014).
Intercept interviews are also often used to gather names, telephone numbers and/or email addresses for phone or web-based surveys later. For example, for its Customer Satisfaction Survey, SEPTA intercepts riders at various locations to request their contacts, but also supplements the pool with a random telephone sampling of households in the region (SEPTA 2013). Such a combination is quite suitable where incidence of public transport user is too low for digital dial telephone interviewing, yet the survey is too long or complex for onboard and intercept interviews. As Schaller points out, the combination is particularly cost-effective for commuter rail, for which a large percentage of riders pass through a downtown terminal during specific time periods (Schaller et al., 2005).
Another once-common method is mailing. Questionnaires are randomly sent to potential respondents to complete and return by post. With the proliferation of telephone and Internet access, as well as the emergence of new technologies, however, there remains essentially no advantage to mail surveying. Turnaround is longer, and surveyors likely need to send a follow-up mailing to increase the overall
37
response rate (Baltes, 2002). As a result, none of the leading public transport agencies examined in this thesis still use this method to collect customer satisfaction data.
One final approach to assessing service quality is a Passenger Environment Survey (PES), conducted using the “secret shopper” technique. Developed by the New York City Transit2 in 1983 and since majorly revised, PES is an internal performance
audit of the passenger experience in vehicles and stations. Different from the methods described earlier, where ordinary riders constitute the source of feedback, secret shoppers are usually trained personnel who use the service as a normal customer, and rate the attributes from the perspective of a regular passenger (Eboli and Mazzulla 2012). The advantage is that these trained “customers” have common standards against which to rate the service. This is a tradeoff against
representativeness of responses, however, and it technically defies the very customer-centric nature of service quality surveys.
Figure 2.2 - Flows of conducting various methods of customer surveys
2 The New York City Transit (NYCT) is one of the six agencies of the New York Metropolitan
Transportation Authority (NYMTA), operating the New York City Subway, Staten Island Railway, and New York City Bus systems.
38
The review of industry practices reveals that service quality and customer satisfaction assessment remains at an aggregate level. Public transport operators and regulators largely collect and treat customer satisfaction measurements as a
scorecard, aggregating ratings provided by respondents on the service in general. This does not fulfill the full value of customer satisfaction inquiry, as much pertinent information on the day-to-day public transport experience may be lost in the
surveying process. Recognizably, this inefficiency is a result of the limitations of the tools available to operators. Although intercept, telephone, and web-surveys can obtain a fairly representative sample and approximate general public sentiments, none of these methods are cost-effective or practical in obtaining high-resolution information.
2.4 Role of smartphones in advancing public transport service
quality assessment
In recent years, the attention has turned to smartphones as a potential new medium for data collection. The comparative advantages of smartphone-based surveys include information richness, real-time speed, cost efficiency, and ubiquity. Surveyors can obtain details about the trip experiences from smartphones and their sensors – precise time and location information (GPS, Wi-Fi, cell tower), vehicle acceleration profile (accelerometer), and ambient temperature (thermometer) and noise (microphone). The geospatial and temporal information can help associate the collected data to specific service runs or stations/stops. As people tend to carry their phones with them most of the time, information can be collected and transmitted to the server in real-time. Such surveys may reduce the need for mobilizing field surveyors, reducing the time and cost of survey administration. They can also be deployed over extended periods of time and space, enabling intra-day, inter-day and inter-seasonal assessments for numerous routes, stops, segments, etc. Last but not least, well-designed smartphone apps can enhance the user-friendliness and