Publisher’s version / Version de l'éditeur: Technical Report, 2012-08-01
READ THESE TERMS AND CONDITIONS CAREFULLY BEFORE USING THIS WEBSITE.
https://nrc-publications.canada.ca/eng/copyright
Vous avez des questions? Nous pouvons vous aider. Pour communiquer directement avec un auteur, consultez la première page de la revue dans laquelle son article a été publié afin de trouver ses coordonnées. Si vous n’arrivez pas à les repérer, communiquez avec nous à PublicationsArchive-ArchivesPublications@nrc-cnrc.gc.ca.
Questions? Contact the NRC Publications Archive team at
PublicationsArchive-ArchivesPublications@nrc-cnrc.gc.ca. If you wish to email the authors directly, please see the first page of the publication for their contact information.
For the publisher’s version, please access the DOI link below./ Pour consulter la version de l’éditeur, utilisez le lien DOI ci-dessous.
https://doi.org/10.4224/21268047
Access and use of this website and the material on it are subject to the Terms and Conditions set forth at
Overwintering of barges in the Beaufort - assessing ice issues and
damage potential
Barker, Anne; Timco, Garry
https://publications-cnrc.canada.ca/fra/droits
L’accès à ce site Web et l’utilisation de son contenu sont assujettis aux conditions présentées dans le site LISEZ CES CONDITIONS ATTENTIVEMENT AVANT D’UTILISER CE SITE WEB.
NRC Publications Record / Notice d'Archives des publications de CNRC:
https://nrc-publications.canada.ca/eng/view/object/?id=06003e42-c710-45ea-95f9-150cf0d728a7 https://publications-cnrc.canada.ca/fra/voir/objet/?id=06003e42-c710-45ea-95f9-150cf0d728a7
OVERWINTERING OF BARGES IN THE BEAUFORT -
ASSESSING ICE ISSUES AND DAMAGE POTENTIAL
Anne Barker and Garry Timco
Ocean, Coastal and River Engineering,
National Research Council of Canada
Ottawa, ON K1A 0R6
Canada
Report prepared for
Beaufort Regional Environmental Assessment Program
Technical Report
OCRE-TR-2012-008
EXECUTIVE SUMMARY
Overwintering of vessels and barges has been carried out in the Arctic for many years, in the Beaufort as well as in other regions of the Arctic and southern Canada. Draft guidelines from Transport Canada exist for this practice. However, there is uncertainty concerning the damage potential for structures that may be left to freeze-in within the landfast ice region of the Beaufort Sea, particularly those that contain petroleum products. This is a great concern for the Inuvialuit, among others.
There is evidence that this freeze-in could be (and has been) done safely but it is not clear how often this has been done or the conditions required to ensure safe overwintering of vessels in the Beaufort Sea. No information exists on the likelihood of damage due to ice or its possible effects. A detailed study focused on the conditions of the Beaufort Sea would greatly aid many stakeholders on the magnitude of this problem and its possible impact.
This study brought together different types of relevant data and information to resolve this important issue, with a focus on the ice loading considerations. As such, the objective of this project was to assess the damage potential for vessels or barges overwintering in land-fast ice. The project will inform the Inuvialuit and Regulators on the likelihood of damage and provide information on the best-available means of reducing the likelihood of damage to vessels overwintering in ice in the nearshore region of the Beaufort Sea.
The report steps through illustrative scenarios, in order to provide examples of the types of ice loads that could occur in representative overwintering locations. These scenarios lead to the provision of a framework of methods used to evaluate ice loads on vessels. This framework can be applied to assess ice loads on a specific vessel with known structural integrity at a specific location, by a team of qualified operational, ice mechanic and naval architect experts. No design considerations are provided, as that assessment would be too case specific to be of use in an overview of this subject area.
The authors conclude that a sheltered spot, with a limited fetch area, to limit pack ice driving forces is a key factor to minimizing the likelihood of damage due to ice. It is not sufficient to say that a vessel will be in landfast ice conditions throughout the winter. There are many locations where a vessel may be in landfast ice conditions for most of the winter, but the vessel may be in dynamic conditions come the spring break-up period. During this period, depending upon the location, ice crushing forces on a vessel and/or ice loads can be sufficient to break mooring lines and potentially damage a vessel. Thus, the overwintering location should have minimal dynamic ice movement in the spring, to avoid this scenario.
Finally, in order to partially alleviate concerns about the practice of overwintering, and more specifically, overwintering of fuel barges, the authors recommend that the Inuvialuit Settlement Region implement their own record-keeping of fuel barges that are overwintering. This would take the form of a simple record of location, vessel and contact information. Having a record of overwintering, and a method of tracking it, may help to provide more data on the practice, guidance on best practices related to overwintering (such as notification for affected communities and those travelling in the vicinity of the vessel), and peace of mind in terms of sound site selection practices and monitoring.
TABLE OF CONTENTS
EXECUTIVE SUMMARY ... i
TABLE OF CONTENTS ... ii
TABLE OF FIGURES ... iii
TABLES ... iv
1. INTRODUCTION ... 1
2. OVERVIEW – OVERWINTERING IN ICE ... 3
2.1 Historical Overview of Overwintering in the Western Arctic ... 3
2.2 Draft Arctic Waters Guidelines for Lay-Up of Petroleum Barges in Landfast Ice ... 7
2.3 Transport Canada Consultation Activities ... 8
2.4 Local Concerns ... 8
3. ANALYSIS APPROACH ... 12
4. SHELTERED BAY ... 13
4.1 Freeze-up ... 13
4.2 Winter Season ... 14
4.2.1 Adfreeze and Thickened ice ... 14
4.2.2 Thermal loads ... 16 4.3 Spring Break-up ... 19 5. SEMI-SHELTERED BAY ... 21 5.1 Freeze-up ... 21 5.2 Winter Season ... 21 5.3 Spring Break-up ... 21 6. NON-SHELTERED REGION ... 24 6.1 Freeze-up ... 24 6.2 Winter Season ... 25 6.3 Spring Break-up ... 26 7. RIVER ICE ... 28
8. KEY CONSIDERATIONS FOR OVERWINTERING OF VESSELS IN ICE ... 30
9. RECOMMENDATIONS ... 32
10. ACKNOWLEDGEMENTS ... 35
11. REFERENCES ... 36 APPENDIX A - WESTERN ARCTIC WINTER LAYUP OF MARINE EQUIPMENT…A-1 APPENDIX B - LETTER REGARDING OVERWINTERING OF FUEL………..B-1 APPENDIX C - THERMAL LOAD CALCULATION METHODS……….C-1
TABLE OF FIGURES
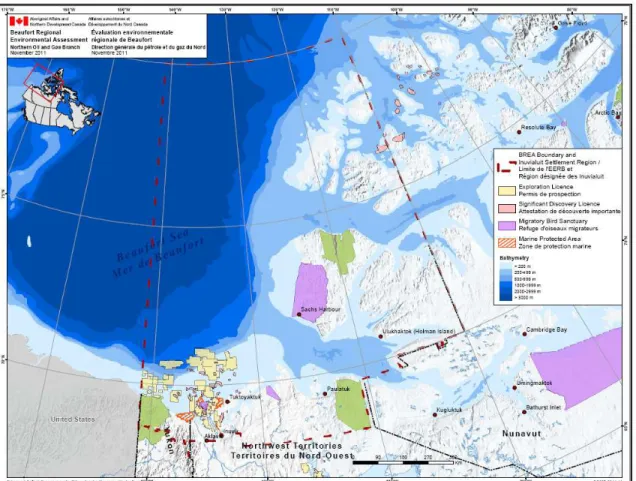
Figure 1: Map showing the BREA area of interest, courtesy of BREA website. ... 2 Figure 2: Key historical overwintering locations (from Connelly, 2012). ... 3 Figure 3: Beaudril ice breaker fleet overwintering in Herschel Basin in the 1980’s (from Connelly, 2012). ... 3 Figure 4: Esso CRI overwintering in Tuktoyaktuk Harbour, 2012. ... 4 Figure 5: CANMAR marine equipment overwintering in McKinley Bay, 1984 (from Connelly, 2012). ... 4 Figure 6: Tanker “Skauvann” overwintering fuel storage in Wise Bay in the 1980’s (from Connelly, 2012). The tanker maintained a crew onboard year-round. ... 5 Figure 7: Photograph showing the small rubble feature about 100 m from the east edge of the shoal in McKinley Bay. ... 13 Figure 8: Photograph showing the ice around the perimeter of the CRI in Tuktoyaktuk harbour. 15 Figure 9: Photograph showing the crack in the ice in the vicinity of the CRI. ... 16 Figure 10: Graph showing the skin depth versus period for a thermal wave to penetrate into an ice sheet. ... 17 Figure 11: Schematic illustration of the temperature change, strain rate and stress in an ice sheet for the example discussed in the text. ... 19 Figure 12: Two MODIS images showing McKinley Bay in late spring, showing the non-dynamic nature of the break-up of the ice. On the left, from June 25, 2008, the ice is in the process of melting in the bay, while most of the landfast ice out of the bay has already been dynamically removed from the area. On the right, from June 27, 2011, the outer bay is still protected by landfast ice while the ice in the bay is melting in place. MODIS images: Terra satellite, Bands 7-2-1 colouring. ... 20 Figure 13: MODIS satellite image showing the break-up of ice in the region around Herschel Island. Note that the ice south of the island is still landfast. Image from June 18, 2009, Terra satellite, Bands 7-2-1 colouring. ... 22 Figure 14: MODIS satellite image showing the break-up of ice in the bay around Herschel Island. This break-out of ice presents a moving ice situation which will exert ice loads on a moored vessel. Image from June 29, 2009, Terra satellite, Bands 7-2-1 colouring. ... 22 Figure 15: Graph of the mean ice thickness for different regions of the Beaufort Sea. ... 23 Figure 16: Map showing the location of the hypothetical mooring location at Nelson Head at the southern tip of Banks Island (background image from Natural Resources Canada, De Salis Bay Map 97H 1:250 000, 2nd Edition). ... 24 Figure 17: MODIS image showing the southern tip of Banks Island on November 2, 2011. Note the loose ice floes to the east of Island in the region of Nelson Head. Terra satellite, Bands 7-2-1 colouring. ... 25 Figure 18: Photograph showing an ice buckle at the SDC drilling platform at the Paktoa C-60 drill site. ... 26 Figure 19: MODIS satellite images showing the progressive break-up in the region south of Banks Island . Terra satellite, Bands 7-2-1 colouring. ... 27 Figure 20: Surface ice jam: East Channel near Inuvik, May 27, 2008; looking towards the left bank (from Beltaos et al. 2012). ... 29 Figure 21: Decision-making process flow chart for ice load considerations for an overwintering vessel. ... 32
TABLES
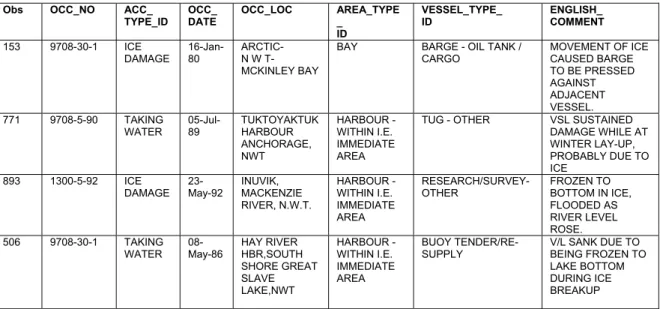
Table 1 Transportation Safety Board MARSIS database results for overwintering-related incidents. Headers correspond with the database’s labeling, for consistency. ... 6 Table 2: Summary of key ice loading considerations for each location and environmental scenario ... 30 Table 3: Comparison of illustrative scenario line loads developed in this report (values in MN/m width unless otherwise indicated). Type of loading indicated in parentheses. See the main report for details on associated ice thicknesses. ... 31
OVERWINTERING OF VESSELS IN THE BEAUFORT -
ASSESSING ICE ISSUES AND DAMAGE POTENTIAL
1. INTRODUCTION
Overwintering of vessels has been carried out in the Arctic for many years, in the Beaufort as well as in other regions of the Arctic and southern Canada. However, there is uncertainty concerning the damage potential for vessels that may be left to freeze-in within the landfast ice region of the Beaufort Sea and the Mackenzie Delta, particularly those that contain petroleum products. This is a great concern for those within the Inuvialuit Settlement Region, among others. These concerns are varied, but most focus on:
1. whether vessels that are overwintering are suitably designed for that task; 2. whether the locations chosen for overwintering are suitable;
3. if all relevant loading scenarios by ice have been considered; 4. the ramifications if a spill occurs.
There is evidence that this freeze-in could be (and has been) done safely but it is not clear how often this has been done or the conditions required to ensure safe overwintering of vessels in the Beaufort Sea. While draft guidelines from Transport Canada exist for this practice, no information exists on the likelihood of damage or its possible effects. A detailed study focused on the conditions of the Beaufort Sea would greatly aid many stakeholders on the magnitude of this problem and its possible impact.
To that end, this report by the National Research Council of Canada (NRC) studies potential ice loads that could be experienced by vessels overwintering in ice. This is done through examinations of historical documents, discussions with the Inuvialuit, consultations with Transport Canada, individuals involved with northern shipping and the oil and gas industry. The project involved a literature review, a review of ice loading analytical models, fact finding of relevant information from key stakeholders, and a small field observation project.
Four inter-related factors were examined through those methods:
1. the ice conditions at typical overwintering locations in the Beaufort Sea;
2. an examination of the ice forces on a vessel during the early winter freeze-in, late-winter thermal and spring break-up processes;
3. an assessment of the damage to overwintering vessels (if any);
4. a general discussion about Inuvialuit concerns pertaining to this subject.
Together this information paints a picture of the ice-related issues associated with the practice of overwintering and the likelihood of damage due to ice loading processes. The project outlines the potential limits to the conditions required to ensure safe overwintering of vessels in the Beaufort Sea, in order to assess whether vessels or barges overwintering in land-fast ice could experience any significant damage. It should be noted that the focus of the research is primarily the Beaufort Sea, rather than the Mackenzie River, since the Beaufort Regional Environment Assessment (BREA) area of interest (Figure 1), which is the Inuvialuit Settlement Region (ISR), is the funding source of this research. However, given the nature of regional concerns, loading conditions that are more relevant to the river are also briefly examined. The results will help to inform Inuvialuit and Regulators on the likelihood of damage and provide information on the best-available means of reducing the likelihood of damage to vessels overwintering in ice in the nearshore region of the Beaufort Sea.
2. OVERVIEW – OVERWINTERING IN ICE
2.1 Historical Overview of Overwintering in the Western Arctic
Overwintering of vessels in the Beaufort Sea and the Mackenzie Delta has occurred regularly in recent history. A wide variety of vessels have been overwintered, ranging from fuel barges to oil and gas exploration structures and their support vessels. The practice also occurs in a variety of other locations, such as large rivers, including the St. Lawrence, and lakes, such as Great Slave Lake.
As part of this project, a historical overview (Connelly, 2012) that examines the practice of oil and gas exploration-related overwintering as it pertains to four key overwintering locations (Figure 2) was prepared. A brief discussion of overwintering practices in the Mackenzie River was also included. The full document may be found in Appendix A. Example images of overwintering in the four primary regions are shown in Figure 3 through Figure 6.
Figure 2: Key historical overwintering locations (from Connelly, 2012).
Figure 3:Beaudril ice breaker fleet overwintering in Herschel Basin in the 1980’s (from Connelly, 2012).
Figure 4: Esso CRI overwintering in Tuktoyaktuk Harbour, 2012.
Figure 5: CANMAR marine equipment overwintering in McKinley Bay, 1984 (from Connelly, 2012).
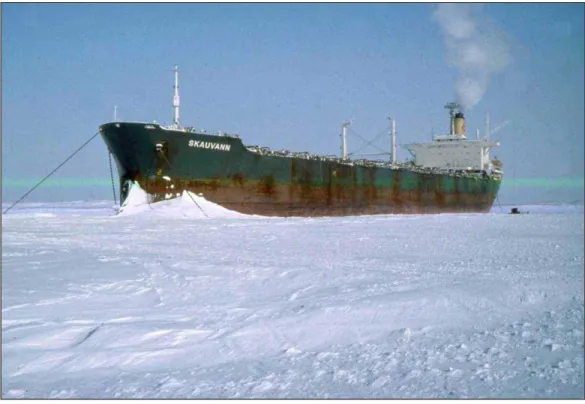
Figure 6: Tanker “Skauvann” overwintering fuel storage in Wise Bay in the 1980’s (from Connelly, 2012). The tanker maintained a crew onboard year-round.
While most overwintering occurrences in these locations were of large, offshore structures, their supporting marine equipment often overwintered as well, including icebreakers and occasionally tankers used for fuel storage. As noted in the report (Connelly, 2012), there were two incidents related to overwintering in ice - one at Thetis Bay, Herschel Island (an exploration platform moved on mooring lines) and one in McKinley Bay (structural damage to a barge). Besides those two events, no reported damage has occurred due to ice in the four primary overwintering locations. Large petroleum barges used in the four locations noted above were double-hulled and ice strengthened while storage barges were double-hulled. In the Connelly (2012) report, within the Mackenzie River, one incident from 2008 is noted, when barges came off of their moorings during the river ice break-up period, and drifted towards the sea. No spill was reported.
The Government of the Northwest Territories department of Environment and Natural Resources (ENR) maintains a Hazardous Materials Spills database, with records dating back to 1971 (http://www.enr.gov.nt.ca/_live/pages/wpPages/Hazardous_Materials_Spill_Database.aspx). A search of this database for all regions found that the second event (McKinley Bay) was one of only two spills reported that the authors could convincingly link to the practice of overwintering. The McKinley spill itself was not directly related to the structural integrity of the vessel, but rather, because there was structural damage to the barge, fuel was being transferred off of it to another vessel – the spill occurred during the transferring process. The second spill event was a puncture to a barge hull off of Iqaluit. This second event will be described in more detail in section 4.2.1.
While there were other reported spills that occurred when ice was present (approximately 14 of interest, in addition to the two mentioned above), the ice did not appear to be a contributing factor to the reported spill. However, it was difficult to ascertain in some cases whether hull cracks or
other leaks in a vessel were due to ice, or if they were already present, prior to any ice formation. Additionally, ice conditions at the time of the reported spill were not always clear in the reports. The previous database is solely related to spills (of any kind). The Transportation Safety Board MARSIS database of marine occurrences ( http://www.tsb.gc.ca/eng/incidents-occurrence/marine.asp) is a compilation of reportable marine accidents and incidents. As such, a spill need not have occurred for an incident to be reported. Results in the database are a compendium of reported occurrences dating back to 1975. This timeframe is roughly concurrent with much of the intensive oil and gas exploration work that has occurred in the Beaufort Sea. The definitions of “reportable” marine accidents and incidents, however, are such that it is possible that some events relevant to this study might not have been reported. Given that caveat, a search of the database for potentially relevant accidents and incidents indicated up to eight cases of structural damage to a vessel, possibly due to an overwintering scenario, four of those in the area of interest (Table 1). One of those incidents corresponded to the McKinley Bay event mentioned previously, while the other three were in Tukotoyaktuk Harbour, Inuvik and Hay River. Of those remaining three incidents, in two cases, damage or flooding was due to the vessel being frozen to the bottom. All four reported incidents in the Arctic happened prior to 1992. Examinations of the nature of the ice loading conditions that may contribute to incidents such as these will be carried out in later sections of this report.
Table 1 Transportation Safety Board MARSIS database results for overwintering-related incidents. Headers correspond with the database’s labeling, for consistency.
Obs OCC_NO ACC_ TYPE_ID OCC_ DATE OCC_LOC AREA_TYPE _ ID VESSEL_TYPE_ ID ENGLISH_ COMMENT 153 9708-30-1 ICE DAMAGE 16-Jan-80 ARCTIC- N W T-MCKINLEY BAY
BAY BARGE - OIL TANK / CARGO MOVEMENT OF ICE CAUSED BARGE TO BE PRESSED AGAINST ADJACENT VESSEL. 771 9708-5-90 TAKING WATER 05-Jul-89 TUKTOYAKTUK HARBOUR ANCHORAGE, NWT HARBOUR - WITHIN I.E. IMMEDIATE AREA
TUG - OTHER VSL SUSTAINED DAMAGE WHILE AT WINTER LAY-UP, PROBABLY DUE TO ICE 893 1300-5-92 ICE DAMAGE 23-May-92 INUVIK, MACKENZIE RIVER, N.W.T. HARBOUR - WITHIN I.E. IMMEDIATE AREA RESEARCH/SURVEY- OTHER FROZEN TO BOTTOM IN ICE, FLOODED AS RIVER LEVEL ROSE. 506 9708-30-1 TAKING WATER 08-May-86 HAY RIVER HBR,SOUTH SHORE GREAT SLAVE LAKE,NWT HARBOUR - WITHIN I.E. IMMEDIATE AREA BUOY TENDER/RE-SUPPLY V/L SANK DUE TO BEING FROZEN TO LAKE BOTTOM DURING ICE BREAKUP
Also within the MARSIS database, there were over fifty incidents that were related to damage due to ice while vessels were moored at a harbour. Many of these were in locations where pack ice incursions from the sea can occur. Aside from these types of locations, there were other similar events with vessels coming loose of their moorings or sustaining damage due to moving ice, all in southern Canada locations along rivers (Saugeen River, Ontario; Port of Montreal, Quebec; North Saskatchewan River, Alberta). These latter cases are relevant to similar dynamic ice conditions that could be present in the Mackenzie River.
As an example of a more recent event regarding the practice of overwintering, in March 2012, the Nunavut Impact Review Board’s (NIRB) rejected Baffinland’s proposal to overwinter fuel for its
mining project ( ftp://ftp.nirb.ca/02-REVIEWS/ACTIVE%20REVIEWS/08MN053-BAFFINLAND%20MARY%20RIVER/). As part of that review process, Environment Canada (EC) indicated that “EC does not consider the premeditated bulk fuel storage in land fast ice on/in water to be best practice. The freeze-in storage of fuel in this manner presents a higher degree of risk of accidents and could result in significant environmental effects should the integrity of the tanker be compromised by the surrounding ice. Fuel tankers are designed and licensed to transfer fuel, not necessarily to freeze-in for long-term bulk storage on/in water.” It is unclear what engineering risk assessment, if any, was the basis for EC’s comment regarding the higher risk due to freeze-in, since EC does not have expertise in either ice mechanics or vessel structural integrity. It is would appear that the comment regarding the design and licensing of fuel tankers was not made in consultation with Transport Canada. The Transport Canada review of the case did not provide comments as to the design and licensing of fuel tankers, nor increased risk. In their final review of the plan, at the end of July, 2012, Transport Canada concluded that the proposed plan had the potential to meet all regulatory requirements for overwintering, if the proponents proceed using equivalencies for stationary vessels under the Canada Shipping Act and the Arctic Shipping Pollution Prevention Regulations (ASPPR) (Transport Canada, 2012). The final review decision with respect to overwintering has not yet been released.
2.2 Draft Arctic Waters Guidelines for Lay-Up of Petroleum Barges in Landfast Ice In 2004, a draft set of guidelines was prepared for Transport Canada (Jones, 2004). The draft guidelines were provided as advice to mariners operating in the Arctic and were jointly developed by the Canadian Government and industry. However, these draft guidelines were not formally adopted as a Guideline or Standard by Transport Canada. Nevertheless, in the eight years since their creation, and in the absence of any other document available to those seeking to overwinter a vessel in ice-covered water, the draft guidelines have been used to help guide decision-making for the practice.
The draft guidelines outline general considerations (such as regulations, enforcement, emergencies, weather and ice and historical sites), types of vessels requiring Transport Canada approval for lay-up, vessel clearance and ice considerations, marine support requirements, monitoring and notification requirements.
Within the draft guidelines, there are numerous references to ice conditions, such as: • Section 3.4 Vessels: “…only laid-up/stored in suitable land-fast ice conditions.”
• Section 3.6 Weather and local ice conditions: “…vital to ensure that land fast (non- pressured) ice conditions are assured throughout the lay-up period.”
• Section 4.2 Bottom Founded Drilling Units and Floater Drilling Units: “…Herschel Basin requires marine support for such units (floater drilling units) during freeze-up and break-up.”
• Section 5.0 Sea Room, Under Keel Clearance, Ice Incursions and Other Considerations: general discussion regarding the amount of area (sea room) available, the potential need for moorings, ice monitoring, ice growth against the hull, keel clearance and potential ice movement.
Necessarily, each overwintering case will be unique. Ice conditions will not be exactly the same, year to year, in any given location, and the nature of the vessel that is overwintering will play a large role in the type of ice conditions that the vessel can withstand. Clearly an exploration drilling platform or a polar-class icebreaker has been designed to withstand very different conditions from a single-hull barge. As such, the guidelines are also necessarily general in
nature, outlining basic considerations that should be accounted for, prior to overwintering a petroleum barge in landfast ice.
2.3 Transport Canada Consultation Activities
At the outset of this project, it was understood that good discussions with Transport Canada (TC) would be required, in order to ensure that the goals of this project did not repeat efforts already underway by TC. Upon the commencement of this project, discussions were initiated with Transport Canada to determine any potential overlap of effort. A series of teleconferences and one meeting in Winnipeg were held.
The authors were informed that a TC study concerning overwintering would primarily focus on an examination of the regulatory environment surrounding the practice of overwintering, a review of the practice (specific to barges), and a series of discussions to find out more about local concerns with respect to the practice. This information would be used to generate a discussion paper on this topic, a possible best practice guide and recommendations for the next steps as they pertain to regulations. As such, this NRC study fit well with the TC study, in that this study focuses instead on the role ice may play in damaging a vessel that is overwintering.
Additionally, the TC study specifically focused on the overwintering of fuel barges, anywhere in the north, while the present NRC study examines the potential ice loads that could be applied to any vessel as well as fuel barges, and is also primarily confined to the BREA area of interest. The discussions that follow in this study do, however, have applications to other areas of interest, such as Nunavut and more southerly locations such as Great Slave Lake.
Communication with TC included updates on the status of their own research progress, background information into existing regulations and upcoming requirements for double-hulled vessels operating in shipping Zone 12 (see ASPPR 1989), highlights from their discussions in Inuvik and Hay River with locals, and historical information on the practice of overwintering. Highlights from their discussions in the north, as they pertain to ice loads, will be described in the following section.
Regarding the Baffinland project described in Section 2.1, TC plans to formalize and publish their process for obtaining equivalencies under the ASPPR, to complete their review of fuel storage by barges in the Mackenzie River and complete work to revise standards for overwintering of fuel, including finalizing best practices for overwintering (Transport Canada, 2012). At the time of writing this report, neither the TC review paper nor the finalization of best practices for overwintering, as mentioned in Section 2.1, were available.
2.4 Local Concerns
The discussions that TC held in Hay River and Inuvik and a BREA Day in Inuvik highlighted some concerns brought forward by the individuals attending the meetings that pertain to this study. Only those that are specific to ice conditions will be discussed here.
The questions and concerns brought forward at the TC meetings and the BREA day include: 1. How much overwintering has occurred in the past and how much is presently occurring? 2. Where does overwintering occur in the north?
3. There were suggestions that guidelines/standards should include a list of proper overwintering sites.
4. Is the practice of overwintering done in the south as well?
6. What is the impact of potentially more dynamic ice conditions during freeze-in and spring break-up, such as break-up of river ice?
7. Are single-hulled barges adequately strengthened for the practice of overwintering, and for potentially being in a dynamic ice environment?
8. Does the requirement of vessels in Shipping Zone 12 to be double-hulled adequately address the risks in dynamic ice conditions?
9. It is perceived that monitoring and inspection of barges throughout winter is infrequent/non-existent.
10. What are the monitoring procedures that should be followed for overwintering?
Questions 1 and 2 have been addressed in varying levels of detail, both in the Draft Guidelines (Jones, 2004) and the Connelly (2012) report described previously (see Appendix A). The frequency of overwintering occurrences, and the types of vessels that were overwintering (fuel barges or other), do not appear to be records that are kept by any particular territorial or national department, due in part to the current regulatory system for this practice.
The challenge with Question 3 is that a suitable location can potentially change depending upon the vessel that is to be overwintered. What is not suitable for a single-hulled barge may be fine for a double-hulled icebreaking tanker. Suitability is highly dependent upon the vessel type, and the conditions that the vessel was built to withstand. That being said, the draft overwintering guidelines (Jones, 2004) that were created did list locations that have been used in the past, which is something of a guideline, in that conditions at other locations that are not listed could be compared to those that have been used successfully in the past. However, just because no incident occurred at a particular overwintering location does not mean that that location is suitable for all vessels, and conditions may have changed at a site.
In general, overwintering of vessels, not specifically fuel-storage barges, does occur in many southern locations (question 4). The practice varies, from vessels moored at harbors where ice incursions may happen, to full over-wintering in landfast ice, generally in lake environments. There do not appear to be reporting requirements for overwintering of vessels, whether or not they are holding fuel, so the practice is difficult to track. Some instances of overwintering have been inferred from the databases mentioned previously. It is unlikely that there is much demand for the overwintering of fuel barges in southern locations of Canada.
Questions 5 and 6 will form the bulk of this report, and will be addressed in Sections 3 through 7. Questions 7, 8, 9 and 10 are beyond the scope of this report; however the summary sections of this document will touch on them and provide some recommendations to address these questions. Regarding the upcoming requirement that vessels operating in shipping Zone 12 be double-hulled, this is a concern of local communities that was brought forward numerous times. The southern limitation to shipping Zone 12 is the boundary of part of the exemptions to the requirement that barges operating in the zone be double-hulled by 2015 (Transport Canada, 1995, or see this part of the reference online at http://www.tc.gc.ca/eng/marinesafety/tp-tp11960-part-vii-140.htm ). Therefore, barges operating in the Mackenzie River, and most of Kugmallit Bay, are exempt.
In addition to the meeting described above, the authors also met with members of the Inuvialuit Joint Secretariat and the Inuvialuit Game Council in mid-April, 2012, in Inuvik. At this meeting, the conversation covered a number of topics. Concerns and comments brought forward, where different from previously-mentioned concerns, included:
1. Acknowledgement that recorded spills to date have been due to human error, not the structural integrity of a vessel in ice.
2. There is concern that the exclusion zones within new regulations for double-hulled vessels will allow for unsafe overwintering practices.
3. Overall, communities do not want single-hulled barges storing fuel by overwintering in ice. The concern regarding the practice is less for double-hulled vessels and structures designed for dynamic ice conditions, such as offshore drilling platforms.
4. There appear to be rules for fuel handling but not for fuel storage facilities on water. However, Transport Canada does not consider overwintering of fuel barges to be fuel handling.
5. It is believed that the lack of clarity regarding the practice of overwintering is to a certain extent due to the reluctance of the Federal government to call the practice fuel handling, as this would have implications for marinas and ports in southern Canada.
6. Given that the practice is not called fuel handling, there are different regulations for fuel storage on land and on water – there is a perceived lack of regulations and guidelines regarding the practice of storing fuel on water or in ice compared to an existing stringent set of regulations and guidelines for the practice on land.
7. It is perceived that the practice of overwintering in ice is a way around the permitting required to store fuel on land.
8. Due to the 2012 Federal budget cuts to many government departments, points of contact in the event of a spill, or for questions about the practice, seem to have either been completely cut, or existing contacts are in the limbo due to work force adjustment notifications or departmental reorganizations.
9. Federal regulatory authorities continue to appear to be “pointing fingers” at each other for responsibility, both for oversight of the practice of overwintering vessels in ice and for coordination in the event of a spill.
10. With respect to ice conditions in particular, there is concern that with changing climatological conditions, ice may become more dynamic leading to potentially greater interaction with vessels that may not be adequately designed for those conditions.
11. People would like to have reassurances that vessels are designed for the changing ice conditions that they are likely to encounter, which could be more or less risk compared to what it is presently.
12. Oversight regarding where overwintering can occur (site selection) appears to be lacking, accompanied with little consultation with local communities.
13. The location of Federal government-designated safe havens for vessels that are stranded outside of a preferred overwintering location is not clear. It is believed that the names of these locations should be publically available, so that communities can be made aware of the potential for such occurrences. It is also questioned if the selection of these safe havens took into account local ice conditions, in consultation with appropriate scientific authorities.
14. There is a concern about the break-up season, especially as it pertains to ice in the Mackenzie River and whether vessels have adequate moorings to deal with the forces involved.
15. General best practices with respect to overwintering, whether or not fuel is being stored, such as adequate and appropriate signage, warnings, reflectors, etc. are not clear.
16. Should offshore exploration activities proceed in the Beaufort Sea, there are some concerns regarding overwintering of numerous vessels (as was seen in the 1980’s and early 1990’s) and their associated site selection.
An example which summarizes some of the Inuvialuit concerns is included in Appendix B, a letter from Frank Pokiak, Chair of the Inuvialuit Game Council, sent to the Environmental Impact
Screening Committee (EISC). This letter outlines the overall concerns regarding regulatory authority, but also shows the concern regarding the ice conditions that may or may not be appropriate for overwintering of vessels and the process to determine what is safe.
3. ANALYSIS APPROACH
In order to assess the damage potential that ice may have for an overwintering vessel, four locations and four loading conditions were chosen to provide guidance as to the types of load scenarios a vessel might encounter. This analysis approach allows for an illustrative overview of typical scenarios and an overview of typical calculation methods to determine those loads. The locations chosen were a sheltered bay, a semi-sheltered bay, an exposed location, and a river environment. The sheltered bay is representative of a preferred overwintering location, while the semi-sheltered bay would be a secondary choice, or a safe haven. The exposed location was chosen to represent a case where, for example, weather closes in on a vessel and it is not possible to reach either a preferred location or a safe haven. The river environment is representative of both oil and gas and mining activities where fuel barges may overwinter in a channel of the Mackenzie River, for example.
The predominant environmental loading conditions, with respect to ice, for each site include: • early winter freeze-in
• winter adfreeze and thickened ice • late winter thermal loads
• spring break-up
These conditions, and methods of calculating expected ice loads, will be described in the following sections.
The calculations and discussion will focus on a barge rather than a more robust vessel such as a Beaufort Sea drillship. For the sake of the calculations, it will be assumed that the barge is rectangular in plan-view with a width of 15 m, an overall length of 60 m and a draft of 3 m. It will further be assumed that the bow and stern have sloping sides such that the overall length of the rectangular cross section is 50 m, with 5 m of slope in the bow and stern region. The long side of the barge is assumed to be vertical. A rigorous analysis of the environmental parameters used in the following examples was not performed. Rather, representative values for the regions of interest are used to illustrate the ice loading potential in each scenario.
4. SHELTERED BAY
A barge moored in a sheltered bay is the first scenario that will be discussed. McKinley Bay is a good example of this type of situation. Here, the ice is largely static with no dynamics or direct exposure from the Beaufort Sea.
The life cycle of the ice regime for this situation is fairly straightforward. In the autumn during
freeze-up, there would be some (thin) moving ice. During winter, the ice would be static and in
general, the ice sheet would be very level. In the spring break-up, the ice would still be largely static and melt in place. The following sections deals with each of these three seasons with respect to a frozen-in barge.
4.1 Freeze-up
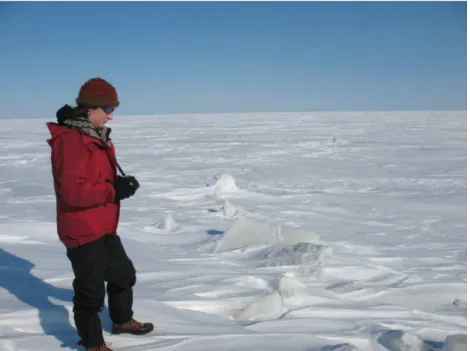
During the autumn season as the temperature drops, the ice in the bay would begin to freeze. Depending upon the wind speed, the ice could have limited or no movement. Because the bay is largely sheltered, the fetch area for developing a driving force to move the ice is limited. This means that the ice would likely freeze as level ice or with some light ridging. The authors visited McKinley Bay in April, 2012 and observed that this was indeed the case for this region. There is a small shoal in the middle of the bay that was built as a result of the dredging in the 1980s to dig a deep channel for vessel access to the bay. The authors observed a very small rubble pile on the East edge of the shoal about 100 m from the edge. Figure 7 shows a photo of this pile-up. The rest of the ice was very flat.
Figure 7: Photograph showing the small rubble feature about 100 m from the east edge of the shoal in McKinley Bay.
The ice in this pile-up was approximately 0.15 m thick, thus indicating the early season movement of the ice. A moving ice sheet interacting with a barge or vessel would exert a force on it. To estimate this force, two different approaches are used. The first approach examines the
available driving force on the ice cover. The second approach examines the force necessary to cause ice failure. The lower of the two is the force that would be exerted on the barge.
The wind driving force can be determined from
where FD is the force due to wind drag, ρ is the air density, CD is a drag coefficient, v is the wind
speed and A is the fetch area over which the wind acts. Assuming an air density of 1.5 kg/m3, drag coefficient of .003 (Macklin, 1983), wind speed of 15 m/s and fetch area of 5 km, the driving force would be 25 MN.
To estimate the force required to fail the ice against the barge, the equations developed by Timco and Johnston (2004) can be used. They showed that for ice loading on the caisson structures in the Beaufort Sea, the global force is given by:
h
w
T
L
gl=
fm
where the Lgl is the global force (in MN) on the structure, w is the width (in m) of the structure
and h is the ice thickness (in m). Tfm is a failure-mode parameter with the following values
Tfm = 1.09 MN/m2 for ice crushing
= 0.83 MN/m2 for long-term creep (i.e. thermally-induced creep) = 0.63 MN/m2 for mixed-mode failure
= 0.18 MN/m2 for bending failures.
For this thin ice, it likely would fail in bending so the estimated force on the long side of the barge would be 0.18*50*0.15 = 1.4 MN. This is lower than the driving force of 25 MN so this failure process would limit the load to this value. Thus, the line load (i.e. total load per unit width) would be 0.028 MN/m width for this 0.15 m thick ice. The ice pile that the authors observed in McKinley Bay did not show any indication that ice crushing had occurred.
4.2 Winter Season
As the winter progresses with colder temperatures, there are two considerations for barges frozen into ice in a sheltered bay. Adfreeze and thickened ice is one factor. Thermal ice loads is a second factor to consider. Each will be discussed below.
4.2.1 Adfreeze and Thickened ice
During the winter season in the Beaufort region, the level first-year sea ice grows to a thickness of typically 1.9 m (Melling et al., 2005). A steel barge frozen into this ice will have a layer of ice significantly thicker than this along its sides. Steel is an excellent thermal conductor and this heat transfer mechanism will result in thicker ice. In some cases, the ice could extend along the full depth of the barge. Since the ice would be solidly frozen onto the steel, it is termed Adfreeze ice. Note that a snow cover will not limit this added ice growth in thickness but it will limit its lateral extent. This additional thickness for a barge in a sheltered bay should not cause any issues with respect to the structural integrity of the barge. It is noted solely to illustrate that the ice will be thicker at the barge-ice interface.
Adfreeze ice can be a problem in certain situations. For example, ice adfrozen to a fixed (bottom mounted) structure in a high tidal range would exert vertical forces on the structure. For a floating
barge, this would not be the case since the barge would move with the ice (limited only by the range of the mooring lines). Adfreeze can also cause problems during an ice movement event, or in a non-sheltered location, since the ice must break the bond with the steel plates. This can cause high loads since the adfrozen ice is in perfect contact with the structure. For a sheltered bay, horizontal movement of the ice would only occur in the spring. At that time of the year, the bond between the ice and steel would be quite weak since the sun would warm the steel and this would reduce the adfreeze strength to it. Thus, the influence of adfreeze ice would be reduced and would not likely be an issue for a floating frozen-in barge in a sheltered bay.
The authors examined the Caisson-Retained Island (CRI) which was a steel caisson used by Imperial Oil in the 1980s for exploratory drilling in the Beaufort Sea. It is now located in Tuktoyaktuk harbour. The site visit showed that the upper surface of the ice was quite smooth and did not extend up the face of the structure (see Figure 8). There was some snow pile-up there as evidenced in the figure, but this had no structural strength. There was no sign of any ice-induced damage to this structure. The authors did not drill to determine the thickness of the ice surrounding this structure. Measurements of ice thickness here would not be representative of the ice thickening around a barge since the CRI has highly-sloping sides (30° from the vertical). One interesting item to note is the existence of large cracks in the vicinity of the structure. The crack shown in Figure 9 was approximately 4 cm to 8 cm wide and ran parallel to the structure. It was snow-covered and not visible to the naked eye. These types of cracks, which are likely caused by slight tidal action, do not affect the stress levels on a structure or frozen-in barge during the winter months.
Figure 8: Photograph showing the ice around the perimeter of the CRI in Tuktoyaktuk harbour.
Figure 9: Photograph showing the crack in the ice in the vicinity of the CRI.
It is also of interest to note that there have been reported incidents of ice forming along the underside of vessels in cold water environments. Typically this is caused if there are empty cargo holds that are open to the outside (cold) air. In this case, the cold air can settle to the bottom of the hold and cause ice to form on the underside of the vessel. This should not be a problem for a barge except if the ice freezes to the seabed. Because of this, there should always be adequate clearance under the barge to ensure that any possible ice formation does not contact the seabed. Unfortunately there are few reported direct measurements of typical thickness of this under-vessel ice, although the draft guidelines (Jones, 2004) do mention measurements of 0.7 to 1.2 m. Clearly, however it would be a function of the available air infiltration into the lower levels of the vessel. For barges, this likely would be quite limited. As indicated in the draft guidelines, the guidance provided indicated that the clearance should be 20-25% of the vessel draft (Jones, 2004). Aside from the forces on the barge, a vessel that is frozen to the seabed can also be subjected to flooding due to any significant change in water level.
As noted, however, if ice adfreeze occurs below the barge, this can cause problems if the ice contacts the seabed. This could result either from insufficient draft or tidal action. In that case, the barge could be unstable and it could tilt. One such example was reported in the literature, and was also reported in the GNWT Hazardous Materials Spills database, as previously mentioned. Robert Eno, the Government of Nunavut's manager of pollution control, reported in the Nunatsiaq News (2008) that in 2000 at Iqaluit: “Ice froze beneath the barge over the winter. Then, in the spring, the ice melted unevenly, causing the barge to tip to one side, allowing ice to cut through the hull.” The NWT spill report that was provided to the authors about this event does not contain further details regarding how the ice punctured the hull (GWT ENR spill report 00-193). This spill was detected early, due to regular drilling in the ice to inspect the water beneath (Nunatsiaq News, 2008).
4.2.2 Thermal loads
Changes in air temperature will result in stresses on a structure or barge frozen into the ice. During the winter months, there are continual temperature fluctuations with periods of typically
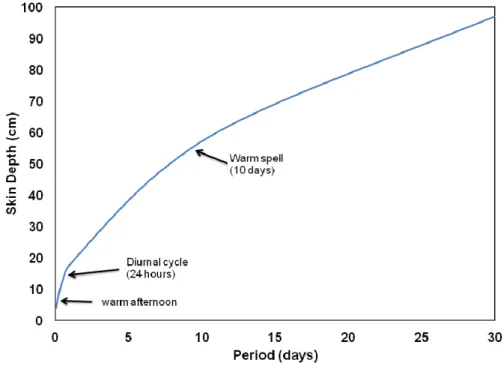
six hours (warm afternoon), to 24 hours (diurnal variation), to 10 days (warm spell). These changes in air temperature will induce changes in the ice temperature and this, in turn, will result in an expansion or contraction of the ice sheet. This resultant change will exert a force on the structure or barge. The question is: what is the magnitude of these stresses? This section will examine these thermally-induced loads.
The first aspect to consider is the rate of change of ice temperature with a change in air temperature. A change in air temperature will not produce an immediate change in ice temperature. Moreover the change in ice temperature will not be uniform with depth. Air temperature fluctuations mainly influence the top portion of the ice sheet. The bottom temperature will always remain at approximately -1.8 °C. Sanderson (1988) has discussed this aspect and has shown that the temperature changes with ice depth propagate downwards according to the Fourier theory of heat conduction. He shows that rapid fluctuations in temperature are attenuated more quickly than slower ones. Figure 10 shows a plot of the depth of penetration of thermal surface waves through an ice cover. The “skin depth” (depth at which the wave is attenuated to 1/e of it surface amplitude) is shown as a function of the wave period. The figure shows that even a long 10-day warming period only influences the upper one-half meter of the ice. Ice deeper than this is not affected by the fluctuating air temperature. This was confirmed in an experimental study by Timco and Sayed (1993).
This is a very significant fact to note. Thicker ice does not necessarily mean that higher thermal loads will be generated on the structure or barge. Also, a snow cover will help to attenuate the air temperature changes, so a thick snow cover will help to reduce thermal loads.
Figure 10: Graph showing the skin depth versus period for a thermal wave to penetrate into an ice sheet.
Over the years, there have been a large number of theories developed to predict thermal loads. These have largely been developed for estimating loads on hydroelectric dams and as such, they are applicable to more temperate climates. Timco et al. (1996) compared a large number of these
theories with direct measurements made on a number of hydroelectric dams in the Ottawa region. They found that none of the theories adequately predicted the loads. Because of this, they will not be used to predict thermal loads in this study. However, for completeness, they are outlined in Appendix C along with some representative sample calculations.
The question is – how can the thermal loads be estimated for this study? Sanderson (1984) outlines an approach that can be used based on the basic physics of the situation. It is outlined below.
The linear thermal expansion coefficient
α
L is defined as the fractional change in length per degree of temperature change. Thus it is given by1
where L is the length of ice (in this case from the shore to the structure or barge), dL/dT is the rate of change in length with temperature. For the present purpose, this can be approximated as:
1 ∆∆
where ΔL is the change in length and ΔT is the change in temperature. Thus ∆
∆
where ε is the strain in the ice. From this, the strain rate in the ice sheet can be determined as: ∆∆
where Δt is the change in time. Therefore the strain rate in the ice can be determined from knowing the change in temperature with time. As discussed above, this will not be uniform with depth.
It is possible to use this approach to estimate the thermal loads on a barge with a change in temperature. For a sample calculation, it is assumed that the change in air temperature with time is 20°C over a 4 day period (i.e. a warm spell). This temperature change would not propagate through the ice sheet as discussed above. Therefore it will be assumed that this temperature change only affects the upper 0.3 m of the ice sheet (see Figure 10). For this calculation the temperature gradient will be simplified, with a rate of 0.21°C/hr in the upper 0.15 m (i.e. the same rate as the air temperature change) and half that in the next 0.15 m. Below that, there is no temperature change so the rate is zero. Figure 11 illustrates the assumptions and values used in this calculation. The figure illustrates the representative ΔT/Δt values and the corresponding strain rate (in s-1). A value of 50 X 10-6 /°C has been used for the linear thermal expansion coefficient (Johnson and Metzner, 1990).
Figure 11: Schematic illustration of the temperature change, strain rate and stress in an ice sheet for the example discussed in the text.
It is now necessary to assume that the ice is effectively constrained between the barge and the shore line and the ice will strain at the rates calculated in Figure 11. It is then possible to use an appropriate constitutive equation to calculate the stress in each of the levels of the ice sheet. Timco and Frederking (1990) have developed constitutive relationships for sea ice which relates the stress to the strain rate. For this example, it is assumed that the ice salinity is 5 parts per thousand and the average temperature in the ice sheet is -20°C. Then, the stress in the upper 0.15 m of the ice sheet is determined to be 0.37 MPa and 0.31 MPa in the next 0.15 m (i.e. between 0.15 and 0.3 m depth). Below 0.3 m, the stress is zero. Integrating these stress values with depth yields a thermal line load of 0.10 MN/m barge width1 for this ice thickness. Note that this ice loading would arise along all sides of the barge so the ice would be “squeezing” the barge. Thus it would not displace it.
It should be noted that the loads on the bow and stern would be less than this since the sloping sides will reduce the loads. It is also of interest to note that if the shoreline in the bay has a gentle slope, the thermal expansion could take place through a movement up the slope. This also would reduce the loads.
4.3 Spring Break-up
In the spring, the ice will begin to deteriorate as the temperature rises. This will cause a reduction in the strength of the ice and a thinning of the ice sheet. In a sheltered basin, the ice will likely deteriorate in place with very little dynamics (Figure 12). During this time, a structure or barge would experience thermal loads with a magnitude similar to that discussed above. The steel plating of the barge will warm faster than the surrounding ice sheet and this will likely cause the adfreeze bond between the barge and ice to break (i.e. the barge will not be frozen to the ice sheet). For a sheltered location, there are no significant ice actions other than those discussed above.
1
This thermal load value is in agreement with field-measured values in temperate regions which range from 0.044 MN/m to 0.146 MN/m (Gatto, 1984). It is also in agreement with the ISO 19906 Arctic Offshore Structures code (ISO 19906, 2010), which indicates that values between 0.15 and 0.3 MN/m can be used for offshore structures, regardless of ice thickness.
1.
9
m
0.15 m 0.3 m ∆Τ ∆t = 0.21 C/hr ∆Τ ∆t = 0 ∆Τ ∆t = 0.10 C/hr ε=2.9 X 10 s-9 -1 ε=1.4 X 10 s-9 -1 ε=0 o o σ = 0.37 MPa σ = 0.31 MPa σ = 0Air temperature change of 20 C in 4 days
oFigure 12: Two MODIS images showing McKinley Bay in late spring, showing the non-dynamic nature of the break-up of the ice. On the left, from June 25, 2008, the ice is in the process of melting in the bay, while most of the landfast ice out of the bay has already been dynamically removed from the area. On the right, from June 27, 2011, the outer bay is still protected by landfast ice while the ice in the bay is melting in place. MODIS images: Terra satellite, Bands 7-2-1 colouring.
5. SEMI-SHELTERED BAY
Often it is not possible to moor a barge in a fully sheltered bay. There are a number of semi-sheltered bays in the Beaufort region. These bays are in landfast ice during the winter months but could be exposed to more dynamic ice conditions for part of the year. The bay in the southwest region of Herschel Island is a good example of a semi-sheltered bay. It is protected from northerly ice intrusions but is open to drift ice from the east and the south. Although this ice would not be as a severe as the northern pack ice, it still could present more dynamic conditions than a sheltered bay. The following sections deals with each of the three seasons with respect to a frozen-in barge in a semi-sheltered bay.
5.1 Freeze-up
The freeze-up would likely progress in the same manner as that for a sheltered bay except that there could be more dynamic ice, which lasts longer into the autumn months. The amount of dynamics and duration would vary for different bays. There also would be an annual variability of the freeze-up date. A semi-sheltered bay such as that used at Herschel Island is ideal since it offers protection from the prevailing northerly winds and drifting pack ice. A semi-sheltered bay which is more exposed to the drifting pack ice would not be as effective for over-wintering a barge. Thus, protection from the prevailing direction of moving ice, especially during storms, is an important consideration in site selection. Since the bay is not fully sheltered, some ice dynamics could take place in the freeze-up months.
If the barge is sheltered from the more severe ice pack ice conditions, then it would only have to contend with moving ice which formed in the bay (or in the delta region, in this case). Ice begins to form in these bays in late September and by the end of October the ice can be landfast. Typical ice thickness at that time could be on the order of 0.3 m. Similar to the freeze-up in the sheltered bay, the Timco and Johnston (2004) equations can be used to estimate the ice loads. For this ice thickness, the ice failure would likely be mixed mode but heavily predominated by ice bending failures. Estimated loads on a 50 m wide vertical side of a barge could be (0.18*50*0.3) = 2.7 MN. Thus, the line loads during the freeze-up season in a semi-sheltered bay could be on the order of 0.054 MN/m width for this 0.3 m ice thickness.
5.2 Winter Season
As the winter progresses, the same ice factors of adfreeze and thermal loads as discussed for the sheltered bay would be present. There would be no difference with respect to ice actions or ice loads. Thus estimates of the loads from thermal origin would be on the order of 0.10 MN/m barge width for a semi-sheltered bay.
5.3 Spring Break-up
In the spring, the ice will deteriorate with a reduction in strength and thinner ice. If the ice melts in place, then the loads (largely thermal loads) would be the same as that for the sheltered bay. However, in a semi-sheltered bay, there could be more dynamic ice during the break-up period. This could lead to higher loads on the barge. As an example, Figure 13 and Figure 14 show MODIS satellite images in the region around Herschel Island in 2009. The first figure shows the ice conditions on June 18. At that time, the ice was clearing around the north, west and eastern regions of the island. Note that the southern region still contains ice. An examination of MODIS images from 2007 to 2011 shows that this break-up of the ice occurred from June 19 to June 30. Figure 14 shows the ice on June 29, eleven days later. Here the ice in the bay has begun to break apart and move out of the region. Analysis of MODIS images from 2007 to 2011 indicates that
this occurred from June 25 to July 10. During that time, the ice would be dynamic and this would impose a load on a moored vessel in this region.
Figure 13: MODIS satellite image showing the break-up of ice in the region around Herschel Island. Note that the ice south of the island is still landfast. Image from June 18, 2009, Terra satellite, Bands 7-2-1 colouring.
Figure 14: MODIS satellite image showing the break-up of ice in the bay around Herschel Island. This break-out of ice presents a moving ice situation which will exert ice loads on a moored vessel. Image from June 29, 2009, Terra satellite, Bands 7-2-1 colouring.
The ice thickness must be known to estimate the loads. Figure 15 shows a plot of the mean ice thickness at different times of the year in the Beaufort Sea region. Data was obtained from Environment Canada for Sachs Harbour, Cape Perry and Tuktoyaktuk. Information on the Herschel Island region was not available. The figure shows the ice beginning to form in late September and reaching a maximum in early May. At the end of June and early July when the ice begins to move from the Herschel Island region, typical ice thickness would be on the order of 1 m thick. However, ice floes moving in a semi-sheltered bay would have limited energy. Therefore it is necessary to calculate both the limit stress and the limit energy loads. The lowest one would govern the loading situation.
For the limit stress, the Timco and Johnston (2004) equations can be used. In this case, the ice could fail either with crushing or with mixed mode. Thus, using the equations would yield loads from 32 to 55 MN for 1 m thick ice loading along the long side of the barge.
To estimate the loads for limit energy, it is possible to use the approach developed by Timco (2011) for estimating loads due to the impact of isolated ice floes. In that approach, a large number of floe impacts were analyzed for a wide range of impact situations and found that there was a good correlation between the impact force (F) and the floe kinetic energy (E) at impact with a functional form
F=A E0.532
where F is in MN and E is in GJ. The coefficient A was determined to be 61.7 for the “likely” impact force and 388 for the upper-limit impact force (i.e. when crushing occurs). For the present scenario it is assumed that the floe size diameters are on the order of 10 km wide with an ice thickness of 1 m moving at a rate of 0.2 m/s. Using the Timco (2011) approach yields a floe impact forces in the range of 0.8 MN to 5 MN depending upon the failure mode of the ice at impact. Since the limit energy load is lower than the limit stress load, it would govern the load on the barge. Note that in contrast to the limit stress approach, this impact force does not depend upon the geometric dimensions of the barge.
6. NON-SHELTERED REGION
This section deals with the situation of a barge that has not been overwintered in a protected environment. Clearly this should not be a planned event. However it is covered here as a reminder of the type of ice loads that can be experienced if the barge is not sheltered. This situation may occur, for example, if the winter freeze-up takes place before the barge could be safely towed to its planned mooring location in a bay, or if problems arise with the towing vessel preventing it from keeping on schedule. The following sections deal with each of the three seasons with respect to a frozen-in barge in a non-sheltered region.
As a hypothetical example for discussion and analysis purposes, it will be assumed that a barge that was destined for DeSalis Bay on the south east side of Banks Island was prevented from reaching this location. Instead it was trapped in early winter ice at the southern tip of Banks Island in the region of Nelson Head (see Figure 16) in Amundsen Gulf.
It should be noted that this scenario region has been chosen strictly as an example. This example exercise outlines approaches that could be used to evaluate loads in other potential regions.
Figure 16: Map showing the location of the hypothetical mooring location at Nelson Head at the southern tip of Banks Island (background image from Natural Resources Canada, De Salis Bay Map 97H 1:250 000, 2nd Edition).
6.1 Freeze-up
In a non-sheltered region, the ice can be very dynamic during the freeze-up process. The thickness of the ice when the ice becomes landfast will determine the highest loads during this time period. Forthe present example scenario, an analysis of available MODIS images shows that the ice can still be quite dynamic well into November (see Figure 17). MODIS satellite images are not available later in the calendar year due to lack of available light. Analysis of the Canadian Ice Service (CIS) Ice Charts indicated that the ice in this region is rarely landfast but in some years it can become landfast approximately in early December. Using the information in Figure 15 indicates that the level sea ice would be on the order of 0.7 m thick at that time. Then
using the equations of Timco and Johnston (2004), the estimated load would be 76 MN. Here, it is assumed that ice crushing along the barge would take place. Thus, the line load could be 1.52 MN/m during the freeze-up in a non-sheltered region. The assumption of an ice crushing failure mode is reasonable since the floes would be large and quite dynamic. Loads due to ice ridges are not considered but they would be lower than those from crushing of level ice since the consolidated layer in the ridge would not be thick at that time of year.
It should be noted that the global load of 76 MN would far exceed the mooring line capacity of any moored barge. For example, the mooring line capability of the ice-strengthened drilling platform “Kulluk” was on the order of 750 tonnes (7.5 MN) (Wright et al., 1998). Thus the barge would be moved off site due to the moving pack ice.
Figure 17: MODIS image showing the southern tip of Banks Island on November 2, 2011. Note the loose ice floes to the east of Island in the region of Nelson Head. Terra satellite, Bands 7-2-1 colouring.
6.2 Winter Season
If the barge was moored close enough to shore to be frozen into the thin strip of landfast ice, it would experience thermal loads during the winter months. The same ice factors of adfreeze and thermal loads as discussed for the sheltered bay would be present. There would be no difference with respect to ice actions or ice loads. Thus estimates of the loads from thermal origin would be on the order of 0.10 MN/m barge width for a non-sheltered region in landfast ice.
However, if the initial strip of landfast ice was subjected to ice movement periodically throughout the winter, as it often observed at this location, adfreeze break-out forces could be relevant. Adhesion strength will depend upon strain rate, brine volume, ice thickness, ice temperature and the type of surface to which is ice is adhered.
In addition, as the landfast ice edge would be relatively close to the vessel in this case, the vessel could be subjected to ice creep bucking loads. These loads would form if there was sufficient driving force acting on the ice edge to effectively push the solid landfast ice cover towards the shore (and hence the overwintering vessel). Figure 18 shows an example of this of ice failure process. This type of load event was documented, for example, at the Steel Drilling Caisson
(SDC) drilling location at Paktoa-C60 in 2006 (Sudom and Timco, 2008). In that paper, the authors describe an event where landfast ice, 1 m thick, moved up to 1.15 m overnight during a storm. A number of approaches were used estimate the associated load on the SDC, with predicted line loads ranging up to approximately 1 MN/m.
In this scenario, the Timco and Johnston (2004) equations could be used to calculate the load with a long-term creep failure mode parameter (0.83 MN/m2). For an event occurring in mid-February, with an ice thickness of 1.5 m, this equation gives a global load of 62 MN (0.83*50*1.5), or a line-load of 1.2 MN/m.
Figure 18: Photograph showing an ice buckle at the SDC drilling platform at the Paktoa C-60 drill site.
6.3 Spring Break-up
Since spring break-up dynamics are very dependent upon the location in the Beaufort Sea, it would be necessary to do a calculation based on the specific location of the moored barge. However as mentioned in the introduction to this section, this scenario should be avoided since the loads would be quite high. For the present purposes, the analysis will be done for the Nelson Head region. Figure 19 shows a series of MODIS satellite images of this region during spring of 2010. Three images are shown – April 9, May 30 and June 22. The images illustrate that the ice has begun to break-up and move in this region in early April and by the end of June, there is very little ice left in this region. Clearly the break-up is quite dynamic with large floes. Pieces of multi-year ice may also be present. For the present analysis, the Timco and Johnston (2004) equations can be used. Based on the thickness information given in Figure 15, the barge could experience ice on the order of 1.8 to 2 m thick in April and May. The ice could crush against the barge so the calculated load from first-year level ice would be approximately 220 MN. This would give a line load of 4.4 MN/m barge width. This load would be higher than the mooring line capability so the barge would likely be swept away with the moving ice. Note that more
extreme ice features (rubble fields or multi-year ice) would exert even higher loads. However they are not considered here since the loads from the first-year level sea ice would exceed the mooring line capacity.
This analysis emphatically shows that mooring in a region with little or no sheltering should be absolutely avoided.
Figure 19: MODIS satellite images showing the progressive break-up in the region south of Banks Island. Terra satellite, Bands 7-2-1 colouring.
April 9, 2010
May 30, 2010
7. RIVER ICE
Mooring of barges in the Mackenzie River will not be dealt with in detail in this report. As previously mentioned, the focus here is on the offshore region. However the lessons learned from the previous analysis are applicable to mooring of barges in the river.
Some of the salient points include:
• Mooring in a fully-sheltered bay of the river would give the lowest ice loads and maximum available protection for the barge;
• The ice loads during the freeze-up would depend upon the dynamics of the ice in the region where the barge is moored;
• All barges mooring in the river would be subjected to thermal ice loads during the winter and spring break-up period;
• The thermal loads would be restricted to the upper part of the ice sheet since the thermal waves would not propagate deep into the ice sheet. Note that the thermal loads could be higher than for the offshore region since freshwater river ice is stronger than sea ice; • The ice loads in the spring would depend on the degree of sheltering of the barge and the
dynamics of the ice in the region;
• A barge that is caught in moving ice could be subjected to very high ice loads depending upon the dynamics of the ice. Studies of the Mackenzie River breakup (see e.g. Beltaos et al, 2012) clearly demonstrate the variability of the break-up in different parts of the river, and the potential for quite dynamic ice conditions. Figure 20 shows an example of the river ice near Inuvik in late May, 2008 (from Beltaos et al., 2012).
• Break-up of river ice in many rivers also involves significantly higher water levels compared to winter flow levels. If a vessel were to break free of its mooring lines due to the change in water levels or due to ice forces on the lines, the vessel would be transported by the ice downstream. If this happened, the vessel could ground, be subjected to pressured ice conditions should an ice jam occur, and have ice pile-up onto it.
Figure 20: Surface ice jam: East Channel near Inuvik, May 27, 2008; looking towards the left bank (from Beltaos et al. 2012).