Publisher’s version / Version de l'éditeur:
Journal of the American Geriatrics Society, 58, 4, pp. 681-687, 2010-04-01
READ THESE TERMS AND CONDITIONS CAREFULLY BEFORE USING THIS WEBSITE.
https://nrc-publications.canada.ca/eng/copyright
Vous avez des questions? Nous pouvons vous aider. Pour communiquer directement avec un auteur, consultez la première page de la revue dans laquelle son article a été publié afin de trouver ses coordonnées. Si vous n’arrivez pas à les repérer, communiquez avec nous à PublicationsArchive-ArchivesPublications@nrc-cnrc.gc.ca.
Questions? Contact the NRC Publications Archive team at
PublicationsArchive-ArchivesPublications@nrc-cnrc.gc.ca. If you wish to email the authors directly, please see the first page of the publication for their contact information.
NRC Publications Archive
Archives des publications du CNRC
This publication could be one of several versions: author’s original, accepted manuscript or the publisher’s version. / La version de cette publication peut être l’une des suivantes : la version prépublication de l’auteur, la version acceptée du manuscrit ou la version de l’éditeur.
For the publisher’s version, please access the DOI link below./ Pour consulter la version de l’éditeur, utilisez le lien DOI ci-dessous.
https://doi.org/10.1111/j.1532-5415.2010.02764.x
Access and use of this website and the material on it are subject to the Terms and Conditions set forth at
Prevalence and 10-year outcomes of frailty in older adults in relation to deficit accumulation
Song, Xiaowei; Mitnitski, Arnold; Rockwood, Kenneth
https://publications-cnrc.canada.ca/fra/droits
L’accès à ce site Web et l’utilisation de son contenu sont assujettis aux conditions présentées dans le site
LISEZ CES CONDITIONS ATTENTIVEMENT AVANT D’UTILISER CE SITE WEB.
NRC Publications Record / Notice d'Archives des publications de CNRC:
https://nrc-publications.canada.ca/eng/view/object/?id=7aa18917-a308-4be6-ae6a-183b5a3ddbd3 https://publications-cnrc.canada.ca/fra/voir/objet/?id=7aa18917-a308-4be6-ae6a-183b5a3ddbd3
Prevalence and 10-Year Outcomes of Frailty in Older Adults in Relation to
Deficit Accumulation
Song, Xiaowei; Mitnitski, Arnold; Rockwood, Kenneth
Keywords:frailty; Frailty Index; mortality; prevalence; survival
Abstract
OBJECTIVES: To evaluate the prevalence and 10-year outcomes of frailty in older adults in relation to deficit accumulation.
DESIGN: Prospective cohort study.
SETTING: The National Population Health Survey of Canada, with frailty estimated at baseline (1994/95) and mortality follow-up to 2004/05.
PARTICIPANTS: Community-dwelling older adults (N=2,740, 60.8% women) aged 65 to 102 from 10 Canadian provinces. During the 10-year follow-up, 1,208 died.
MEASUREMENTS: Self-reported health information was used to construct a frailty index (Frailty Index) as a proportion of deficits accumulated in individuals. The main outcome measure was mortality.
RESULTS: The prevalence of frailty increased with age in men and women (correlation
coefficient=0.955–0.994, P<.001). The Frailty Index estimated that 622 (22.7%, 95% confidence interval (CI)=21.0–24.4%) of the sample was frail. Frailty was more common in women (25.3%, 95% CI=23.2–27.5%) than in men (18.6%, 95% CI=15.9–21.3%). For those aged 85 and older, the Frailty Index identified 39.1% (95% CI=31.3–46.9%) of men as frail, compared with 45.1% (95% CI=39.7–50.5%) of women. Frailty significantly increased the risk of death, with an age- and sex-adjusted hazard ratio for the Frailty Index of 1.57 (95% CI=1.41–1.74).
CONCLUSION: The prevalence of frailty increases with age and at any age lessens survival. The Frailty Index approach readily identifies frail people at risk of death, presumably because of its use of multiple health deficits in multidimensional domains.
Frailty is a multifactorial syndrome that represents a reduction in physiological reserve and in the ability to resist environmental stressors.1 It is generally recognized to be age associated, common in older adults, and related to adverse health outcomes.2–5 Theoretical accounts of frailty
emphasize its complex and dynamic nature, and mathematical models have been employed to better describe this essence.6–10 Such models make clear that frailty is an expression of the lack of adaptive capacity of the organism.
Lack of adaptive capacity can arise in many contexts, including any severe injury (e.g., a large burn) or widespread, systemic illness (e.g., long-standing diabetes mellitus or atherosclerosis, untreated or unresponsive immunosuppression), but what intrigues gerontological researchers is the vulnerability that arises with age, even sometimes— although not often—in the absence of much frank illness.11
How to operationalize this vulnerability or decreased adaptive capacity remains disputed,4,12–14 but various frailty definitions share the essential insight that the systemwide nature of frailty can be manifested through a number of items. They differ chiefly on how many (and to some extent which) items should be included. This in turn reflects different pragmatic approaches to the task at hand, which is to make the complexity of frailty tractable. As reported elsewhere, the current study used the Frailty Index to operationalize frailty. This approach is based on deficit
accumulation and relies less on the informative nature of any particular deficit, instead
evaluating the cumulative effects of multiple deficits with age, with little restriction as to which deficits are counted.15
Given that frailty is said to arise from the loss of ―physiological reserve,‖ which itself diminishes with age, it is not surprising that estimates of the prevalence of frailty increase robustly with age. Even so, in community-dwelling cohorts of older adults, recent reports of the prevalence of frailty, solely according to the phenotypic definition, as derived from the Cardiovascular Health Survey (CHS) and relying on five important items,4 have ranged from 3.8% to 16.3%, depending on the population studied and their sex composition and ethnicity.16–20 The prevalence of frailty using a frailty index approach has been less well studied, although age-associated distributions of deficit accumulation have been multiply replicated.21–28 Here, the objectives were to estimate the prevalence and 10-year outcomes of frailty using a deficit accumulation approach in a
representative survey of community-dwelling older adults in Canada. The frailty prevalence estimations that used other definitions of frailty will also be discussed, to follow the increasing call for comparative studies2,12,29,30 when conducting frailty research.
METHODS
Subjects and Setting
Data were used from the National Population and Health Survey (NPHS), which Statistics Canada initiated in 1994/95. The NPHS is designed to collect in-depth longitudinal information on the health of Canadians. It employs multistage stratification according to geographic and socioeconomic characteristics and clustering according to Census Enumeration Areas.31 Self-reported information concerning health status, use of health services, determinants of health, chronic conditions, and activity restrictions was gathered at baseline and every 2 years thereafter, and death records were collected.32,33 Of 2,740 NPHS participants aged 65 to 102 at baseline, 1,073 were men and 1,667 were women. Their mean age ± standard deviation at baseline was 74.0 ± 6.6 (Table 1). After 10 years (2004/05), 1,208 (44.1%) people had died, and 279 (10.1%) were lost to follow-up. Those who died tended, at baseline to have been older, more often female, and not married and to have been in the hospital just before the first interview (Table 1). Proportionately more women were lost to follow-up, and fewer were secondary school graduates, but otherwise, those lost to follow-up were more similar to survivors than to decedents (Table 1).
Table 1. Baseline Characteristics of the Study Sample Characteristic Overall (n=2,740) Survived (n=1,253) Deceased (n=1,208) No Response (n=279) Analysis of Variance Chi-Square P- Value
1. Comparisons were between those who survived, those who died, and those who did not respond.
Age, mean ± standard
deviation 74.0 ± 6.6 71.4 ± 4.9 77.0 ± 7.1 71.4 ± 5.2 230.1 <.001 Female, % 60.8 63.5 54.7 66.7 36.6 <.001 Secondary school graduate, % 42.9 49.7 37.5 40.1 31.9 <.001 Married or with common-law spouse, % 46.2 51.9 41.8 48.1 16.4 <.001 Used hospital in previous 2 weeks, % 6.2 3.5 8.7 3.7 20.0 <.001 Definitions
Thirty-six variables assessing health status at baseline, including medical conditions, health attitudes, symptoms, and functional impairments, were used in the analysis (Table 2). As stated elsewhere,15 with the deficit accumulation approach, the Frailty Index does not necessarily include exactly the same deficit variables or the same number of variables. In the previously published studies, 30 to 70 variables of various data sets have been applied.15,21,34 To be included in the Frailty Index, each variable satisfies three basic criteria: is biologically sensible,
accumulates with age, and does not saturate too early (develop too high a prevalence at younger ages, e.g., presbyopia, which is almost universal at age 55).15,35 Data were coded so that a 1 represented the presence of a problem and 0 represented the absence of the problem. Multilevel variables were dichotomized according to the problem's severity (e.g., for impairment in
activities of daily living, the value of a variable would be 1 if a person needed help all the time, most times, or sometimes and 0 if a person seldom or never needed such help). Of the 36 variables, 21 (60%) had no missing cases, and the maximum number of missing cases of the remaining 15 variables was 5%. Of all subjects, 2,220 (81%) had no missing values in any variables, 270 (10%) had one or two values missing, and none had more than eight values missing. Missing values for each variable were imputed, using the nonmissing mean of the variable. The percentage present of each variable was examined for sensitivity (chi-square test), and no significant difference was found before and after imputation (P>.05).
Table 2. Occurrence of the Individual Deficits and Their Odds Ratios for 10-Year Death
Variable Description
%, Odds Ratio (95% Confidence Interval) P-Value Men (1,073) Women (1,667)
Has long-term disability or handicaps 32.1, 2.37 (1.86–3.01) <.001 30.6, 1.34 (1.12–1.61).002 Restriction of activities 40.4, 2.29 (1.85–2.83) <.001 41.5, 1.21 (1.03–1.41).02 Needs help for preparing meals 6.3, 8.57 (3.92–18.75) <.001 7.8, 4.22 (2.70–6.58) <.001 Needs help for shopping for necessities 9.1, 5.79 (3.28–10.20) <.001 16.7, 3.16 (2.38–4.20) <.001 Needs help for house work 10.3, 6.79 (3.87–11.89) <.00117.3, 1.93 (1.51–2.49) <.001 Needs help for heavy household chores 21.9, 4.11 (2.96–5.72) <.001 35.7, 1.63 (1.37–1.94) <.001 Needs help for personal care 4.6, 15.00 (4.66–48.27) <.0015.2, 4.61 (2.64–8.06) <.001 Needs help moving about inside house 2.5, 11.50 (2.71–48.78) .001 2.6, 6.18 (2.61–14.66) <.001 Has arthritis or rheumatism 35.5, 1.55 (1.25–1.92) .01 48.8, 0.95 (0.79–1.06) .23 Has high blood pressure 23.7, 1.48 (1.14–1.92) .003 33.6, 0.88 (0.74–1.05) .15 Has chronic bronchitis or emphysema 8.3, 2.25 (1.76–4.64) <.001 6.1, 1.25 (0.82–1.89) .30 Has diabetes mellitus 11.7, 1.79 (1.24–2.59) .07 9.5, 1.92 (1.37–2.69) .001 Has heart disease 18.7, 2.38 (1.75–3.24) <.001 16.5, 1.46 (1.13–1.89) .004 Has cancer 5.1, 3.07 (1.64–5.73) <.001 5.4, 1.50 (1.07–2.10) .007 Has stomach or intestinal ulcers 5.6, 1.90 (1.10–3.26) .02 5.2, 1.19 (0.77–1.84) .44 Suffers from the effect of stroke 3.9, 5.65 (2.37–13.43) <.001 3.5, 1.54 (0.90–2.64) .11 Suffers from urinary incontinence 3.1, 2.49 (1.10–5.65) .29 4.5, 1.53 (0.95–2.47) .08 Has migraine headache 2.9, 1.89 (0.88–4.07) .10 5.1, 0.95 (0.60–1.49) .81 Has cataracts 9.6, 2.09 (1.37–3.18) .001 18.3, 1.23 (0.97–1.56) .09
Table 2. Occurrence of the Individual Deficits and Their Odds Ratios for 10-Year Death
Variable Description
%, Odds Ratio (95% Confidence Interval) P-Value Men (1,073) Women (1,667)
Has glaucoma 3.4, 1.40 (0.72–2.71) .32 5.2, 1.39 (0.89–2.18) .15 Has other medical conditions 8.2, 1.42 (0.91–2.22) .12 8.5, 0.94 (0.66–1.33) .72 Have no regular physical exercise 48.8, 1.77 (1.46–2.14) <.001 55.7, 1.13 (0.98–1.30) .08 Has vision problem 5.6, 1.87 (1.08–3.23) .03 9.4, 2.01 (1.42–2.85) <.001 Has hearing problem 8.3, 2.75 (1.70–4.46) <.001 7.0, 1.43 (0.97–2.11) .07 Feeling hopeless 3.8, 2.19 (1.06–4.56) .04 6.2, 1.65 (1.08–2.54) .02 Has dexterity problem 2.9, 5.52 (1.86–16.35) .02 2.8, 2.01 (1.07–4.00) .03 Has emotional problem 4.3, 2.05 (1.08–3.91) .03 4.0, 1.56 (0.89–2.56) .12 Has memory problem 34.2, 1.80 (1.44–2.24) <.001 33.8, 0.85 (0.71–1.01) .06 Has bodily pain 26.4, 1.78 (1.38–2.31) .01 29.5, 1.04 (0.87–1.26) .66 Has speech problem 2.1, 3.29 (1.20–9.04) .02 1.5, 0.71 (0.32–1.60) .41 Taking 5 or more medications 10.6, 4.61 (2.74–7.76) <.001 13.0, 1.53 (1.13–1.53) .006 Has difficulty carrying or lifting light loads30.3, 2.41 (1.89–3.07) <.001 31.7, 1.52 (1.26–1.82) <.001 Mobility problem 13.0, 4.98 (3.16–7.84) <.001 17.1, 2.34 (1.80–3.05) <.001 Has limited kind or amount of activity 30.2, 2.58 (2.01–3.30) <.001 33.7, 1.27 (1.07–1.51) .007 Feels tired all the time 8.4, 1.63 (1.09–3.31) .03 7.4, 1.58 (1.23–2.80) <.001 Weight loss 4.3, 2.15 (0.59–3.80) .48 3.9, 1.42 (1.15–2.46) <.001
For any individual, the Frailty Index was calculated as the number of items in which people reported a deficit (value=1) divided by the number of items considered (36).8 For example, consider an individual who (deficits are italicized) reported a history of hypertension, heart disease, diabetes mellitus, and glaucoma severe enough to cause vision problems so that help
was needed with heavy housework. That person would have six deficits—the four diagnoses, the one sensory impairment, and the one disability. The individual's Frailty Index score would therefore be the sum of the six health deficits divided by 36 (0.17). Although each item has the same weight, severity is reflected by the number of items in the deficit count; in this example, had the glaucoma been well enough controlled that it did not cause vision problems, and had the visual impairment not contributed to the need for help with heavy housework, then the score would be simply the four diagnoses (hypertension, heart disease, diabetes mellitus, glaucoma) divided by 36 (0.11). Several earlier studies found the Frailty Index to correspond closely to the risk of death, institutionalization, and other adverse health outcomes.8,36
For evaluation of the level of frailty, three groups were devised from the continuously distributed Frailty Index using two cut points. People with three or fewer (of 36) deficits were considered to be nonfrail (Frailty Index ≤0.08), whereas those with nine or more deficits (Frailty Index ≥0.25) were considered to be frail. People with four to eight deficits therefore correspond to the
intermediate (prefrail) group. These cut points accord with prior reports.24,37
Prevalence Estimates and Outcome Measures
Summary and age-specific prevalence estimates for baseline fitness and frailty were calculated and 95% confidence intervals (CI) constructed for men and women together and separately. Data were weighted by applying the longitudinal response master variables from the NPHS survey.33 The main outcome measure was survival from baseline (1994/9 to 2004/05). The date of death was recorded according to death certificate. Survival information was obtained from linked mortality records, with a high rate of vital status follow-up. Risk and survival analyses relating baseline deficit accumulation to mortality were conducted. In accordance with confidentiality requirements by Statistic Canada, data points with a sample size of five or less were not reported.
Analysis
Logistic regression was used to estimate the likelihood of 10-year mortality for each of the deficits individually. The age-specific distribution of frailty was estimated as the mean and standard deviation of frailty measured by each operational definition by 5-year aggregated intervals from age 65. The prevalence of frailty at baseline was calculated for each classification of the Frailty Index (nonfrail, prefrail, frail). Comparisons at baseline between categorical variables were evaluated using chi-square and between interval variables using analysis of variance. The values of the Frailty Index were correlated using Spearman correlations. Survival was evaluated using Kaplan-Meier curves (censoring for nonresponders throughout the follow-up cycles), with bivariate comparisons using the log-rank test. Multivariable analyses were conducted to assess the contribution of Frailty Index in predicting 10-year death using Cox regression adjusted for age, sex, and status of frailty, defined according to frailty categories (nonfrail, prefrail, frail). Receiver operating characteristic curves were produced using the Frailty Index in the prediction of individual death during various periods of follow-up (2, 4, 6, 8, 10 years), and the areas under the curve (AUC) were accordingly calculated. The 95% CIs were estimated by bootstrapping using resampling with 95% of cases repeated 1,000 times. The statistical significance level was set as P=.05.
Ethics
The Statistics Canada ethics review process approved the NPHS, and participants provided oral informed consent. Approval for these additional analyses came from the Research Ethics Committee of the Capital District Health Authority, Halifax, Nova Scotia, Canada. RESULTS
Considering the 36 deficits individually, almost all of them increased the risk of death in men and women in univariate analyses (Table 2). A notable exception was weight loss in men.
Otherwise, most deficits, when considered individually, were more lethal in men than in women. Even so, for each item, more women reported deficits.
Considering deficits cumulatively, the mean value of the Frailty Index increased with age (Figure 1A). As the mean value of the Frailty Index increased, so did the mortality rate (Figure 1B). The correlation coefficient (r) between age and the mean Frailty Index value was high for both men (r=0.989, P<.001) and women (r=0.992, P<.001). Older men usually had a lower Frailty Index at a given age than older women, in contrast to a higher death rate.
Figure 1. The age-specific distribution of the Frailty Index (A) grouped according to 5-year intervals from age 65 and the 10-year death rate as a function of the Frailty Index (B). Circles represent women, and squares represent men, with 95% confidence intervals (CIs) shown in thin lines.
Using a Frailty Index cut point of 0.25, 622 (22.7%) people were classified as frail, with a weighted frailty prevalence estimate of 22.7% (95% CI=21.0–24.4%). Frailty prevalence was higher in women (25.3%, 95% CI=23.2–27.5%) than in men (18.6%, 95% CI=15.9–21.3%). The mean values of the Frailty Index for the three frailty category were 0.046 ± 0.003 for nonfrail, 0.156 ± 0.004 for prefrail, and 0.310 ± 0.008 for frail. The mean Frailty Index was significantly higher (P<.001) in people who died (0.195 ± 0.135) than in those who survived (0.119 ± 0.102) or those who left the study (0.113 ± 0.103) within the follow-up period. The prevalence of frailty increased to 43.3% (95% CI=37.8–48.1%) by age 85: 39.1% (95% CI=31.3–46.9%) for men and 45.1% (95% CI=39.7–50.5%) for women. By age 95, virtually everyone in the sample had accumulated more than 25% of various health deficits being considered. The following items showed the highest prevalence by age 95; nobody had regular exercise; everybody had difficulties carrying or lifting a light load; 83% had problems with mobility; and 75% had restrictions of activity, needed help shopping, or had arthritis or rheumatism.
A dose response was evident with the Frailty Index for the survival probability for the 10-year follow-up (Figure 2). Using the three-category Frailty Index, the 10-year survival probability for the frailest group was 27%, versus 70% for the fittest group. A seven-level Frailty Index at
cut-points of 0.03, 0.08, 0.14, 0.20, 0.25, and 0.34 resulted in a more-precise dose-response decrease of survival with the Frailty Index from 0.75 to 0.23, suggesting that the Frailty Index can predict mortality well. Mean survival for those who died in the three categories was 75.6 ± 31.5 months (median 75), 65.0 ± 33.9 (median 64), 51.5 ± 35.0 (median 50), respectively, based on Frailty Index cut points.
Figure 2. The Kaplan-Meier cumulative survival probability for people with three levels of the Frailty Index. The Frailty Index had been graded to be equivalent to the phenotypic definition: nonfrail (<0.08, dashed line), prefrail (0.08–0.24, dot-dashed line), and frail (≥0.25, solid line). A dose-response relationship was observed.
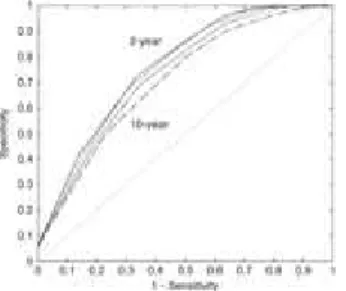
In a Cox regression model adjusted for age and sex, the three-level Frailty Index (nonfrail, prefrail, frail) predicted the risk of death (risk ratio (RR)=1.57, 95% CI=1.41–1.74). This was better than the performance of the chronological age (RR=1.08, 95% CI=1.06–1.20). At the individual level, the Frailty Index predicted 10-year death with an AUC of 72 (± 2%) (Figure 3). The predictive accuracy increased gradually for shorter-term death, with an AUC of 78 (± 2%) for 2-year death (Figure 3).
Figure 3. The receiver operating characteristic (ROC) curves for the Frailty Index in the prediction of individual death within various periods of followup (2, 4, 6, 8, and 10 years). The values show the areas under the ROC curve (AUC). The solid and thicker dashed lines show the ROC curves for individual death prediction of 2 years (AUC=0.78) and 10 years (AUC=0.72), respectively; thinner dashed lines represent ROC curves for 8 (AUC=0.73), 6 (AUC=0.75), and 4 (AUC=0.76) years. The diagonal indicates AUC=0.5.
DISCUSSION
The prevalence of frailty was estimated, and its relationship with 10-year survival outcomes in community-dwelling older adults was evaluated. From the NPHS, a Frailty Index was calculated based on self-reported health deficit accumulation. It was found that frailty was more common with age and that, by age 95, virtually everyone in the sample was frail because of accumulation
of a large number of health deficits. On average, women had more deficits than men, but at any given level of deficit accumulation—including ones that would define them as frail—women tolerated deficits better, as evidenced by a lower mortality rate. The prevalence of frailty increased with age and with age made death more likely.
These data must be interpreted with caution. The Frailty Index was calculated based on self-reported data. Although this offers an avenue for studying community-dwelling older adults in large-scale epidemiological surveys, caution needs to be taken because of self-estimates of health that might be less accurate than systematic clinical assessment. In addition, the Frailty Index approach is less widely used than the CHS phenotypic definition.4 The Frailty Index classified substantially more people as frail (22.7%, 95% CI=21.0–24.4%) than have other reports that used the CHS definition (range 3.8–16.3%).16–20 Although self-report data do not allow a direct comparison, the phenotypic definition of frailty4 can be roughly approximated based on the last five items in Table 2. In the current study's sample, the Frailty Index prevalence estimate was 2.6 times as high as the prevalence estimate derived using the five items to approximate the CHS phenotype definition;4 the latter yielded an estimate of 8.7% (95% CI=6.9–10.5%). Similarly, when CHS data were reanalyzed using a ―deficit index‖ (otherwise indistinguishable from the Frailty Index used here), that index identified 2.6 times as many people as frail as did the phenotypic definition using the original phenotypic definition and data set.28 In short, both the current analyses and those of the previous study28 suggest that the higher prevalence estimate reported here is a result of operationalizing frailty through deficit accumulation and not due to having studied a frailer sample.
Given that the different approaches to frailty appear to yield somewhat different estimations, what should readers conclude? The CHS phenotype, extended in the Women's Health and Aging Studies and many other settings,4,14 shares with the frailty index approach (first used in the Canadian Study of Health and Aging and later in data sets from many countries5,8,15) the essential insight that the systemwide nature of frailty can be manifested through a few items. The
approaches differ chiefly on how many (and to some extent which) items should be included. This in turn reflects different approaches to the task of making the complexity of frailty tractable. The phenotype approach relies on five items: weight loss, weakness, decreased physical activity, exhaustion, and slow gait speed.4 The frailty index approach relies less on the informative nature of any particular deficit, instead evaluating the cumulative effects of multiple deficits, with little restriction as to what deficits are counted.15
Is it valid to use so many items? Although a mortality prediction model is not being proposed, using death as an outcome allows the predictive validity of the Frailty Index (as a measure of vulnerability) to be tested using a relevant, dichotomous, nonarbitrary, and unequivocal adverse outcome. A large survival difference was seen in the current study between the fittest, 75% of whom survived to 10 years, and the frailest, of whom only 23% lived 10 years. In two studies that directly compared mortality using the phenotypic definition and deficit accumulation, the latter more accurately classified mortality risk.24,28 In addition, unlike many other risk indices (e.g., Vulnerable Elders Survey-13),38 the Frailty Index does not contain age as a predictor (or a part of the index), recognizing that, even at the same age, the health of individuals will vary.
Does it make clinical sense to use so many items? The Frailty Index also shares with the phenotypic approach3,4 (and an even shorter three-item index20) the ability to summarize health status. It has been proposed that the Frailty Index can be understood as a ―clinical state variable,‖ meaning that it quantifies the underlying health status of the person.39 It has been proposed that, in addition to frailty, other clinical state variables might be attention and concentration, mobility and balance, function and social interaction. To the extent that each of the five items in the phenotypic definition, or that of the even more-parsimonious approach,20 possesses the
properties of a state variable (quantifiable, graded, integrates information across many systems, related to adverse outcomes), a frailty measure based on a few items might well capture the same graded account of risk as does the Frailty Index, although this needs to be demonstrated. In other words, it is when the number of items considered is fewer that the natures of the items in a frailty definition become more important.
Although in some clinical settings it is difficult to use an index of many items, this would not be the case in geriatric medicine. Geriatricians can use a Frailty Index composed of the items used in a standard Comprehensive Geriatric Assessment.40–42 The Frailty Index based on self-report data presented here has been shown to be highly comparable with that of the clinical assessment– based Frailty Index.8 For instance, according to either approach, people who were frailer were more likely to be older, female, and likely to die.8 This suggests that the Frailty Index is a robust measure and that its properties are generally insensitive to how it is constructed.
Although a few items of the Frailty Index saturated at the oldest ages, as a whole, it does not show a ceiling effect. Rather, there is a consistent, submaximal upper limit (∼0.7) to the percentage of deficits that any person can accumulate; after that limit, death becomes
inevitable.35,43 Here, by age 95, virtually everyone in the sample had a Frailty Index value of 0.25, suggesting that few people who are very old are fit in any sense that does not adjust for age, although within this group, there were grades of frailty, which still corresponded to variable mortality risk (and in this sense, at least, to varying levels of vulnerability). In addition, people can improve their health status (lessen their Frailty Index) at any Frailty Index value.44 The extent to which improvement is possible, and how that relates to age, are interesting questions that are motivating additional inquiries.
ACKNOWLEDGMENTS
Conflict of Interest: The editor in chief has reviewed the conflict of interest checklist provided by the authors and has determined that the authors have no financial or any other kind of
personal conflicts with this paper.
The project was supported by an operating research grants from the Canadian Institute for Health Research (#MOP64169).
Author Contributions: Xiaowei Song conducted the analyses and co-wrote the first draft. Arnold Mitnitski reviewed the analyses and obtained funding. Kenneth Rockwood conceived of the project, co-wrote the first draft, and obtained data access from Statistics Canada. All authors wrote and approved the final version of the manuscript.
Sponsor's Role: The project was supported by an operating research grant from the Canadian Institute for Health Research (MOP64169). KR receives career support from the Dalhousie Medical Research Foundation as the Kathryn Allen Weldon Professor of Alzheimer Research. Statistic Canada collected and maintained the NPHS data. Data are accessed through an
agreement with the Statistics Canada Atlantic Regional Data Centre, which obliges us to operate, for these purposes only, as ―deemed employees‖ of Statistics Canada. We thank the officials of Statistics Canada for careful review the analysis outputs to ensure that confidentiality had not been breached and that the data were weighted properly to produce uniform estimates across reports. In no other way did any sponsor have influence over the data analyses and presentation. REFERENCES
1. Bergman H, Ferrucci L, Guralnik J et al. Frailty: An emerging research and clinical paradigm—issues and controversies. J Gerontol A Biol Sci Med Sci 2007;62A:731–737. 2.Abellan Van Kan G, Rolland Y, Bergman H et al. The I.A.N.A Task Force on frailty
assessment of older people in clinical practice. J Nutr Health Aging 2008;12:29–37.
3Walston J, Hadley EC, Ferrucci L et al. Research agenda for frailty in older adults: Toward a better understanding of physiology and etiology: Summary from the American Geriatrics Society/National Institute on Aging Research Conference on Frailty in Older Adults. J Am Geriatr Soc 2006;54:991–1001.
4Fried LP, Tangen CM, Walston J et al. Frailty in older adults: Evidence for a phenotype. J Gerontol A Biol Sci Med Sci 2001;56A:M146–M156.
5.Mitnitski AB, Mogilner AJ, Rockwood K. Accumulation of deficits as a proxy measure of aging. Sci World J 2001;1:323–336.
6.Yashin AI, Manton KG, Woodbury MA et al. The effects of health histories on stochastic process models of aging and mortality. J Math Biol 1995;34:1–16.
7.Gavrilov LA, Gavrilova NS. The reliability theory of aging and longevity. J Theor Biol 2001;213:527–545.
8.Rockwood K, Mitnitski A. Frailty in relation to the accumulation of deficits. J Gerontol A Biol Sci Med Sci 2007;62A:722–727.
9.Varadhan R, Seplaki CL, Xue QL et al. Stimulus-response paradigm for characterizing the loss of resilience in homeostatic regulation associated with frailty. Mech Ageing Dev
2008;129:666–670.
10.Chaves PH, Varadhan R, Lipsitz LA et al. Physiological complexity underlying heart rate dynamics and frailty status in community-dwelling older women. J Am Geriatr Soc
11.Fried LP, Ferrucci L, Darer J et al. Untangling the concepts of disability, frailty, and comorbidity: Implications for improved targeting and care. J Gerontol A Biol Sci Med Sci 2004;59A:255–263.
12.Fillit H, Butler RN. The frailty identity crisis. J Am Geriatr Soc 2009;57:348–352. 13.Fisher A. Just what defines frailty? J Am Geriatr Soc 2005;53:2229–2230.
14.Bandeen-Roche K, Xue QL, Ferrucci L et al. Phenotype of frailty: Characterization in the women's health and aging studies. J Gerontol A Biol Sci Med Sci 2006;61A:262–266.
15.Mitnitski A, Song X, Skoog I et al. Relative fitness and frailty of elderly men and women in developed countries and their relationship with mortality. J Am Geriatr Soc 2005;53:2184– 2189.
16.Woods NF, LaCroix AZ, Gray SL et al. Frailty: Emergence and consequences in women aged 65 and older in the Women's Health Initiative Observational Study. J Am Geriatr Soc 2005;53:1321–1330.
17.Cawthon PM, Marshall LM, Michael Y et al. Fractures in Men Research Group. Frailty in older men: Prevalence, progression, and relationship with mortality. J Am Geriatr Soc 2007;55:1216–1223.
18.Avila-Funes JA, Helmer C, Amieva H et al. Frailty among community-dwelling elderly people in France: The Three-City Study. J Gerontol A Biol Sci Med Sci 2008;63A:1089– 1096.
19.Espinoza SE, Hazuda HP. Frailty in older Mexican-American and European-American adults: Is there an ethnic disparity? J Am Geriatr Soc 2008;56:1744–1749.
20.Ensrud KE, Ewing SK, Taylor BC et al. Comparison of 2 frailty indexes for prediction of falls, disability, fractures, and death in older women. Arch Intern Med 2008;168:382–389. 21.Mitnitski AB, Song X, Rockwood K. The estimation of relative fitness and frailty in community-dwelling older adults using self-report data. J Gerontol A Biol Sci Med Sci 2004;59A:M627–M632.
22.Song X, MacKnight C, Latta R et al. Frailty and survival of rural and urban seniors: Results from the Canadian Study of Health and Aging. Aging Clin Exp Res 2007;19:145– 153.
23.Kulminski AM, Ukraintseva SV, Akushevich IV et al. Cumulative index of health deficiencies as a characteristic of long life. J Am Geriatr Soc 2007;55:935–940. 24.Rockwood K, Andrew M, Mitnitski A. A comparison of two approaches to measuring frailty in elderly people. J Gerontol A Biol Sci Med Sci 2007;62A:738–743.
25.Goggins WB, Woo J, Sham A et al. Frailty index as a measure of biological age in a Chinese population. J Gerontol A Biol Sci Med Sci 2005;60A:1046–1051.
26.Woo J, Goggins W, Sham A et al. Public health significance of the Frailty Index. Disabil Rehabil 2006;28:515–521.
27.Gu D, Dupre ME, Sautter J et al. Frailty and mortality among Chinese at advanced ages. J Gerontol B Psychol Sci Soc Sci 2009;64B:279–289.
28.Kulminski AM, Ukraintseva SV, Kulminskaya IV et al. Cumulative deficits better characterize susceptibility to death in elderly people than phenotypic frailty: Lessons from the Cardiovascular Health Study. J Am Geriatr Soc 2008;56:898–903.
29.Hubbard RE, O'Mahony MS, Woodhouse KW. Characterising frailty in the clinical setting—a comparison of different approaches. Age Ageing 2009;38:115–119. 30.Martin FC, Brighton P. Frailty: Different tools for different purposes? Age Ageing 2008;37:161–166.
31.Kish L. Multipurpose sample design. Sur Methodol 1988;14:19–32.
32.Singh MP, Tambay JL, Krawchuk S et al. 1994. The National Population Health Survey: Design and issues [on-line].
33.Statistic Canada. 2006. National Population Health Survey Household Component Longitudinal Documentation [
34.Rockwood K, Mitnitski A, Song X et al. Long-term risks of death and institutionalization of elderly people in relation to deficit accumulation at age 70. J Am Geriatr Soc
2006;54:975–979.
35.Searle SD, Mitnitski A, Gahbauer EA et al. A standard procedure for creating a frailty index. BMC Geriatr 2008;8:24.
36.Rockwood K, Abeysundera MJ, Mitnitski A. How should we grade frailty in nursing home patients? J Am Med Dir Assoc 2007;8:595–603.
37.Rockwood K, Howlett SE, MacKnight C et al. Prevalence, attributes, and outcomes of fitness and frailty in community-dwelling older adults: Report from the Canadian Study of Health and Aging. J Gerontol A Biol Sci Med Sci 2004;59A:1310–1317.
38.Min LC, Elliott MN, Wenger NS et al. Higher vulnerable elders survey scores predict death and functional decline in vulnerable older people. J Am Geriatr Soc 2006;54:507–511.
39.Rockwood K, Song X, MacKnight C et al. A global clinical measure of fitness and frailty in elderly people. Can Med Assoc J 2005;173:489–495.
40.Jones DM, Song X, Rockwood K. Operationalizing a frailty index from a standardized comprehensive geriatric assessment. J Am Geriatr Soc 2004;52:1929–1933.
41.Jones D, Song X, Mitnitski A et al. Evaluation of a frailty index based on a comprehensive geriatric assessment in a population based study of elderly Canadians. Aging Clin Exp Res 2005;17:465–471.
42.Rockwood K, Rockwood MR, Andrew MK et al. Reliability of the hierarchical assessment of balance and mobility in frail older adults. J Am Geriatr Soc 2008;56:1213–1217.
43.Rockwood K, Mitnitski A. Limits to deficit accumulation in elderly people. Mech Ageing Dev 2006;127:494–496.
44.Mitnitski A, Song X, Rockwood K. Improvement and decline in health status from late middle age: Modeling age-related changes in deficit accumulation. Exp Gerontol