HAL Id: tel-02453449
https://tel.archives-ouvertes.fr/tel-02453449
Submitted on 23 Jan 2020HAL is a multi-disciplinary open access archive for the deposit and dissemination of sci-entific research documents, whether they are pub-lished or not. The documents may come from teaching and research institutions in France or abroad, or from public or private research centers.
L’archive ouverte pluridisciplinaire HAL, est destinée au dépôt et à la diffusion de documents scientifiques de niveau recherche, publiés ou non, émanant des établissements d’enseignement et de recherche français ou étrangers, des laboratoires publics ou privés.
To cite this version:
I Gusti Ayu Oka Suryawardani. Tourism leakage of accommodation in Bali. Business administration. Université Panthéon-Sorbonne - Paris I, 2015. English. �NNT : 2015PA010071�. �tel-02453449�
TOURISM LEAKAGE FROM THE ACCOMMODATION
IN BALI
I GUSTI AYU OKA SURYAWARDANI
INDONESIAN-FRENCH DOUBLE DOCTORATE DEGREE
IN TOURISM
UDAYANA UNIVERSITY, DENPASAR
UNIVERSITÉ PARIS 1 PANTHÉON - SORBONNE
2015
i
The work presented in this dissertation is, to the best of my knowledge and belief, original except as acknowledgement in the text. I hereby declare that I have not submitted this material either in whole or in part of a degree at this University or any other institution
Denpasar, April 29, 2015
ii
Balinese community. One of the reasons is tourism leakage that occurs when the industry imports both products and services to support tourism industry in Bali. So far, the amount of tourism leakage in Bali has not been calculated yet. Therefore, there is a need to ascertain the current amount of leakage in Bali tourism.
The objectives of the study are: (i) to calculate the amount of tourism leakage from accommodation sector in Bali at micro (industrial) level; (ii) to calculate the amount of tourism leakage from accommodation sector in Bali at macro (regional) level; (iii) to evaluate the impacts of government subsidies and import reduction by accommodation sector on tourism leakage, job opportunity and income distribution; (iv) to evaluate the perception and preference of foreign tourists on imported and local products as well as the willingness of foreign tourists to spend their money to benefit of Balinese people; (v) to evaluate the points of view of hotel managers related to imported and local products as well as their willingness in reducing the use of imported product and (vi) to develop strategie in minimizing tourism leakage in accommodation in Bali.
Research was designed through quantitative and qualitative approaches. Data was collected by using survey method at four main tourist destinations in Bali, namely: Kuta, Nusa Dua, Sanur and Ubud. There were 79 hotels selected based upon probability proportional to size sampling method which consists of three clusters namely 1,2,3 Star-rated, 4&5 Star-rated either chain and non-chain and Non Star-rated hotels. The number of respondents was 600 foreign tourists were selected as respondents. Calculation of tourism leakage on micro analysis was undertaken by using a method developed by Unluonen, et. al. (2011), meanwhile, on macro analysis was carried out by using a method proposed by Thorbecke (1988) which was based on the Social Accounting Matrix (SAM) of Bali 2010. Perception and preference of foreign tourists on imported and local products were analyzed by using JMP program, meanwhile, Interpretative Structural Modelling (ISM) was undertaken to develope strategies.
The results show that based on the micro analysis, the highest tourism leakage of accommodation sector in Bali is at 4&5 rated chain hotels (51.0 %), followed by 4&5 Star-rated non-chain hotels (22.7 %), 1,2&3 Star-Star-rated hotels (12.0 %), Non-star Star-rated hotels (8.8 %), and with the average leakage of 18.8 %. Based on macro analysis, tourism leakage of accommodation sector in Bali are as follow: (i) Leakage of Non Star-rated hotels is 2.0 %; (ii) Leakage of 1,2&3 Star-rated hotels is 15.7 %; (iii) Leakage of 4&5 Star-rated non-chain hotels is 7.1 %, (iv) Leakage of 4&5 Star-rated chain hotels is 55.3%; and (v) Average leakage of all types of accommodation is 19.5%. Foreign tourists significantly look for local products and are willing to spend their money for Balinese people. Hotel managers are willing to use local product as long as local products are available to substitute the imported products. Strategies for minimization tourism leakage are optimizing the potential of local products, develop agriculture and livestock; reduce the use of imported products for tourists, improve quality of local products and human resources, empower community, urge government to develop and implement supporting policies in minimizing tourism leakage, establish policy on restriction of foreign investment on accommodation in Bali, improve the role of Ministry of Foreign Affairs, Ministry of Industry, Ministry of Trade and Ministry of Tourism and Creative Economy. 7 Ps of marketing mix on service: product, price, place, promotion, people, process and physical evidence need to be implemented in order to support sustainable tourism in Bali
iii
SUMMARY
Tourism has been a driving force of economic development in Bali Province and has become the leading economic sector in Bali’s economy. However, the economic impact of tourism development has not been convinced to be fully beneficial for Balinese community. There is a phenomenon that tourists’ expenditures have not been totally become tourism income of Bali’s economy due to some incomes leak out the destination, called tourism leakage, in the form of payment for imported products and services, payment of wages for foreign employees, and profit transfer to foreign owners. Leakage could be defined as losses from the national income flows which have been generated during the transition from the local/national consumption income cycle to the spending chain (Bull, 1991). So that, there is a need to ascertain the current amount of leakage on accommodation occurred in Bali tourism.
The objectives of the study are: (i) to calculate the amount of tourism leakage from accommodation sector in Bali at micro (industrial) level; (ii) to calculate the amount of tourism leakage from accommodation sector in Bali at macro (regional) level; (iii) to evaluate the impacts of government subsidies and import reduction by accommodation sector on tourism leakage, job opportunity and income distribution; (iv) to evaluate the perception and preference of foreign tourists on imported and local products as well as the willingness of foreign tourists to spend their money to benefit of Balinese people; (v) to evaluate the points of view of hotel managers related to imported and local products as well as their willingness in reducing the use of imported products and giving the priority
iv
on local products; and (vi) to develop a strategy in minimizing tourism leakage in accommodation sector in Bali.
Research is designed through quantitative and qualitative approaches. Quantitative analysis was undertaken in order: (i) to calculate tourism leakage by using micro and macro analysis; (i) to calculate tourism leakage by using micro and macro analysis (ii) to analyze perception and preference of foreign tourists on imported and local products; and (iii) to assess the willingness of foreign tourists to spend their money for the benefit of Balinese people. Calculation of tourism leakage through micro analysis was undertaken at industrial level (hotels), meanwhile macro analysis was undertaken to calculate tourism leakage at macro (regional) level. Qualitative analysis was undertaken in order: (i) to evaluate hotel managers’ points of view regarding the use of imported and local products, and their willingness in reducing imported products; and (ii) to develop strategy in minimizing tourism leakage based on Interpretative Structural Modeling (ISM).
Calculation of tourism leakage on micro analysis was undertaken by using a method that was developed by Unluonen et. al. (2011). Data were collected by a survey at four main tourist destinations in Bali, namely: Kuta, Nusa Dua, Sanur and Ubud. There were 79 hotels selected as sampling hotels. Sampling was undertaken based upon a probability proportional to size sampling method. Three clusters of accommodation were chosen, namely: (i) 1,2&3 Star-rated hotels; (ii) 4&5 Star-rated chain hotels, and 4&5 Star-rated non-chain hotels; and (iii) Non-star rated hotels. Meanwhile, calculation of tourism leakage on macro analysis was undertaken by using a method proposed by Thorbecke (1988). Calculation
v
was based on the Social Accounting Matrix (SAM) Bali 2010 and other related data.
Perception and preference of foreign tourists on imported and local products as well as assessment of the willingness of foreign tourists to spend their money for the benefit of Balinese people were analyzed by using JMP (John’s Macintosh Project), a software program from SAS Company. Moreover, analysis of significance of variables is supported by Likert scale on seven scale categories.
The results show that:
1) Based on the micro analysis, tourism leakage of accommodation sector in Bali are as follow: (i) Leakage of Non-star rated hotels is 8.8 %; (ii) Leakage of 1,2&3 Star-rated hotels is 12.0 %; (iii) Leakage of 4&5 Star-rated non-chain hotels is 22.7 %; (iv) Leakage of 4&5 Star-rated chain hotels is 51.0 %; and (v) Average leakage of all types of accommodation is 18.8 %.
2) Based on macro analysis, tourism leakage of accommodation sector in Bali are as follow: (i) Leakage of Non-star-rated hotels is 2.0 %; (ii) Leakage of 1,2&3 Star-rated hotels is 15.7 %; (iii) Leakage of 4&5 Star-rated non-chain hotels is 7.1 %; (iv) Leakage of 4&5 Star-rated chain hotels is 55.3%; and (v) Average leakage of all types of accommodation is 19.5%.
Central, provincial and local government play an important role in minimizing tourism leakage, increasing job opportunity and increasing income distribution through policies on giving subsidies. Involvement of accommodation sector was also crucial through minimizing the use of imported products and services, and the utilization of foreign employees. The optimum result was found
vi
through a simulation by using a scenario (simulation-5), in which the government gave subsidies about 40% to Non rated hotel and about 18.5% to 1,2&3 Star-rated hotels. At the same time, accommodation sector also reduced import about 25% on 1,2&3 Star-rated hotels and about 30% on 4&5 Star-rated chain hotels. This simulation-5 resulted in: (i) Decreasing the average leakage by 12.0 % (from 19.5 % to 7.5 %), (ii) Increasing job opportunity by14.8%, and (iii) Increasing income of low class of people in urban area by 0.26%.
The results show that the average score of perception of foreign tourists on perceived quality of local products was higher than imported products, in which the average score of local products is 5.59 out of 7 scale (categorized well) while imported products is 5.24 (categorized good). Most of foreign tourists (76.8%) preferred local products. Regarding relationship between preference of foreign tourists and their perception on the quality of local products, the statistical results show that there are perfect positive relationships between tourists’ preference and their perceived quality of local products. These findings demonstrate that foreign tourists significantly look for local products that are available in Bali.
Different points of view are found between foreign tourists and hotel managers regarding local products. Hotel managers thought that foreign tourists preferred imported products. The reason of hotel managers in choosing imported products is that the quality of imported products is better than local products. Meanwhile statistical results indicate that foreign tourists significantly look for local products. There is a need to encourage hotel managers to change their perception and attitude about local and imported products. The results of this
vii
study support the above idea, in which most of hotel managers are willing to reduce the use of imported products and giving the priority to local products as long as quality and continuity of local products are available in order to substitute the imported products. The less imported products consumed by foreign tourists, therefore tourism leakage will also decrease.
Strategy of minimization of tourism leakage in accommodation sector in Bali is developed based upon the results of Interpretative Structural Modeling (ISM). There are six groups of strategy proposed according to six elements of minimization program for tourism leakage in accommodation sector. Each strategy is composed based on the key elements resulted from ISM. Some of important strategies are: (i) to optimize the potential of local products; (ii) to develop agriculture, livestock, fisheries and handicraft industry; (iii) to empower community; (iv) to reduce the use of imported products for tourists; (v) to urge government to develop and implement supporting policies in order to minimize leakage; (vi) to establish International Trade Policy that reduces import and increases export of local products; (vii) to facilitate public-private partnership on investment in tourism; and (viii) to improve the role of Ministry of Foreign Affairs in promoting Bali tourism worldwide and to encourage tourists to consume local products.
Marketing strategy to minimize tourism leakage in Bali can be undertaken based on the 7 Ps of marketing mix on service and hospitality approach namely product, price, place, promotion, people, process and physical evidence in order to support sustainable tourism in Bali. Process of delivering products and services to
viii
the consumers and participation of people/participants are really important in order to minimize tourism leakage of Bali tourism, including participation of people in developing tourism products, supported by reasonable price, appropriate promotion tools, availability of local transportations in the spots destination which have lower impact on the environment and physical evidence of the products and service offered to the appropriate target market. The final purpose is to achieve sustainable tourism through ensure the quality, continuity and balance between the needs of tourism, protection of the environment and prosperity for the local community, which means that the economic benefit of tourism should not only for the companies concerned but also for the local communities as the host.
It is concluded that tourism leakage needs to be minimized. Quality of products and human resources are crucial to be addressed in order to minimize tourism leakage. By giving more benefits from tourism to the community, it means that quality of life of community will improve, quality of environment will be maintained and improved, and therefore better quality experiences for tourists will be.
ix
SUMMARY ... iii
TABLE OF CONTENTS ... ix
LIST OF TABLES ... xv
LIST OF FIGURES ... xviii
LIST OF SYMBOLS ... xx
LIST OF APPENDICES ... xxi
PART I
INTRODUCTION, LITERATURE REVIEW, AND RESEARCH FRAMEWORK AND CONCEPT 1 CHAPTER I INTRODUCTION ... 2 1.1 Background ... 2 1.2 Problem Formulation ... 15 1.3 Research Objectives ... 16 1.4 Research Benefits ... 17 CHAPTER II LITERATURE REVIEW ... 18 2.1 Introduction ... 182.2 National Income in Open Economy ... 19
2.3 The SAM as an Accounting System and Conceptual Framework .... 22
2.4 Systems Thinking ... 27
2.5 The Importance of Tourism Multiplier Effects in Increasing Income and Job Opportunity ... 30
2.6 Previous Studies Related to Leakage in Tourism ... 37
2.7 Minimizing Leakages for Optimizing Tourism Benefits... 45
2.8 Previous Studies Related to Perception and Preference ... 48
2.9 The Role of Marketing in Sustainable Tourism Development ... 50
2.10 Conclusion ... 63
CHAPTER III RESEARCH FRAMEWORK AND CONCEPT ... 64
3.1 Introduction ... 64
3.2 Framework of the Study ... 64
3.3 Concepts ... 66
3.3.1 Sustainable Tourism ... 66
3.3.2 Tourism Leakages . ... 68 3.3.3 Structure of Social Accounting Matrix (SAM) of Bali 2010 . 70
x
3.3.7.3 Familiarity ... 84
3.3.7.4 Expectation ... 85
3.3.8 Interpretative Structural Modeling (ISM) ... 86
3.4 Hypotheses ... 88
3.5 Conclusion ... 89
PART II
RESEARCH METHODS, RESULTS AND DISCUSSION 90 CHAPTER IV RESEARCH METHODS ... 914.1 Introduction ... 91
4.2 Micro Analysis in Calculating Tourism Leakage in Accommodation Sector ... 93
4.2.1 Research Location and Period Time of Research ... 93
4.2.2 Sample Design ... 93
4.2.3 Scope of the Study ... 94
4.2.4 Method of Data Analysis ... 95
4.2.5 Variables of Micro Analysis ... 97
4.2.6 Research Instruments ... 100
4.2.7 Limitation of the Micro Analysis Model ... 100
4.3 Macro Analysis in Calculating Tourism Leakage in Accommodation Sectors ... 101
4.3.1 Research Location and Time Period of Research ... 101
4.3.2 Data and Source of Data ... 101
4.3.2.1 Data ... 101
4.3.2.2 Sources of Data ... 103
4.3.3 Identification of Variables ... 103
4.3.4 Method of Data Analysis ... 109
4.3.5 Limitation of Social Accounting Matrix ... 112
4.3.6 Social Accounting Matrix Hotel in Bali ... 112
4.3.7 Tourism Leakage Calculation Based on Macro Analysis ... 113
4.3.7.1 Account of Receipt and Expenditure of Hotels in Bali . 113 4.3.7.2 Account of Productions of Hotel in Bali ... 114
4.4 Impact of Government Subsidies and Import Reduction by Tourism Industry on Tourism Leakage, Job Opportunity Distribution and Income Distribution ... 115
4.4.1 Multiplier Analysis of Social Accounting Matrix ... 115
xi
4.5.4 Identification of Variables ... 119
4.5.5 Method of Data Analysis ... 121
4.5.5.1 Analysing of Perception ... 121
4.5.5.2 Reasons for Using Seven Point Scale ... 123
4.5.5.3 Preference ... 124
4.5.5.4 Data Analysis ... 124
4.5.6 Validity and Reliability ... 125
4.5.7 Research Instruments ... 126
4.6 Point of View of Hotel Managers ... 127
4.6.1 Research Location and Period of Research ... 127
4.6.2 Sample Design ... 127
4.6.3 Identification of Variables ... 128
4.6.4 Method of Data Analysis ... 128
4.7 Interpretative Structural Modeling (ISM) ... 129
4.7.1 Determining Experts ... 129
4.7.2 Constructing Elements ... 130
4.7.3 Limitations of Interpretative Structural Modeling ... 133
4.7.4 Conclusion ... 133
CHAPTER V RESULTS ... 134
5.1 Results of Micro Analysis of Tourism Leakage on Accommodation Sector ... 134
5.1.1 Introduction ... 134
5.1.2 Characteristics of the Sampling Hotels ... 134
5.1.3 Description of Imported Products Used by Hotels ... 138
5.1.4 Annual Revenue of the Sampling Hotels ... 141
5.1.5 Tourism Leakage of the Sampling Hotels ... 143
5.1.5.1 Sources of Tourism Leakage ... 143
5.1.5.2 Calculation of Revenue and Leakage of the Sampling Hotels ... 144
5.1.5.3 Average Tourism Leakage of the Sampling Hotels ... 146
5.1.5.4 The Sequence of the Sources of Tourism Leakage ... 148
5.1.6 Conclusion ... 151
5.2 Result of Macro Analysis of Tourism Leakage on Accommodation Sector ... 152
5.2.1 Introduction ... 152
5.2.2 Description of Account for Each Type of Hotel ... 152
5.2.2.1 Receipt-Expenditure Account and Production Account of Non-star Rated Hotels ... 152
xii
5.2.2.3 Receipt-Expenditure Account and Production Account
of 4&5 Star-rated Non-Chain Hotels ... 158
a. Receipt-Expenditure Account of 4&5 Star-rated Non-Chain Hotels ... 158
b. Production Account of 4&5 Star-rated Non-Chain Hotels .. 160
5.2.2.4 Receipt-Expenditure Account and Production Account of 4&5 Star-rated Chain Hotels ... 161
a. Receipt-Expenditure Account of 4&5 Star-rated Chain Hotels ... 161
b. Production Account of 4&5 Star-rated Chain Hotels ... 163
5.2.3 Calculation of Tourism Leakage from Accommodation Sector in Bali Based on Macro Analysis ... 164
5.2.4 Conclusion ... 168
5.3 Impact of Government Subsidies and Import Reduction by Accommodation Sector on Tourism Leakage, Job Opportunity and Income Distribution ... 170
5.3.1 Introduction ... 170
5.3.2 Simulations ... 171
a. Impacts on Tourism Leakage ... 173
b. Impact on Job Opportunity ... 173
c. Impact on Income Distribution ... 175
5.3.3 The Simulation Results with the Optimum and the Worst Impacts ... 178
a. Simulation with Optimum Impact ... 178
b. Simulation with the Worst Impact ... 179
5.3.4 Conclusion ... 181
5.4 Perception and Preference of Foreign Tourists regarding Imported and Local Products ... 182
5.4.1 Introduction ... 182
5.4.2 Characteristics of Foreign Tourists who Visited Bali ... 182
5.4.2.1 Country of Origin ... 182 5.4.2.2 Code of Citizenship ... 183 5.4.2.3 Sex ... 184 5.4.2.4 Age ... 185 5.4.2.5 Occupation ... 185 5.4.2.6 Place of Stay ... 186 5.4.2.7 Type of Accommodation ... 187 5.4.2.8 Length of Stay ... 188
5.4.3 Opinion, Expectation and Satisfaction of Respondents ... 189
xiii
5.4.4 Perception of Foreign Tourists regarding Imported and
Local Products ... 196
5.4.5 Preference of Foreign Tourists and Evaluation of Local Products ... 199
5.4.5.1 Preference of Foreign Tourists for Local Products ... 199
5.4.5.2 Evaluation of Perceived Quality of Local Products and Preference by Foreign Tourists ... 200
5.4.6 Analysis of Relationships between Variables ... 201
5.4.6.1 Relationship between Familiarity and Satisfaction ... 201
5.4.6.2 Relationship between Familiarity and Benefit for Balinese ... 203
5.4.6.3 Relationship between Familiarity and Perception of Quality ... 204
5.4.6.3.1 Relationship between Familiarity and Perceptions on Quality of Services ... 204
5.4.6.3.2 Relationship between Familiarity and Perceptions on Quality of Products ... 205
5.4.6.4 Relationship between Familiarity and Motivation ... 206
5.4.6.5 Relationships between Motivation, Satisfaction, Perception of Quality of Services and Benefit for Balinese ... 207
5.4.6.6 Relationship between Perception of Quality of Products and Benefit for Balinese ... 208
5.5 Point of View of Hotel Managers ... 210
5.5.1 Introduction ... 210
5.5.2 Reasons in Choosing Imported Products ... 210
5.5.3 Point of View of Hotel Managers on Local Products ... 212
5.5.4 Point of View of Hotel Managers on Cause and Impact of Leakage in Tourism Industry ... 214
5.5.5 Willingness in Reducing Imported Products and Giving the Priority on Local Products ... 214
5.5.6 Conclusion ... 215
5.6 Minimization of Tourism Leakage in Accommodation Sector in Bali ... 217
5.6.1 Program Goals for Minimization of Tourism Leakage ... 217
5.6.2 Program Needs for Minimization of Tourism Leakage ... 220
5.6.3 Affected sectors for Minimization of Tourism Leakage ... 224
xiv
DISCUSSION ... 237
6.1 Introduction ... 237
6.2 Micro and Macro Analysis of Tourism Leakage in Accommodation Sector ... 238
6.3 Impact of Government Subsidies and Import Reduction by Accommodation Sector on Tourism Leakage, Job Opportunity and Income Distribution ... 243
6.4 Perception and Preference of Foreign Tourists on Imported and Local Products ... 246
6.5 Relationships Between Variables ... 248
6.5.1 Relationships between Variables of Familiarity and Variables of Satisfaction ... 248
6.5.2 Relationships of Some Variables with Variable Benefit for Balinese People ... 250
6.6 Points of View of Hotel Managers and Willingness in Reducing Tourism Leakage ... 253
6.7 Strategy of Minimization of Tourism Leakage at Accommodation Sector ... 259
6.8 Marketing Strategy to Minimize Tourism Leakage in Bali ... 266
6.9 Novelty ... 290
6.10 Conclusion ... 290
PART III CONCLUSION AND SUGGESTION 292 CHAPTER VII CONCLUSION AND SUGGESTION ... 293
7.1 Conclusion ... 293
7.2 Suggestion for Future Research ... 298
REFERENCES ... 300
xv
Leakages ... 98
4.3 Scheme of Social Accounting Matrix (SAM) ... 110
4.4 Receipt-Expenditure Account of Hotel in Bali ... 114
4.5 Productions Account for Hotels in Bali ... 115
4.6 Variables of Familiarity, Satisfaction, Motivation and Perception, and Benefits for Balinese ... 121
4.7 Scale, Interval and Level of Interpretation ... 122
4.8 Elements and Contextual Relationship between Elements in Minimizing Tourism Leakage in Accommodation Sector in Bali 131 5.1.1 Number of Hotels Selected as Sample ... 135
5.1.2 The Average Number of Rooms, Room Occupancies, Length of Stay and Room Rates in Year 2012 ... 137
5.1.3 Ownership and Management System of the Sampling Hotels ... 137
5.1.4 The Average of Indonesian and Foreign Employees of the Sampling Hotels ... 138
5.1.5 Imported Products in the Sampling Hotels ... 140
5.1.6 Average of Annual Expenditure per Hotel for Imported Products by the Sampling Hotels ... 141
5.1.7 Annual Revenue of the Sampling Hotels in Year 2012 ... 142
5.1.8 Average Tourism Leakage of the Sampling Hotels ... 147
5.1.9 The Sequence of the Sources of Tourism Leakage in the Sampling Hotels ... 149
5.1.10 The Amount of Leakage from Each Source for Each Type of Accommodation In Bali ... 150
5.2.1 Receipt-Expenditure Account of Non-star rated Hotels in 2012 . 153 5.2.2 Production Account of Non-star rated Hotels in 2012 ... 155
5.2.3 Receipt-Expenditure Account of 1,2&3 Star-rated Hotels in 2012 ... 157
xvi
in 2012 ... 163 5.2.8 Production Account of 4&5 Star-rated Chain Hotels in 2012 ... 164 5.2.9 Percentage of Tourism Leakage of Bali Tourism on
Accommodations Sector in 2012 ... 167 5.3.1 Scenario of Government Subsidies and Import Reduction by
Accommodation Sector of Bali for the First Simulation ... 172 5.3.2 Impact of Simulation-1 on Production Activities and Leakage in
Accommodation Sector of Bali Tourism ... 172 5.3.3 Comparison of Tourism Leakage in Accommodation Sector
of Bali Tourism between Before and After the First Simulation . 173 5.3.4 Impact of First Simulation on Job Opportunity in
Accommodation Sector of Bali Tourism ... 174 5.3.5 Impact of First Simulation in Increasing Job Opportunity in
Accommodation Sector of Bali Tourism ... 174 5.3.6 Impact of First Simulation on Income Distribution of
Household in Bali ... 175 5.3.7 Impact of Simulation-1 on Wages/Salaries of Labour on
Accommodation Sector of Bali Tourism ... 176 5.3.8 Recapitulation of Results of Simulations using Scenarios of
Government Subsidies and Import Reduction of Bali Tourism . 177 5.3.9 Scenario of Government Subsidies and Import Reduction by
Accommodation Sector of Bali Tourism for the Fifth Simulation 178 5.3.10 Comparison of Tourism Leakage in Accommodation Sector
of Bali Tourism between Before and After the Fifth Simulation 178 5.3.11 Impact of Fifth Simulation on Job Opportunity in
Accommodation Sector of Bali Tourism ... 179 5.3.12 Scenario of Government Subsidies and Import Reduction by
Accommodation Sector of Bali Tourism for the Sixth Simulation 180 5.3.13 Comparison of Tourism Leakage in Accommodation Sector
of Bali Tourism between Before and After the Sixth Simulation 180 5.3.14 Impact of Sixth Simulation on Job Opportunity in
xvii
5.4.5 Emotional Level ... 193 5.4.6 Foreign Tourists’ Level of Satisfaction with the Whole Trip in
Bali ... 194 5.4.7 Agreement on Spending Money of Foreign Tourists for Balinese
People in Priority ... 195 5.4.8 Average Scores for Perceptions on Imported and Local Products 197 5.4.9 Statistical Results of Foreign Tourists’ Preference for Local
Products ... 201 5.4.10 Relationship between Familiarity and Benefit for Balinese ... 203 5.4.11 Relationship between Familiarity and Perception of Quality of
Products ... 206 5.4.12 Relationship between Familiarity and Motivation ... 207 5.4.13 Relationship between Perceptions on Quality of Products and
Benefit for Balinese ... 209 5.6.1 Contextual Relationship of Each Sub-element within the
Element ... 217 5.6.2 Reachability Matrix of Program Goals for Minimization of
Tourism Leakage ... 219 5.6.3 Reachability Matrix of Program Needs for Minimization of
Tourism Leakage ... 222 5.6.4 Reachability Matrix of Affected sectors for Minimization of
Tourism Leakage ... 225 5.6.5 Reachability Matrix of Program Constraints for Minimization
of Tourism Leakage ... 228 5.6.6 Reachability Matrix of Possible Changes for Minimization of
Tourism Leakage ... 231 5.6.7 Reachability Matrix of Involvement of Agencies in the
Minimization Strategy of Tourism Leakage ... 235 6.1 Tourism Leakage in Accommodation Sector in Bali ... 238
xviii
1.2. Numbers of Foreign Tourist Direct Arrivals in Bali 1970-2012 . 5
1.3. Number of Rooms Available in Bali in 2002-2012 ... 7
1.4. Three Coins of Triple Bottom Line by Elkington (1997:89) ... 10
1.5. Gini Ratio of Bali 1997-2012 ... 13
2.1. Flow Diagram of Social Accounting Matrix Transactions ... 24
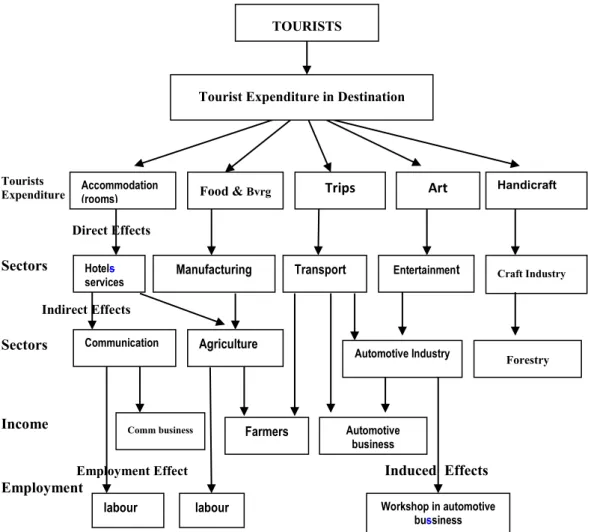
2.2. Diagram of Direct Effects, Indirect Effects, Induced Effects and Job Opportunity in Tourism Sector ... 31
3.1. Framework of Study ... 65
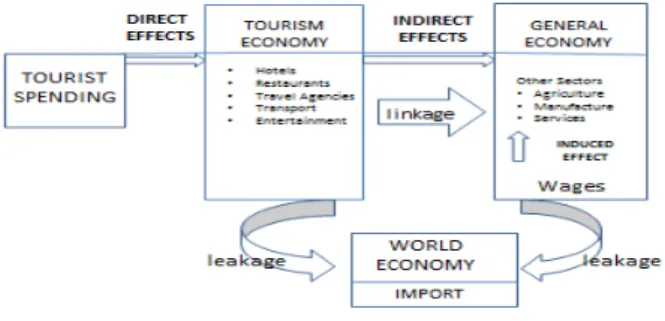
3.2. Effect of Tourism: Direct, Indirect and Induced Effects ... 70
5.1. Average Tourism Leakage of the Sampling Hotels ... 147
5.4.1. Percentage of Respondent based on Country of Origin ... 183
5.4.2. Percentage of Respondent based on Citizenship ... 184
5.4.3. Percentage of Respondents based on Sex ... 184
5.4.4. Percentage of Respondents based on Age Group ... 185
5.4.5. Percentage of Respondents based on Occupation ... 186
5.4.6. Percentage of Respondents based on Place of Stay ... 186
5.4.7. Percentage of Respondents based on Type of Accommodation .. 188
5.4.8. Opinions, Expectations and Satisfaction of Foreign Tourists ... 196
5.4.9. Average Score for Perceptions on Imported Products ... 198
5.4.10. Average Score for Perceptions on Local Products ... 199
5.4.11. Percentage of Respondents who Preferred Local Products ... 200
5.4.12. Relationships between Familiarity and Satisfaction ... 202
5.4.13. Relationships between Familiarity and Perceptions on Quality, and Motivation ... 204
5.4.14. Relationship between Satisfaction, Perception of Quality of Services and Benefit for Balinese ... 208
5.6.1. Relationships between Driver Power and Dependence of Sub-elements of Program Goals for Minimization of Tourism Leakage ... 220
xix
5.6.4. Structural Hierarchy of Sub-elements of Program Needs for
Minimization of Tourism Leakage ... 223 5.6.5. Relationships between Driver Power and Dependence of
Sub-elements of Affected Sectors for Minimization of Tourism
Leakage ... 226 5.6.6. Structural Hierarchy of Sub-elements of Affected Sectors for
Minimization of Tourism Leakage ... 226 5.6.7. Relationships between Driver Power and Dependence of
Sub-elements of Program Constraints for Minimization of
Tourism Leakage ... 229 5.6.8. Structural Hierarchy of Sub-elements of Program Constraints
For Minimization of Tourism Leakage ... 230 5.6.9. Relationships between Driver Power and Dependence of Sub-
elements of Possible Changes for Minimization of Tourism
Leakage ... 232 5.6.10. Structural Hierarchy of Sub-elements of Possible Changes for
Minimization of Tourism Leakage ... 233 5.6.11. Relationship between Driver Power and Dependence of Sub-
elements of Involvement of Agencies in the Minimization
Strategy of Tourism Leakage ... 236 5.6.12. Structural Hierarchy of Sub-elements of Involvement of
Agencies in the Minimization Strategy of Tourism Leakage ... 236 6.1. Relationships between Variables ... 250 6.2. Model for Minimization of Tourism Leakage on
Accommodation Sector ... 262 6.3. Seven Ps of Marketing Mix in Services and Hospitality ... 267
xx
= means equal to ≠ means not equal to + means plus
- means minus
× means multiply : means devided by % means percentage
F1 means Country of residence F2 means Large code of residence F3 means Periodicity viciting Bali F4 means Visit more than 5 times
S1 means Satisfaction of accommodation and restaurants’ services in Bali S2 means Satisfaction of the whole trips
S3 means Satisfaction on the level of emotion during visiting Bali S4 means Satisfaction on the level of expectation
M1 means Reason for coming (Visit Friend and Relatives/VFR) M2 means Main Purpose
M3 means Activities P1 means accommodation P2 means restaurant P3 means imported meat P4 means local meat
P5 means imported fisheries P6 means local fisheries
P7 means imported dairy products P8 means local dairy products P9 means imported fruits P10 means local fruits
P11 means imported vegetables P12 means local vegetables P13 means imported beverages P14 means local beverages P15 means building style P16 means furniture
P17 means room decoration P18 means architecture
xxi
3.1. Research Locations ... 322 4.1. Questionnaire Related to Imported Products used in the Hotels
and Point of Views of Hotel Managers ... 323 4.2. Questionnaire for Foreign Tourists ... 329 4.3. Social Accounting Matrix of Hotel of Bali 2010
(Matrix_31x31) (Million Rph) ... 334 4.4. ISM Questionnaire ... 335 4.5. List of Respondents for Interpretative Structural Modeling (ISM) 351 4.6. Flow Diagram for Preparing ISM Model ... 352 5.1. Recapitulation of Calculation of Leakage of Non Star-rated
Hotels ... 353 5.2. Recapitulation of Calculation of Leakage of 1,2,3 Star-rated
Hotels ... 354 5.3. Recapitulation of Calculation of Leakage of 4,5 Star-rated
Non-chain Hotels ... 355 5.4. Recapitulation of Calculation of Leakage of 4,5 Star-rated
Chain Hotels ... 356 5.5. Social Accounting Matrix of Hotel of Bali 2010
(Matrix_108x108) ... 357 5.6. Result of Validity Test of 600 Foreign Tourists ... 384 6. Coaching for Fieldworkers ... 385 7. Interview with Head of Bali Government Tourism Office
(Ida Bagus Kade Subhiksu) ... 386 8. Survey for Foreign Tourists at Four Main Destinations Area
1
PART I
INTRODUCTION
LITERATURE REVIEW
CHAPTER I INTRODUCTION
1.1 Background
Bali has been known as one of the most popular tourist destinations in the world due to its cultural activities and natural scenery. Tourism has now become a driving force in the economic development of Bali Province and has become the leading economic sector in Bali‟s economy. As Bali‟s economy has been developed mostly through tourism, the development of the tourism sector in Bali has resulted in an economic shift away from the agricultural sector to the service sector. The contribution of the agricultural sector to the Gross Domestic Product (GDP) of Bali has decreased dramatically from 61.21% in 1969 to 16.84% in 2012 while the contribution of the service sector (trade, hotels, and restaurants) has increased from 9.52% in 1969 to 30.66% in 2012, as can be seen in Figure 1.1. Meanwhile, the contribution of the industrial sector (such as handicraft industry, etc.) has fluctuated but shown an upward trend, growing from 1.67% in 1969 to 9.97% in 2010 (Erawan, 1994 cited in Wiranatha, 2001; Bali Central Bureau of Statistics, 2013), see Figure 1.1. Even though the contribution of the agricultural sector has decreased, however, it still has a crucial role in Bali‟s economy. This role includes its functions as: (i) a source of jobs and incomes; (ii) a provider of raw materials for agro-industry; (iii) an earner of foreign exchange from the export of several agricultural products such as vanilla, cocoa, seaweed and tuna; (iv) an element in natural resources
tourist direct arrivals increased slightly after the tragedy, i.e. to 1,458,309 tourists in 2004. However, the second Bali bombing in 2005 also led to a drop in the number of foreign tourist direct arrivals, which fell to 1,260,317 in 2006. The Bali bombs had the greatest impact on international tourists visiting Bali if compared to other crises in the history of tourism in Bali (Putra and Hitchcock, 2006). Efforts were undertaken by the government to persuade foreign tourists to visit Bali after the second Bali bombing tragedy. This program, called the “Bali Recovery Program”, was undertaken in 2006 through collaboration between the Ministry of Culture and Tourism and the Bali Tourism Board. Gradual increases in foreign tourist direct arrivals were reported in the following years and by 2012 the number had reached about 2,892,019. During the period from 2007 up to 2012, the average growth rate in foreign tourist direct arrivals to Bali was 14.7 % per year (Bali Government Tourism Office, 2011). The development of foreign tourist direct arrivals in Bali between 1970-2012 is presented in Figure 1.2.
As a world-class tourist destination, Bali is supported by the availability of infrastructures, including an international airport which provides international access to Bali, and main roads which provide easy access to various tourism facilities and attractions within the region. Data provided by the Bali Government Tourism Office (2013) show that there were 2,212 units of accommodation with a total of 46,025 rooms registered in Bali in 2012. These included 156 star-rated hotels (20,269 rooms), 1,031 non star-rated hotels (21,114 rooms), and 1,025 homestays (4,642 rooms). This growth in registered accommodations in Bali during the period of 2002-2012 is shown in Figure 1.3. However, the figures provided by the Bali Hotel and Restaurant Association (PHRI Bali) differ. They listed a total of 3,346 units of accommodation (62,407 rooms) in Bali in 2011, consisting of 165 star-rated hotels (22,161 rooms), 1,371 non star-rated hotels (28,585 rooms), 1,760 homestays (9,282 rooms), 15 condotels (1,793 rooms), and 35 rental houses (586 rooms). It could be that more accommodation is available in Bali than the above numbers indicate as there are also many more accommodations which are unregistered or operate illegally.
In 2008, there was a world economic crisis. However it did not have an obvious effect on the arrival of foreign tourists in Bali. This can be seen from the number of foreign tourists visiting Bali, which increased dramatically from 1,968,892 in 2008 to 2,2892,019 in 2012, a rise of about 923,127 during 2008-2012 (see Figure 1.2). In addition, the average tourist expenditure and length of stay also increased during this period. The average expenditure of foreign
amount of local income generated per unit of visitor expenditure will become a multiplier for Bali‟s economy through backward and forward linkages. Data from the Bali Central Bureau of Statistics (2011) show that the lowest multiplier effect from the hotel and restaurant sub-sector was contributed by the agricultural and industrial sectors. Backward linkage of Bali tourism performed the second highest after that of the industrial sector, at 1.71, and forward linkage performed the highest amount at 1.87. Backward linkage of 1.71 means that every one dollar of tourist spending generates 1.71 dollars in local income through backward linkage, i.e. impact on related industries. In this situation, outputs of related industries (such as agricultural products, fishery products, livestock products, handicrafts, etc.) are used as input by the tourism industry in order to fulfill demand from tourists. Thus, every one dollar of tourist spending will generate 1.71 dollars income for these other related industries. Meanwhile, forward linkage of 1.87 means that every one dollar of tourist spending will generate 1.87 dollars in local income through forward linkage, i.e. other industries which use the output of tourism industries as input to their industries. This means that output of the tourism industry is supplied to other industries. For example, accommodation in tourism is used as an input by travel agents. Travel agents offer accommodation to tourists in order to gain profits. In this situation, forward linkage of 1.87 means that every one dollar of tourist spending will generate 1.87 dollars income for travel agents. According to Mill and Morison (2009), if output from backward linkage is supplied to the tourism industry from imported products, then the income generated from tourism will leak out of the
country. Similarly, if the industries which use the output of tourism as input belong to foreigners, then the income from tourism will also leak out of the country.
The government of Bali faces the problem of how to maintain the sustainable development of tourism. The concept of “sustainable tourism” derives from the concept of "sustainable development" which has been widely adopted since its appearance in „Our Common Future‟ (WCED, 1987). Sustainable development is defined as:
" … development that meets the needs of the present without compromising the ability of future generations to meet their own needs"… (WCED, 1987:68).
It contains two key concepts:
The concept of 'needs', in particular the essential needs of the world's poor, to which overriding priority should be given; and
The idea of limitations imposed by “the state of technology” and “social organization on the environment's ability” to meet present and future needs ( http://www.un-documents.net/our-common-future.pdf).
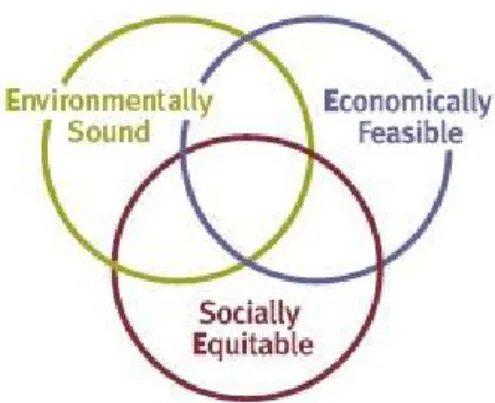
Elkington (1997) defines sustainable development in terms of a Triple Bottom Line (TBL) that stipulates that development be environmentally sound, economically feasible and socially equitable (see Figure 1.4). The TBL was later expanded and articulated in his book entitled “Cannibals with Forks: The Triple Bottom Line of 21st Century Business” (Elkington, 1997).
Figure 1.4. Three Coins of Triple Bottom Line by Elkington (1997:89)
The concept of sustainable development was later developed into a more specific tourism principle. UNWTO defines sustainable tourism as:
" … Tourism that takes full account of its current and future economic, social and environmental impacts, addressing the needs of visitors, the industry, the environment and host communities …"
(http://sdt.unwto.org/en/content/about-us-5).
Sustainable tourism development also refers to the environmental, economic, and socio-cultural aspects of tourism development, and a suitable balance must be established between these three dimensions to guarantee its long-term sustainability. In addition, sustainable tourism should also maintain a high level of tourist satisfaction and ensure a meaningful experience for the tourists, raising their awareness about sustainability issues and promoting sustainable tourism practices amongst them (http://sdt.unwto.org/en/content/about-us-5). Sustainable tourism is also defined as :
“... holistic systems that meet the need of present tourists and host regions while protecting and enhancing opportunities for the future. It is envisaged as leading to management of all resources in such a way that economic, social and aesthetic needs can be fulfilled while maintaining cultural integrity, essential ecological processes, biological diversity and life support systems ...”
(Insula-International Scientific Council for Island Development, 1995 cited from http://www.insula.org/tourism/charter.htm).
Furthermore, Elkington (1997) stated that “Triple Bottom Line” means expanding the traditional reporting framework to take into account both ecological and social performance to enhance economic performance. All of those three elements should be coherent with each other, to ensure quality, continuity and balance between the needs of tourism, protection of the environment and prosperity for the local community, which means that the economic benefit of tourism should be beneficial not only for the companies concerned but also for the local communities as the host. The business entity should be used as a vehicle for coordinating stakeholders‟ interests, instead of maximizing shareholder (owner) profit, so that it can achieve quality, continuity and balance. Good quality, sustainable tourism provides a quality experience for the visitor, while improving the quality of life of the host communities and protecting the quality of the environment. As regards continuity, sustainable tourism ensures the continuity of the natural resources upon which it is based and the continuity of the culture of the host community with satisfying experiences for visitors. Balanced, sustainable tourism balances the needs of the tourism industry, the natural environment and the local communities. Sustainable tourism emphasizes mutual goals and cooperation among visitors, host communities and destination, in contrast to more traditional approaches to tourism which emphasize their diverse and conflicting needs (WTO, 2007; http://www.kennuncorked.com/sustainable_defined.html#triple).
Even though tourism has brought about development for Bali‟s economy for many years, the economic impacts of tourism development have not been
fully beneficial for the Balinese community (Dewi, 2009; Dermawan cited in Wiranatha, 2001). This may be due to several reasons, such as unequal income distribution and unbalanced economic distribution. The income distribution in Bali tends to be unequal, with the downturn of the agricultural sector, which still employs a significant proportion of the labour force (Dermawan, 1999 cited in Wiranatha, 2001). This can be illustrated by the income distribution indicator known as the “Gini Coefficient”. The Gini coefficient is a measure of the inequality of a distribution. It is defined as a ratio with values between 0 and 1. Zero corresponds to perfect income equality (i.e. everyone has the same income) and 1 corresponds to perfect income inequality (i.e. one person has all the income, while everyone else has zero income). The larger the Gini coefficient, the greater the inequality of income distribution between low, middle and high income earners. The Gini coefficient for Bali has increased from 0.29 in 1997 to 0.40 in 2012 (Bali Central Bureau of Statistics, 2013). It shows that income distribution has been getting more unbalanced over these 15 years (see Figure 1.5). Therefore, the elimination of inequality in income distribution is likely to become one of the top priorities of Bali‟s economic development.
seems to be most beneficial to the investors and their small number of employees, as most tourists‟ expenditure is on accommodation, food and beverages, and tourism transport. In these cases, the economic benefit from tourism is likely to go mainly outside Bali or to other countries, with a small proportion trickling down to the local Balinese community (Dermawan, 1999 cited in Wiranatha, 2001). It can be seen from the Rest of the World account of Bali Province in 2010, that it was about 879.74 billion rupiah in deficit (Bali Central Bureau of Statistics, 2011).
This unbalanced economic distribution as shown by the Gini coefficient of 0.41 in 2012 (refer to Figure 1.5) means that the goal of sustainable tourism development has not been achieved as the economic benefits of tourism have not been received by the host community fairly. As leakage is one factor causing unbalanced economic distribution of tourism benefits to the local community, there is a need to ascertain the current amount of leakage occurring in Bali‟s tourism.
A study by Rodenburg (1980) is the only reference about import leakage from tourism in Bali. The import leakage was estimated to be about 40% for international standard hotels, and 20% for small economy standard hotels. The import leakage from international standard hotels was estimated from the Nusa Dua Project in 1977, but that from small economy standard hotels was estimated using assumption. There has not yet been any research about tourism leakage in the tourist accommodation sector that has used a combination analysis of micro (industrial) level and macro (regional) level. The focus of the analysis in this
research was on the accommodation sector because the highest percentage of expenditure by foreign tourists in Bali is on accommodation, i.e. 40.5% (Bali Government Tourism Office, 2011).
Regarding the above issues, there is a need to undertake a study to widely improve knowledge related to research approaches, concepts and research methods in tourism leakage both at macro (provincial) level and micro (industrial) level, especially with regard to the accommodation sector. The study at the industrial level (accommodation sector) also needs to be supported by an analysis of the perceptions of hotel owners/management in order to ascertain their points of view on how to minimize the leakages. The results of this research are expected to be useful by leading to better understanding, awareness, and responsibility and gaining positive responses from government and stakeholders that can improve the economic impacts of tourism in order to achieve sustainable tourism in Bali.
1.2 Problem Formulation
Based on the issues of the economic benefits of tourism to Bali‟s economy as outlined above, the following research problems can be formulated related to the leakage of Bali‟s tourism revenue at macro and micro levels.
1) What is the amount of tourism leakage from Bali‟s accommodation sector at the micro (industrial) level?
2) What is the amount of tourism leakage from Bali‟s accommodation sector at the macro (provincial) level?
3) What are the impacts of government subsidies and import reduction by the accommodation sector on tourism leakage, job opportunities and income distribution?
4) What are the perceptions and preferences of foreign tourists regarding imported and local products, and how willing are they to spend their money to benefit the Balinese people?
5) What are the points of view of hotel managers related to imported and local products, and how willing are they to reduce the use of imported products and give priority to local products?
6) What efforts could be made to minimize tourism leakage from the accommodation sector in Bali?
1.3 Research Objectives
The general objective of this study is to evaluate tourism leakage from Bali at micro and macro levels in order to develop general recommendations to produce a theoretical concept and an applicable framework that can be used to ascertain the real impact of tourism on the economy of Bali. The measurement of leakage at the micro level is undertaken to describe leakage from the accommodation sector (industrial level), while the measurement of leakage at the macro level is undertaken to explain leakage from the accommodation sector at the regional (provincial) level. Specifically the objectives of the study are:
1) To calculate the amount of tourism leakage from the accommodation sector in Bali at micro (industrial) level.
2) To calculate the amount of tourism leakage from the accommodation sector in Bali at macro (provincial) level.
3) To evaluate the impacts of government subsidies and import reduction by the accommodation sector on tourism leakage, job opportunities and income distribution.
4) To evaluate the perceptions and preferences of foreign tourists on imported and local products as well as the willingness of foreign tourists to spend their money to benefit the Balinese people.
5) To evaluate the points of view of hotel managers related to imported and local products as well as their willingness to reduce the use of imported products and give priority to local products.
6) To develop a strategy to minimize tourism leakage in the accommodation sector in Bali.
1.4 Research Benefits
This research is beneficial in terms of both theory and practice. Theoretically, it improves knowledge related to research approaches, concepts and methods of estimating tourism leakage especially in the accommodation sector. Practically, the research results can be used by policy makers in order to formulate regional policy and generate strategies, as well as to control the expansion of the tourism industry in order to improve regional economic development through increasing job opportunities, understanding and awareness of the causes of leakage and minimizing tourism leakage through a systems approach in order to improve the economic benefits to the Balinese community.
18
2.1 Introduction
Chapter II focuses on a review of the literature regarding the objectives of this research. It begins with a discussion of the national income in an open economy, explaining the importance of export and import in generating national income. It then discusses how the Social Accounting Matrix (SAM) can be applied to calculate tourism leakage. The next section explains the importance of systems theory in developing strategies from different perspectives in order to minimize tourism leakage. This is followed by a discussion of multiplier effects, whereby money spent by tourists in Bali generates incomes through several ―rounds‖. Previous studies related to leakage in tourism are then reviewed to explain the ways in which the development of tourism creates both positive and negative impacts. The positive impacts result in increasing income and job opportunity in a tourist destination. However, these positive impacts are hampered by weaknesses such as tourism leakage. This leads on to a discussion of efforts at minimizing tourism leakage described in previous studies. These are reviewed as a source of information for generating strategy. Lastly, previous studies of various groups‘ perceptions and preferences in relation to tourism leakage are reviewed, followed by a discussion of ways of minimizing leakages so as to optimize tourism benefits. This chapter ends with a brief conclusion.
2.2 National Income in an Open Economy
There are two types of economy, namely an open economy and a closed economy. According to Krugman & Obstfeld (2006) and Lane (1999) an open economy is an economy that has interactions in trade or finance with other countries; meanwhile, a closed economy is an economy that has no interactions in trade or finance with other countries. In a closed economy there is no export or import. Hence, domestic investment must equalize domestic saving at all times. In an open economy, on the other hand, domestic investment can be greater or less than national saving. The difference between saving and domestic investment determines the current account imbalance for an open economy, with a current account surplus indicating that some national saving is being invested abroad, while a deficit implies net capital inflows from abroad which are financing domestic investment.
Gross National Product (GNP) is defined as the value of all final goods and services produced by a nation‘s factors of production in a given time period. It represents the total net value of all goods and services produced within a nation over a specified period of time, representing the sum of wages, profits, rents, interest, and pension payments to residents of the nation (Krugman & Obstfeld, 2006; and Lane, 1999). National income decomposition in a closed economy is expressed as:
Y = C + I + G
while national income decomposition in an open economy is expressed as: Y = C + I + G + X - M
where: Y = National income C = Consumption I = Investment G = Government expenditure X = Export M = Import
X-M = net export (export minus import). This identity can be rewritten as:
Y – T = C + I + G – T + X – M where:
T = Tax
Y – T – C + T – G = I + X – M
Sp Sg
Krugman & Obstfeld (2006) state that: letting Y – T – C = Sp, and
T – G = Sg,
this equation can be rewritten as (Sp + Sg) = I + X – M (Sp + Sg) – I = X – M
Since total saving for this economy is S = Sp + Sg, thus: S – I = X – M, or
S + M = I + X where:
Sp is private saving, and Sg is government saving
According to Krugman & Obstfeld (2006), an economy‘s current account is defined as the ―difference between exports and imports of goods and services‖ Hence, the current account is:
Krugman & Obstfeld (2006) and Lane (1999) stipulate that the requirement for balance in an open economy is that:
the value of (S+M) is equal to (I+X). Thus: S + M = I + X
It can be seen from the above explanation that the two variables, namely import (M) and export (X), are really important in generating national income and trade balance in a country (Krugman & Obstfeld, 2006 and Lane, 1999). This means that cross-country differences in export and import affect the real per capita income levels. It also means that an increase in export results in an increase in national income, while an increase in import brings about a decrease in national income. Krugman & Obstfeld (2006), Lane (1999) and Zhang (2004) said that when a country‘s import exceeds its export (I>E), this means that country has a ―deficit‖ current account. Meanwhile, a country‘s current account is in ―surplus‖ when the value of its exports exceeds that of its imports (E>I).
Regarding tourism, export is generated from payments made by foreign tourists for using accommodation and restaurant services and buying handicrafts, etc. However, if most of these are imported products, foreign services and include the use of foreign employees in tourism, this situation means there is actually an increase in import, which can lead to a decrease in national income. The development of tourism is therefore hampered by a high percentage of tourism leakage generated from the use of imported products, services and the use of foreign employees in operating hotels (Krugman & Obstfeld, 2006; Lane, 1999 and Zhang, 2004).
2.3 The SAM as an Accounting System and Conceptual Framework According to Thorbecke (1988), the genesis of the Social Accounting Matrix (SAM) goes back to Richard Stones‘ pioneering work on social accounts. Subsequently Pyatt and Thorbecke (1976) cited in Thorbecke (1988) formalized the SAM and showed how it could be used as a conceptual and modular framework for policy and planning purposes. As a data framework, the SAM is a comprehensive and disaggregated picture of the socioeconomic system during a given year. It provides a classification and organizational scheme for the data useful for analysts and policymakers. A SAM is a comprehensive accounting framework that shows the circular flow of income in an economy and captures the transactions between a number of variables. A SAM represents all of the transactions between different factors of production, institutions (households, companies and government), and production activities within an economy with respect to the rest of the world (Thorbecke, 1988). As a single entry accounting system, a SAM is represented in the form of a square matrix with rows and columns, in which each account has its own row and column. Receipts (revenues) are recorded in rows and payments (expenditures) are listed in columns. The sum of all expenditures by a given account (or subaccount) must be equal to the total sum of receipts or income for the corresponding account. In another words, the row sums must be equal to the column sums of the corresponding account (Thorbecke, 1988; Thorbecke, 2000).
A SAM can be regarded as an extension of input-output (I-O) tables (Thorbecke, 1988), a widely used framework to provide detailed information on
the flow of goods and services, as well as on the structure of production costs. In this matrix, final consumption expenditure, capital formation and trade are shown by product or industry of origin, and intermediate consumption both by product or industry of origin and destination. Income generation is shown by the value added (Huseyin, 1996; Keuning et. al., 2010, Thorbecke, 1988; Thorbecke, 2000). The factors of production included in the SAM are male and female labour, and capital, including mixed-income of the self-employed. Furthermore, institutions consist of households, companies, and government. The data for a SAM come from input-output tables, national income statistics, and household income and expenditure statistics and other related sources of data. Therefore, a SAM is broader than an input-output table and typical national account, showing more detail about all kinds of transactions within an economy (Thorbecke, 1988). Thorbecke (2000) has drawn up a basic SAM for six distinct accounts (see Appendix 2.1). It can be seen that it incorporates all the major transactions within a socio-economic system. Meanwhile, Figure 2.1 reproduces all of the transformations appearing in Appendix 2.1 interpreted more broadly as representing flows (over time) which have to be explained by structural or behavioral relationships (Thorbecke, 2000).
Figure 2.1.
Flow Diagram of Social Accounting Matrix Transactions (Source: Thorbecke, 1988: 81)
In the basic SAM in Appendix 2.1, six accounts are distinguished. Production activities produce different goods by buying raw materials and intermediate goods and services (row 1 column 5). In addition, these accounts pay indirect taxes to the government (row 3 column 5) and the remainder is, by definition, value added that is distributed to the factors of production (row 5 column 5).
Production activities receipts (row 5) derive from sales to households (row 5 column 2a), exports (row 5 column 6) and the government (row 5 column 3).
In the present formulation of the SAM no distinction is made between production activities and commodities. It is assumed that a production activity is equivalent to a corresponding commodity. In some instances, the SAM format distinguishes between production activities and commodity accounts. This would be the case when a given production activity produces different commodities, so that these two sets of accounts would require different sectoral breakdowns. For this reason, many SAMs include both production activities and commodities accounts. When commodity accounts appear in a SAM they can best be seen as representing a region‘s or nation‘s product markets. They receive income (recorded in row 1 column Total) from the sale of their services to production activities (row 1 column 5) in the form of wages, rent and net factor income received from abroad (row column 6) or from other regions (corresponding to the value added generated by the production activities). In turn, these revenues are distributed (column 1) to households as labor incomes (row 2a column 2a) and to companies as distributed profits (row 2a column 2b). Institutions include households, companies and the government. From row 2a, it can be seen that households receive factor income (wages and other labor income, rent, interest and profits) (row 2a column 2a), income from companies (row 2a column 2b) as well as transfers from government (row 2a column 3) and from the rest of the nation and world (e.g. remittances) (row2a column 6).
Households‘ expenditures (in column 2a) consist of consumption of goods from the local region (row 5 column 2a), from other regions and from abroad (row 6 column 2a), and income taxes, with residual savings transferred to the capital
account (row 3 column 2a). Companies (2b) receive profits and transfers from domestic companies (row 2b column 3) and spend on taxes and transfers, with their residual savings channeled into their capital account (row 4 column 2b).
The government account (3) is distinct from administrative public activities included in the production activities account. These public services (such as education) buy intermediate goods, pay wages and deliver public and administrative services. The government account allocates its current expenditures on buying the services provided by the production activities account (row 5 column 3). Other government expenditures (column 3) are transfers and subsidies to households (row 2a column 3) and companies (row 2b column 3) and the remaining savings are transferred to the capital account (row 4 column 3). On the income side, the government receives tax revenues from a variety of sources and current transfers from abroad (row 3).
The fifth account is the combined capital account. On the income side (row 4) it collects savings from households, companies, the government as well as foreign savings and, in turn, channels these aggregate savings into investment (column 4). Finally, transactions between domestic residents, and foreign residents, respectively, are recorded in the Rest of the World Accounts (column 6). These transactions include, on the receipt side, households‘ consumption expenditures on imported final goods (row 6 column 5) as well as imports of capital goods and raw materials (row 6 column 4). The economy receives income from the rest of the world (column 6) from exports, and factor and nonfactor income earnings. The difference between total foreign exchange receipts and