HAL Id: hal-02161943
https://hal.archives-ouvertes.fr/hal-02161943
Submitted on 21 Jun 2019
HAL is a multi-disciplinary open access
archive for the deposit and dissemination of
sci-entific research documents, whether they are
pub-lished or not. The documents may come from
teaching and research institutions in France or
abroad, or from public or private research centers.
L’archive ouverte pluridisciplinaire HAL, est
destinée au dépôt et à la diffusion de documents
scientifiques de niveau recherche, publiés ou non,
émanant des établissements d’enseignement et de
recherche français ou étrangers, des laboratoires
publics ou privés.
ThemExplorer: finding and browsing geo-referenced
images
Adrian Popescu, Pierre-Alain Moellic, Ioannis Kanellos
To cite this version:
Adrian Popescu, Pierre-Alain Moellic, Ioannis Kanellos. ThemExplorer: finding and browsing
geo-referenced images. CBMI 2008 : International Workshop on Content-Based Multimedia Indexing, Jun
2019, London, United Kingdom. pp.576 - 853, �10.1109/CBMI.2008.4564999�. �hal-02161943�
THEMEXPLORER: FINDING AND BROWSING GEO-REFERENCED IMAGES
Adrian Popescu*, Pierre-Alain Moëllic*, Ioannis Kanellos
+* CEA LIST, LIC2M (France),
+Telecom-Bretagne, Computer Science Department (France)
ABSTRACT
Among the useful information that make browsing or finding pictures on the Web easier, geographic data take advantages from the growing amount of geo-referenced image collections and recent map-based interfaces (Google Map and Earth, Yahoo! Map, etc.). Most large scale systems for visualizing geographic entities are weakly structured (unless for commercial entities), with inhomogeneous coverage; they also make little or no use of image processing techniques in search and retrieval. In this paper, we tackle with these problems by introducing a enriched and adapted version of a geographical database and content-based facility in a new map-based visualization tool, called ThemExplorer. We present the system and evaluate different dimensions, proving its usefulness for browsing geo-referenced images. In section 1 we set up the global argument; in section 2, we discuss related work; section 3 includes an architectural overview of ThemExplorer; in Section 4, we present the contribution of our geographical database using heterogeneous sources on the Web; in section 5, we detail the CBIR techniques associated to ThemExplorer. Before concluding and presenting some future works, we describe a series of evaluation in section 6.
1. INTRODUCTION
Using metadata associated with digital images is known to improve the way users interact with large scale photographic collections [16]. In particular, geographic information associated to pictures enables the location of the data on a map and propose an imaged description of the world. New online applications propose the visualization of geographic entities using geo-referenced photos.
Most noticeably, Flickr proposes a map-based navigation1 of their
geo-referenced data and Google Earth mixes Panoramio [18] images. In both interfaces, the user can navigate on the maps and click spots that correspond to a place where pictures were taken. In [1] tags representing a region are displayed and, once a tag is selected, corresponding pictures are displayed as a result. This type of interface is more informative and improves navigation over Flickr and Google in which the interaction with the map information is usually limited to the presentation of pictures (or tags) from the region. ThemExplorer proposes further enriched user interaction without any supplementary burden on the user. As in [1], we employ TagMaps [26], the tag visualization Web-service proposed by Yahoo! as the underlying Web-service to present geographic names to the users. In our application, the geographical database is partially adapted from Geonames, a freely-available geographical database and partially extracted from heterogeneous information sources on the Web. The enrichment of the
1
http://flickr.com/map
geographical database is particularly important for regions that are not well represented in Geonames. The obtained structure enables a topical browsing of geo-referenced pictures that is not included – to our knowledge – in any other geographic image visualization tool. The pictures associated to locations are themselves collected using Flickr and Google Image.
We include a content-based image retrieval (CBIR) functionality in ThemExplorer. The CBIR limited to photos representing the same geographic name in the database and is especially useful for popular tags having a lot of associated pictures, allowing a quick in-depth exploration of the answers set.
2. RELATED WORK
Flickr and Google Earth propose map-based visualization tools that place pictures on a map using the geographical coordinates of the geo-referenced pictures. The textual information guiding the search is limited to the one on the map and the user interaction is reduced to clicking individual photos in order to have a detailed view. Panoramio [18] presents image snippets on a map and a set of images near the map. An important particularity of the platform is that any submitted picture has to be validated as representative by a different user, increasing the chances for the images to be relevant.
The system that is the closest to ours is World Explorer, described in [1] and concerns the visualization of tags on a map and of corresponding pictures in the interface. The authors introduce a generative method for identifying locations based on unstructured data from Flickr. A multi-scale analysis is performed in order to find the most representative tags at each level on the map. One advantage of the approach is that the number of presented tags is not limited a priori and, with the growth of the unstructured textual database, it is possible to mine and prompt more and more information. An evaluation of the dataset used in [1], included in [21], shows that the identification of locations is correct in 82% of the cases (when half of the candidates are retained). The use of a dictionary constitutes a simple way to eliminate irrelevant tags for the geographic domain, but this method is not employed in [1]. The main difference between World Explorer and ThemExplorer is that, in our system, the database is structured. Consequently the navigation model and the interaction process are different in the two applications.
The development of large-scale geographical thesauri received considerable attention in the Geographical Information Systems community. The Alexandria gazetteer [8] contains more than 4 millions entries, grouped into several general categories (like landforms, manmade, hydrographical forms etc.), that are further divided into finer levels (like mountains, buildings or streams). Geonames [7] is another geographical thesaurus, containing more than 6 millions entries. One of the main problems with existing
databases is that their coverage is highly variable. For example, in Geonames, the USA are represented by over 1.8 million instances, while Serbia and Montenegro have only 6 associated entries. A possible way to overcome this variability is to try to automatically enrich the database. Recently, Auer el al. [2] introduced DBPedia, an interesting encoding of Wikipedia pages in database format. This structure contains over 70,000 geo-referenced entries, which can be used for mining detailed information about geographical entities. The processing of geographic information in this database is minimal since it does not classify the geographic names into higher-level classes.
The inclusion of geographical thesauri in image visualization frameworks is mentioned in [15] but it is left for future work. One important limitation over automatically-built database concerns their coverage, which determines the extent of information it is possible to display, whereas the volume of information extracted using a generative method like the one employed in [21] depends only on the constantly growing volume of data in Flickr.
A lot of research effort in the image retrieval community was directed toward the development of CBIR techniques. In spite of an impressive number of publications addressing the problem (see [27], [12]), these techniques are not exploited in large scale applications, like Web image search engines. Cortina [19], with 11 millions processed images, is the largest existing CBIR application. The reticence in including query-by-example in Web image search engines can be explained by the semantic gap [12] that emerges from a human’s point of view when we have to deal with poor results, especially for large datasets [20]. Equally important, content processing introduces an important burden in image retrieval applications when targeting large volumes of data. O'Hare et al. [17] assess the use of CBIR techniques for geo-referenced pictures. Several image descriptors are first employed alone, then combined with a restriction of the search space based on spatial proximity as well. This last setting performs best, but the results are not drastically improved compared to classical CBIR. Note that no textual information attached to pictures is exploited in [17]. Liu [12] reviews over 100 research papers approaching different ways to improve CBIR by adding semantic information, but this topic is still a hot one. An effective way to improve visual retrieval is to introduce it as a complement of text-based image retrieval and limit the search space based on prior textual information introduced by the user like in [25] or [20]. Indeed, in [20], a multi-level limitation of the search space is proposed and the most specific level ensures both visual and conceptual coherence. In this paper, we apply the restriction of the search space to specific geographic entities like Mont Blanc or Eiffel
Tower.
[22] discusses the result of a log file study, showing that geographic query represent a hefty chunk of the users of information search engines. Moreover, the geographical domain seems to include the largest share of repeated queries.
3. GLOBAL SYSTEM DESCRIPTION 3.1. System Architecture
In figure 1 we give a general view of the architecture of
ThemExplorer. A video demo of the system is available2.
2
http://www.vimeo.com/441282
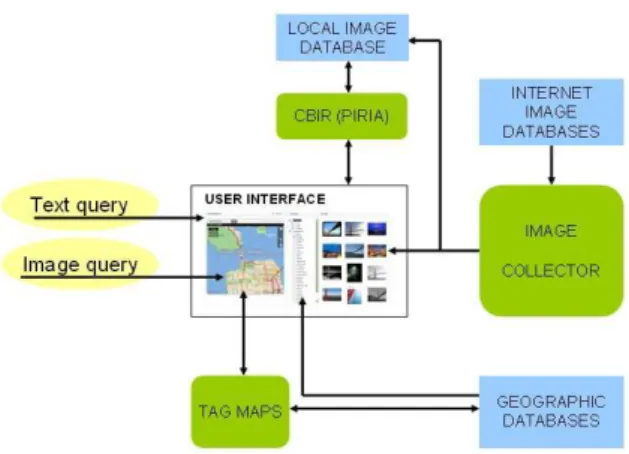
Figure 1. Architecture of ThemExplorer.
When the user asks for geographic names in a particular region, TagMaps is called and queries the geographical database so as to obtain the tags. When the user selects a displayed name, the system checks if this is a first selection; if so, the associated pictures are immediately presented; otherwise, the photos are searched on the Internet, firstly by using Flickr and, secondly, if the number of the collected images is not enough, by using Google Image. When the user launches the CBIR facility, a content-based search engine (called PIRIA [10]) is employed. The locally stored pictures are visually indexed and the closest answers to the image query are computed and displayed.
3.2. The user interface
The user interface (Figure 2) aggregates the different elements of ThemExplorer. It is implemented in PHP for dynamically generating the content of the page and Javascript for the TagMaps linking. The interface is made up of three main components:
• a map obtained from TagMaps displaying the most
representative geographic names in a region
• a series of geographic categories (from Geonames) enabling a
selection of one or more topics of interest
• an image display area where the user can launch the
content-based facility
Figure 2. ThemExplorer interface
3.3. Interaction Process
The interaction is determined by two types of restriction: a thematic restriction obtained using conceptual inheritance and a
spatial restriction, provided by the multi-scale map visualization tool.
The selection of one or more themes of interest is performed by browsing a categorical tree containing two levels of detail. At the most general level, the user can select one general “geographic” category, like Artifacts or Nature. A finer grained selection is proposed at the second level: the user can choose one or more subclasses like Bridge, Church or Museum. The map enables the selection of a region of interest, either by typing a location name or by using a zooming tool. The items displayed on the map can be selected to make appear associated photos. If the user picks a particular image, this picture becomes an example query and a content-based retrieval among the photos associated to the same tag is launched. We constrain the content based search because the results of this type of query are poor for large and heterogeneous image collections like those in Flickr and Google Image.
4. GEOGRAPHIC ENTITIES EXTRACTION
In this section we first describe the different resources we used to build a large-scale and robust geographic database. Then we explain how we enrich the available data to build our database. We add an Entity-Rank information that captures the relative importance of each tag in the database. This last dimension is fundamental in retrieval applications because it compels the system to present the most relevant entities in priority.
4.1. Formalism
To describe a geographic entity we use the following tuple defined in [8]: (Entity-Name, Entity-Coordinates, Entity-Type), where the
Entity-Coordinates is the longitude and latitude coordinate of an
entity and the Entity-Type is the category of the entity according to the ones defined in Geonames.
4.2. Data Sources
4.2.1 Geonames
Geonames is a freely-available geographical database with about six millions of entities. Each instance in Geonames (e.g. Mont
Blanc) belongs to an intermediary geographic class (e.g. mountain)
which, in its turn, is attributed to a more general category. With such a structure, a topical browsing is possible.
4.2.2 Wikipedia
The well known online encyclopedia contains much gazetteer-type information. There are around 100,000 geo-referenced articles in the English version of Wikipedia [7], a volume which remains significantly smaller than the 6 millions entries already present in Geonames. We can exploit the structure in new geo-referenced articles and extract the Entity-Name (in the page title), alternate variants of the entity name (in the header, and in foreign language page pointers), as well as explicit geographic Entity-Coordinates. Entity-Type can often be extracted from the first sentence of the article [8]. There is no guarantee, however, that all three components of our minimal tuple will be found for each item.
4.2.3 Panoramio
Panoramio is a website for sharing geo-referenced pictures. The validation of photo locations by other users constitutes a useful particularity of this platform. Data introduced by the users are available via an API which returns the title and localization of the
images and a link towards the image itself. We can also exploit frequency information to extract an indication of the popularity or importance of the entity (see section 4.3.2).
4.3. Geographic data enrichment
Geonames includes a very large amount of data but with an inhomogeneous coverage (see Section 2 for an example) and, given the required amount of work implied by the manual enrichment of a large scale database, the automation of the process is appealing. We briefly describe a procedure for automatically enriching Geonames based on the aggregation of heterogeneous information on the Web.
4.3.1 Entity extraction
First, we extend the Geonames domain model which possesses over 600 intermediate geographic concepts for tagging an Entity-type. However, a preliminary study of Wikipedia articles convinced us that this vocabulary was not comprehensive enough. We thus added around 20 new concepts for the geographic domain (e.g. Borough, Neighborhood), as well as some concepts frequently having a strong spatial connotation, such Club, Team or
Laboratory which are often given with geographic coordinates in
Wikipedia.
We populate the database by extracting everything we can consider as a localizable entity (Entity-Name) from Wikipedia and from Panoramio. From a downloaded copy of Wikipedia, we begin by extracting all articles which contain geographic coordinates. Following [11], we retain this article if its first sentence contains a geographic concept (after the verb ‘to be’), for example, “…is a large residential neighborhood”. For these names, we have the three minimal elements: the Entity-Name, the Entity-Type, and the
Entity-Coordinates. We use these articles to build a second list of
other candidates from Wikipedia. From these articles, we extract all new linked proper names (identified by uppercase Wikipedia links) and access their articles. We retain these names as candidates if the article’s first sentence contains a geographic concept, as described above. These candidates have an Entity-Name, an Entity-Type, but no Entity-Coordinates, yet. To find other geographical names, we use Panoramio in this way: we download photos and analyze their titles. The candidates list includes chains that explicitly contain an element from the geographic vocabulary (i.e. Versailles Castle, Liberty Square). These candidates have an Entity-Name, a potential Entity-Type, and Entity-Coordinates.
If missing, we try to assign an Entity-Type and Entity-Coordinate to a candidate geographical entity. A naïve way to categorize geographic entities is to use the category appearing in the name itself. This method, however, fails to correctly categorize instances like the Madison Square Garden in New York or the Palace of Fine Arts in San Francisco, which are not a garden and a palace, but rather a venue and a museum. As shown above, for candidates from Wikipedia, we use the first sentence in the article to determine Entity-Type. For Panoramio candidates, we launch a query with the candidate name in a search engine and analyze the returned snippets. This technique is similar to approaches used in question answering [3]. The default parent concept of a candidate geographic name is the one appearing in its name. If this candidate is associated more frequently with another geographic concept in the snippets associated to the candidate name, we launch definitional (“candidate IS A concept“) on the Web and retain as
the final parent concept for the candidate name the one appearing more often in the definitional query.
For Wikipedia candidate names not having coordinates, we could use the coordinates of the geo-referenced articles they came from, but these are too imprecise. Instead, we search the names in Panoramio and calculate the average coordinates of the photos whose title contains the analyzed name. The same localization technique is applied to candidate names drawn from Panoramio titles. This simple method produces an approximate localization of the geographic name that, as shown below in the Evaluation section, is satisfying.
4.3.2 Entity ranking
As we mentioned, we extended the minimal definition of a geographical gazetteer [8] by adding an Entity-Rank. The ranking increases the usefulness of the geographic gazetteer in information retrieval. We produce a ranking by aggregating information found in Panoramio and a search engine. While the first is well adapted to the geographic domain, its coverage is significantly reduced when compared to that of a search engine, such as Alltheweb, which provides better coverage but lower accuracy.
When using Panoramio for ranking items, we take all the photos around the candidate coordinates (within a distance of 30 kilometers), and search these photos using the candidate Entity-Name. We then combine the total number of retrieved Panoramio images (a classical term frequency measure) with the number of different users (a community-based relevance assessment) having uploaded those images. We can reasonably suppose that, if a geographic object was photographed by several people, it is more representative than an object photographed by one person only, and should thus be ranked higher. The Panoramio based relevance measure is generally accurate but can return the same rank for different items. To differentiate these elements, we use Alltheweb counts for the candidate geographic name.
5. CBIR SYSTEM 5.1. Color and texture-based global descriptors
We used the Local Edge Pattern (LEP) [4] a texture-based descriptor. The LEP descriptor is based on the edge map of the image computed with Sobel filtering. A threshold is applied to quantify the pixel in an “edge” class (1) or “non-edge class” (0). Then, a binomial kernel ({1, 2, 4},{8, 256, 16},{32, 64, 128}) is applied on the binary image to label each 3x3 micro-texture pattern with a unique value in [0,512]. Two 256-bins histograms could be computed: the first one for the non-edge pixels corresponding to patterns with label in [0,255] and the second one for the edge pixels (values in [256, 512]).
We quantified the RGB color space in 4 classes for each channel and added a 64-bins color histogram to the two previous
texture-based histograms to form the global descriptor hg. The similarity
between two pictures is computed with the classical Euclidean distance.
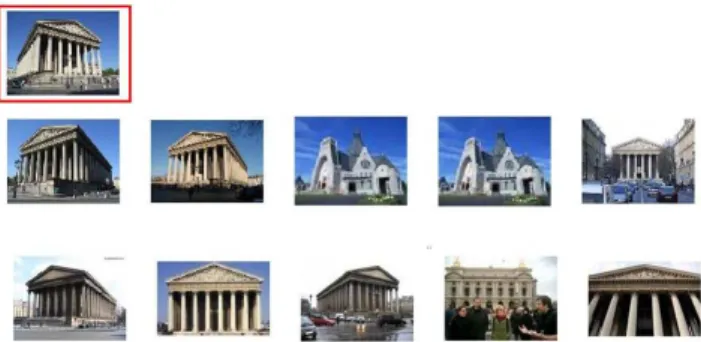
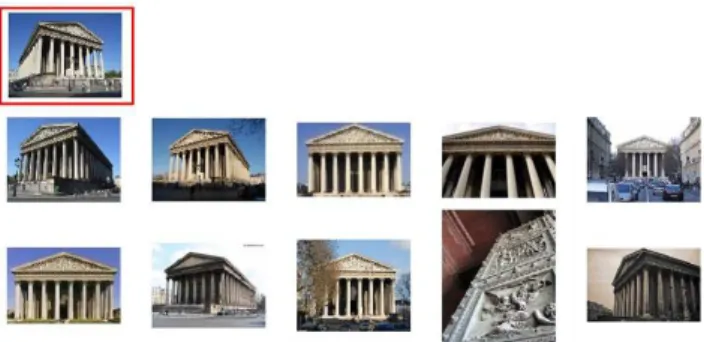
Figure 3. The 10 best result for the global color and texture-based descriptor. At the top-left, the query image.
5.2. Bag of features descriptor
The adaptation of the “bag of words”, a popular method in natural language processing, to the “bag of visual words” or “bag of features” [6] for images endows the image processing community with new and powerful methods to build robust description of images. [23], [24] proposed very interesting analysis and uses of this method for content-based image retrieval, objects or scenes classification purposes. We use a bag of features approach in CBIR [9]. This descriptor captures local properties of represented objects and complements traditional approaches to image indexing, which provide a global characterization of the content. As shown by the evaluation in section 6, the combination of the two types of descriptors improves the performances the CBIR
The basic idea of the bag of features is to produce a visual vocabulary built after an unsupervised quantification of a set of patches extracted from images and described with classical features such as the SIFT descriptor [13]. The extraction of the patches can be realized using a random or homogeneous selection of the pixels or using interest points detectors (Harris Laplace, Gaussian based detectors, …). Usually, the amount of patches is important and the clustering process can rapidly become a real issue. The K-Means algorithm (or some “enhanced” derivates) is generally applied several times with different initializations to reach or tend to reach an optimal partition. After this quantification step, we have at our disposal a codebook or vocabulary composed of “visual words” enabling to represent an image with the histogram of the occurrence of each “visual word” of this vocabulary.
5.2.1. Visual vocabulary
We computed a visual vocabulary considering a selection of Flickr pictures that stand for different geographic categories in Geonames. We analyzed about 5000 images and extracted a maximum of 1000 Harris-Laplace keypoints per image described by the rotation and scale invariant SIFT descriptors [13]. Then, we computed a 5000 size codebook with the K-Means algorithm. To overcome the initialization dependency of the K-Means algorithm we computed ten K-Means with random initializations and retained the best result defined as the partition with the optimal intra-clustered distance. Hörster and al. [9] propose a different method based on the merging on multiple K-Means results computed on different subsets of a large-scale collection. In our case, using comfortable calculus capacities and a parallel
implementation of the K-Means3 we could afford to apply the
Means on the whole dataset. We designate our codebook by W and
note each of its visual word by wi.
5.2.2. Indexing process
An image is characterized according to W with a 5000-bins
histogram b
i
h . We extract up to 1000 keypoints with the
Harris-Laplace detector and match each point with its nearest wi from W.
Then, each bin of b
i
h can be seen as the frequency of the visual
word wi in the image. As in text mining, we compute the similarity
between two images Ii and Ij described by the bag of features
descriptor
h
ibandh
bjusing the Cosine distance:b j b i b j b i j i h h h h I I d . . ) , ( =
Figure 4. The 10 best result for the bag of features descriptor. The query image is the same as in figure 3.
6. RESULTS AND EVALUATION 6.1. Enrichment of the database
We decided to evaluate our geographical database against an automatically created database (TagMaps) and a manually built thesaurus (Geonames). To do this, we first arbitrarily chose 15 cities from different countries selected to provide a variable quality of the representation in TagMaps and Geonames: Athens, Beijing, Bucharest, Kiev, London, Moscow, Paris, Pittsburgh, San Francisco, Singapore, Sydney, Timisoara, Tokyo, Toulouse and Tunis. For these cities, we ran our geographical candidate selection algorithms, and generated 6000 entities, of which the 20% whose Entity Names appeared 15 times or less on the Web were eliminated because of their low frequency of appearance on the Web.
6.1.1. Instance Extraction and coverage
We evaluated the correctness of the geographic names extraction process for 424 elements generated for our database. For each of the 15 cities, a maximum of 30 randomly extracted items were tested (some cities like Toulouse or Tunis had less than 30 elements discovered). These elements come from both Wikipedia and Panoramio. In the evaluation procedure, we considered as correct all exact matches of the extracted instances to the real names and incomplete matches which are commonly equivalent to their longer forms (i.e. Louvre instead of Louvre Museum).
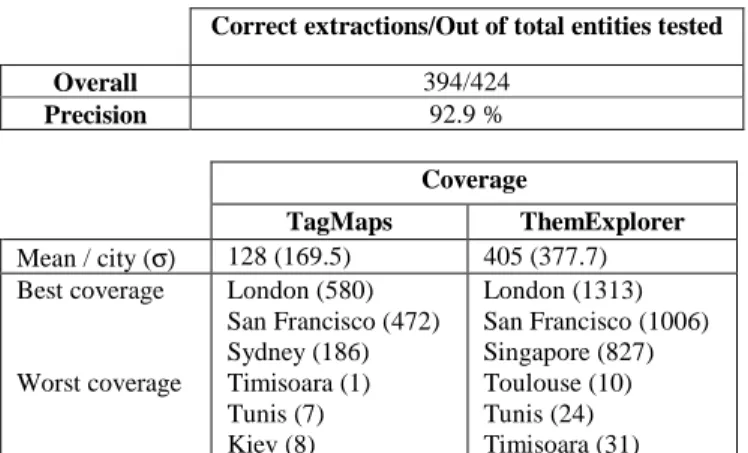
Correct extractions/Out of total entities tested Overall 394/424 Precision 92.9 % Coverage TagMaps ThemExplorer Mean / city (σ) 128 (169.5) 405 (377.7) Best coverage Worst coverage London (580) San Francisco (472) Sydney (186) Timisoara (1) Tunis (7) Kiev (8) London (1313) San Francisco (1006) Singapore (827) Toulouse (10) Tunis (24) Timisoara (31)
Table 1. Evaluation of the extraction process and coverage.
The results in Table 1 show that the extraction process is accurate in over 90% of the cases. Such a precision is to be compared to the 82% precision reported in [21] for TagMaps, the only large scale automatically built geographic database we know of. In the TagMaps case, the authors performed their evaluation after eliminating 50% of their location candidates, starting with the least frequent. Our thresholding of 15 or more web hits only eliminated 20% of our candidates before evaluation. The errors in our approach are due to some imperfections of our named entities extraction. For example, terms like Big House, were mined when using Panoramio and they are reported as errors in this test. We also counted as errors vague terms like Athens Theater, considering that this term covers several geographic objects and is not a geographic name.
The coverage outperforms that in TagMaps except for Toulouse area, for which the two methods discover a reduced number of results (10 against 18 in TagMaps). A remarkably high number of results is obtained for cities that are well represented in Wikipedia and in Panoramio. Somewhat surprisingly, although a major tourist destination, Paris does not appear among the best represented cities. The use of an English geographic vocabulary to extract candidates from Panoramio constitutes an explanation for this situation. The internationalization of the vocabulary will further enrich our process. Significant differences can be pinpointed for Kiev (145 location names against 7) or Timisoara (31 against 1).
6.1.2. Instance Categorization
Candidate categorization can be automatically evaluated using the intersection of our database and Geonames for the selected cities:
Wikipedia Panoramio Overall
Number of items 217 326 543
Errors 13 32 45
Precision 94% 90% 92%
Table 2. Evaluation of the classification process
The results in table 2 show a high rate of success of the overall categorization process. The results for the Wikipedia-based items are consistent with those reported in [11]; the precision is above 90%. The errors that appear are mainly caused by complicated definitions. For example, the verb to be is sometimes followed by a reference to the geographic situation rather than a direct reference to the instance type. In future work, we plan to add a syntactic analysis means to avoid this type of situation. In Panoramio, the
errors appear when the snippets based categorization fails to find the real parent class of a candidate.
6.1.3. Instance Localization
The intersection between Geonames and our database was equally employed so as to assess the distance between common items in both databases. We computed the distribution of the distance between the coordinates in our database and those in Geonames. The distances were quantified every 200 meters. A large majority of the coordinates are distant of no more than 1 kilometer compared to the corresponding manually supplied coordinates in Geonames:
- 60% of the distances are inferior to 200 meters
- 81% are inferior to 600 meters
- 92% are smaller than 1 kilometer
- The highest concentration of results is to be found in the first
sector of 200 meters around the Geonames coordinates. As for the differences that are superior to 1 kilometer, they usually appear for items having a large surface (gulf, river, borough or island, university, bay, beach or park). For these geographic objects, a displacement of the geographic coordinates with a distance of the order of 1 kilometer is comparable to their spatial dimensions and does not greatly affect the quality of the representation. A special case is that of rivers, which are objects with a disproportionate ratio between their length and width. One might correctly place their coordinates at any point along their course.
6.1.3. Instance Ranking
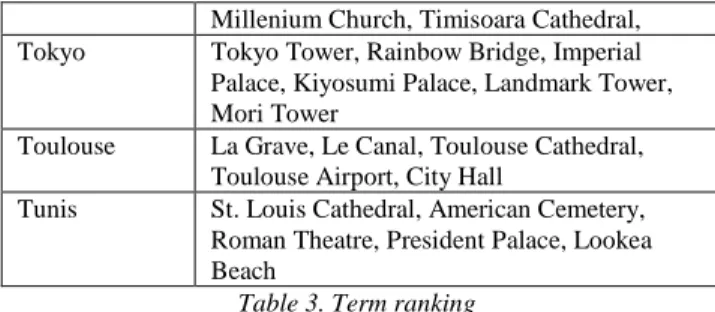
Our importance ranking of each geographic name was calculated using two reference corpus, Panoramio and Alltheweb, with a preference given to the results obtained using Panoramio. On the basis of these statistics, we present the top five “most salient” ranked results as for each city :
City Top 5 most salient results
Athens Acropolis, Parthenon, Plaka, Olympic
Stadium, Temple of Zeus
Beijing Summer Palace, Temple of Heaven,
Tiananmen Square, Lama Temple, Railway Station
Bucharest Intercontinental, Carol Park, Herestrau Park,
Parliament Palace, Stavropoleos
Kiev South Bridge, Trianon Palace, Rusanivka,
Paton's Bridge, Partizan's Victory Park
London London Eye, Tower Bridge, Trafalgar Square,
Buckingham Palace, Hyde Park
Moscow Red Square, Elk Island, Moscow River, St.
Basil's Cathedral, Historical Museum
Paris Louvre, Eiffel Tower, La Défense, Arc de
Triomphe, Montmartre
Pittsburgh PNC Park, Downtown Pittsburgh, Heinz
Field, Cathedral of Learning, Station Square
San Francisco Golden Gate Bridge, Coit Tower, Oakland,
San Francisco Bay, Lombard Street
Singapore Sentosa, Merlion, Raffles Hotel, Singapore
River, Boat Quay
Sydney Opera House, Harbour Bridge, Darling
Harbour, Bondi Beach, Sydney Tower
Timisoara Bega River, Iulius Mall, Unirii Square,
Millenium Church, Timisoara Cathedral,
Tokyo Tokyo Tower, Rainbow Bridge, Imperial
Palace, Kiyosumi Palace, Landmark Tower, Mori Tower
Toulouse La Grave, Le Canal, Toulouse Cathedral,
Toulouse Airport, City Hall
Tunis St. Louis Cathedral, American Cemetery,
Roman Theatre, President Palace, Lookea Beach
Table 3. Term ranking
The results in Table 4 indicate that the ranking procedure introduced in this paper generally succeeds in ranking what seems to be the most representative location names first for the analyzed cities. If we take the example of Paris, we might wonder why Notre Dame does not appear among the first results. The full name of the item in our database is Notre Dame de Paris and this reduces the chances for this item to be found frequently. The same observation stands for Alcatraz in San Francisco, which appears either as
Alcatraz Island or Alcatraz Prison. We are not sure how to
correctly identify the preferred short form of these names without introducing ambiguities into our automatic system.
The example of Timisoara, a city for which the number of Panoramio images is significantly smaller than that for Paris or San Francisco, for which all top ranked terms correspond to landmarks in the area, shows that the ranking method applies well both to well represented regions and to less known areas.
6.2. Content Based Image Retrieval
6.2.1 Restriction of the query space
The evaluation of content based image retrieval is not a trivial task because it involves the assessment of similarity between pictures as seen by each user. Previous studies [5], [20] show that the conceptual resemblance of images seems to dominate over their low level similarity (based on perceptual characteristics like color or texture). In ThemExplorer, we propose an interaction schema similar to that in [20], reducing first the region of the database employed in the CBIR query to a conceptually coherent set. Here we compare the restriction of the query space using localization information (situation 1: S1) and a similar restriction which, in addition, exploits the keywords attached to images (situation 2: S2). In the first situation the CBIR query is performed in image sets representing several entities in the same city, while in second situation, only pictures of the same object are considered. A CBIR process was launched for 20 representative pictures of the objects using S1 and S2 and the 10 closest images were selected. Both punctual entities like (Eiffel Tower or Sydney Opera House) and non-punctual ones (like the Central Park in New York or Bondi Beach in Sydney) were included in the test in order to cover different types of locations. We divided the dataset in two parts (10 objects in each dataset) and asked six information science students (note U1 to U6), with little or no experience in image retrieval, to evaluate the similarity between the example pictures and the answers provided by the CBIR answers.
Image similarity is a vague concept and we provided a situation meant to guide the students in their evaluation: they were asked to imagine that they must illustrate a location with a picture and that they found one that seems fitted for this purpose (the example image) but they know that there might be other related images in the database. The task consisted in selecting those answers
provided by PIRIA they considered as good substitutes for the query. The presented situation is general enough not to narrow the conclusions of the study to a particular domain and provides some guidance for grasping the notion of similarity. We evaluated the precision using S1 and S2 and present the results for the two sets of images in Table 4: Image set 1 U1 U2 U3 Avg Inter S1 0.27 0.26 0.36 0.29 0.2 S2 0.58 0.49 0.59 0.55 0.4 Image set 2 U4 U5 U6 Avg Inter S1 0.39 0.29 0.21 0.29 0.17 S2 0.60 0.36 0.43 0.47 0.26
Table 4. Precision of the CBIR when localization information is used to restrict the query (situation S1) and when keywords and
localization are employed (S2). The precision of the search process is presented individually (Ui), Avg is the average precision
over the users and Inter the intersected precision for all users.
As expected, the results point out that the precision of the CBIR using both keywords and localization information largely outperforms the corresponding results when restricting the query space using only localization information. The two types of restriction generate better results compared to a pure CBIR process and, in addition, reduce the complexity of the search process. The hypothesis we introduced are: if a user selects an image from a region (i.e. a city), she/he only wants to see images of that city (for S1) if she/he selects a picture of a precise object, she/he expects to see similar images depicting the same object (for S2).
6.2.2 Evaluation of the descriptors
We evaluate the performances of the two descriptors we described in section 5. The performance is measured using classical precision and recall metrics. For the test we pick 20 entities and chose one query-image for each one as for the previous evaluation of the influence of the restriction of the query space.
For each query image we gather three series of the ten most similar images return by the CBIR system. The first series corresponds to the global color and texture descriptors (see 5.1.). The second series is the result of the bag of features descriptor (see 5.2.) and the third one is a combining of both features based on a late fusion of the similarity scores. The distance provided using the two descriptors is normalized in [0,1], thus we simply add the similarity values to process the fusion. As for the previous evaluation, for each query and each series, we ask the six students to quote the answer as relevant or not.
Figure 5. The 10 best result after fusion. The query image is the same as in figure 3 and 4.
Because the precision represent a higher interest than the recall in the applications targeted by ThemExplorer we focus the evaluation on precision-based metric: the global precision over the list of the ten answers (P) and the Mean Average Precision (MAP) a classical and very popular metric that enables to consider the rank of the answer in the precision computing.
Global color+texture Bag of features Fusion
MAP 0.7473 0.7463 0.8075
P 0.5750 0.5983 0.6983
Table 5. Evaluation of the descriptors. MAP is the Mean Average Precision (MAP) and P the global precision
Table 5 shows that the performance of the global color and texture descriptor and the bag of features descriptor are close. The interesting information is provided by the gain in both precision and MAP when merging the descriptors through a basic late fusion of the scores. The descriptors are complementary since they focus on different characteristics and patterns providing different relevant answers. In future works, we will continue to experiment new descriptors and merging approaches to improve the CBIR facility in ThemExplorer.
7. CONCLUSIONS
We built a geographical database, extracting geographic information from heterogeneous information sources on the Web (Wikipedia, Panoramio, Alltheweb) and adding a ranking of the elements in the database. The hierarchical organization of Geonames was exploited in order to introduce a thematic navigation model for geographic image retrieval and we introduced an efficient aggregation of the keyword based search and of a content-based retrieval.
The first results of our system, ThemExplorer, encourage us to continue working in this direction. Our entity extraction approach is especially useful for countries where the representation in Geonames is not well detailed. The CBIR facility based on complementary descriptors enables to find and browse the images more efficiently.
As for future work, it would be interesting to adapt the retrieval and the results presentation processes to the type of the queried entity. For example, if a user selects a tag in the natural parks category, the system could show pictures from different places inside this park in order to ensure a more comprehensive view. [11] introduces an automatic categorization of pictures with respect to their content. The inclusion of this type of algorithms in
ThemExplorer can be of help in the adaptation of the results to the type of the queried entity. If pictures for a museum are demanded, pictures from an “interior views” and “exterior views” classes could be displayed.
Last, but not the least: we plan to realize a user study for a global validation of the system. The experiments presented in this paper only address only the system components. It would be interesting to have a global assessment of the system performances. The design of the user study is not straightforward but we are aware of the necessity of this type of experimentation. Ideally, the study should include a comparison between ThemExplorer and World Explorer.
8. ACKNOWLEDGMENT
This work is sponsored by the French research program InfoM@gic.
9. REFERENCES
[1] Ahern, S., Naaman, M., Nair, R. and Yang, J. 2007. World
Explorer: Visualizing Aggregate Data from Unstructured Text in Geo-Referenced Collections. In Proc. of JCDL (Vancouver, Canada, June 2007).
[2] Auer, S., Bizer, C., Lehmann, J., Kobilarov, G., Cyganiak, R.
and Ives, Z. 2007. DBpedia: A Nucleus for a Web of Open Data. In Proc. of ISWC 2007 Busan, Korea (November 2007).
[3] Brill, E., Lin, J., Banko, M., Dumais, S. and Ng, A.
Data-intensive question answering. 2001. In Proc. of the TREC-10
Conference (Gaithersburg, Maryland, USA, Nov. 2001),
183—189.
[4] Cheng, Y.C. Chen, S.Y. Image classification using color,
texture and regions, Image and Vision Computing, Volume 21, 759-776, 2003
[5] Cox, I.J., Miller, M.L., Minka, T.P., Papathomas, T.V.,
Yianilos, P.N. "The Bayesian Image Retrieval System, PicHunter: Theory, Implementation, and Psychophysical Experiments" IEEE Tran. On Image Processing, Volume 9, Issue 1, pp. 20-37, Jan. 2000.
[6] Csurka, G., Dance C.R., Fan, L., Willamowski, J., Bray C.,
Visual categorization with bags of keypoints. In Proc. of ECCV Workshop on Statistical Learning in Computer Vision, pages 1-22, 2004
[7] Geonames – http://www.geonames.org
[8] Hill, L. L., Frew, J. and Zheng, Q. 1999. Geographic names –
the implementation of a gazetteer in a geo-referenced digital library. (CNRI D-Lib Magazine, January, 1999).
[9] Horster, E., Leinhart, R., Slaney, M. Image Retrieval on
Large-Scale Image Databases. In Proc. of CIVR 2007. (Amsterdam, The Netherlands, 2007).
[10]Joint, M., Moëllic, P.A., Hède, P., and Adam, P. PIRIA: A
general tool for indexing, search and retrieval of multimedia content. In Proc. of SPIE Image processing: algorithms and
systems (San Jose, California, January, 2004), 116-125.
[11]Kazama J. and Torisawa, K. 2007. Exploiting wikipedia as
external knowledge for named entity recognition. In Proc. of
EMNLP 07 (Praque, Czech Republic, June 2007).
[12]Liu, Y., Zhang, D., Lu, G., Ma, W.-Y. 2007. A survey of
content-based image retrieval with high-level semantics. Pattern Recognition 40(1).
[13]Lowe D., "Distinctive image features from scale-invariant
keypoints," International Journal of Computer Vision, 60, 2 (2004), pp. 91-110.
[14]Millet, C. Construction et utilisation de la sémantique dans le
cadre de l’annotation automatique d’images. PhD Thesis, CEA LIST, 2007
[15]Naaman, M., Song Y. J., Paepcke, A., Garcia-Molina, H.
2006. Assigning Textual Names to Sets of Geographic Coordinates. Journal of Computers, Environment, and Urban Systems Journal, 30(4) (July 2006). 418 – 435.
[16]Naaman, M., Song Y. J., Paepcke, A., Garcia-Molina, H.
2004. Automatic Organization for Digital Photographs with Geographic Coordinates. In Proc of JCDL'04 (Tucson, Arizona, June 2004)
[17]O’Hare N., Gurrin, C., Smeaton A. F., Jones G. F. G. 2005.
Combination of content analysis and context features for digital photograph retrieval. In. Proc. of EWIMT 2005.
[18]Panoramio – http://panoramio.com
[19]Quack, T. Monich, U., Thiele L., Manjunath, B. S. 2004.
Cortina: A System for Largescale, Content-based Web Image Retrieval. In Proc. of ACM Multimedia (New York, NY, USA, November 2004).
[20]Popescu, A., Millet, C., Moëllic, P.A. 2007. Ontology Driven
Content Image Retrieval. In Proc of the ACM Conference on
Image and Video Retrieval (Amsterdam, The Netherlands,
July 9 -11, 2007).
[21]Rattenbury, T, Good, N., Naaman, M. 2007. Towards
Automatic Extraction of Event and Place Semantics from Flickr Tags. In Proc. of SIGIR 07 Amsterdam, The Netherlands, July 2007.
[22]Sanderson, M., Han, Y. Search words and geography. In Proc.
of GIR 2007 9Lisbon, Portugal, 2007). 13 – 14.
[23]Lazebnik S., Schmid C., Ponce J., Beyond Bags of Features:
Spatial Pyramid Matching for Recognizing Natural Scene Categories, IEEE Conference on Computer Vision and Pattern Recognition, CVPR 06 - Volume 2, 2169-2178, 2006
[24]Sivic, J. Efficient visual search of images and videos. PhD
thesis (2006) Oxford Univesity
[25]Smith, J.R., Chang, S.F. 2000. Visually searching the Web for
Content, IEEE Multimedia, 4, 3 (July-Sept 2000), 12-20.
[26]TagMaps - http://tagmaps.research.yahoo.com
[27]Veltkamp, R.C. Tanase, M. Survey of Content-Based Image