HAL Id: hal-02326888
https://hal.archives-ouvertes.fr/hal-02326888
Submitted on 22 Oct 2019
HAL is a multi-disciplinary open access
archive for the deposit and dissemination of
sci-entific research documents, whether they are
pub-lished or not. The documents may come from
teaching and research institutions in France or
abroad, or from public or private research centers.
L’archive ouverte pluridisciplinaire HAL, est
destinée au dépôt et à la diffusion de documents
scientifiques de niveau recherche, publiés ou non,
émanant des établissements d’enseignement et de
recherche français ou étrangers, des laboratoires
publics ou privés.
Assessment of the African Airborne Dust Mass Over the
Western Mediterranean Sea Using Meteosat Data
François Dulac, Didier Tanré, G. Bergametti, Patrick Buat-Ménard, Michel
Desbois, David Sutton
To cite this version:
François Dulac, Didier Tanré, G. Bergametti, Patrick Buat-Ménard, Michel Desbois, et al.. Assessment
of the African Airborne Dust Mass Over the Western Mediterranean Sea Using Meteosat Data. Journal
of Geophysical Research: Atmospheres, American Geophysical Union, 1992, 97 (D2), pp.2489-2506.
�10.1029/91JD02427�. �hal-02326888�
JOURNAL OF GEOPHYSICAL RESEARCH, VOL. 97, NO. D2, PAGES 2489-2506, FEBRUARY 20, 1992
Assessment of the African Airborne
Dust Mass Over the Western
Mediterranean Sea Using Meteosat Data
FRAN(7OIS
I)ta•C, 1 Dn)mR
TINES,
2 Gmtas
BERGAMETTt,
3 PATPJCK
BUAT-M•N•, 1 MICHEL
DESBOIS
,4
AND
DAVID
SUTTON
1,5
The mass of African dust present over the western Mediterranean during a transport episode from northwestern Africa, which occurred in early July 1985, is estimated using a desert aerosol model, an Earth- aunosphere radiative transfer model and Meteosat visible channel data from 4 days running. Dust pixels are selected from Meteosat images, and their aerosol optical thickness is retrieved. A proportionality factor between aerosol optical thickness and atmospheric columnar aerosol loading is computed and applied to the dust pixels. The total mass of atmospheric particles over the basin is obtained by interpolation and spatial integration. The maximum aerosol optical thickness is 1.8. The maximum aerosol columnar
loading
is evaluated
to be 2.3 g m -2. The
integrated
mass
of particles
present
at a given
time
is estimated
to
raise
up to about
0.6 x 10¹²g
at the
maximum
and
the
total
mass
of dust
exported
from
Africa
to be of the
order of 1012 g. The method is carefully evaluated and uncertainties are discussed, with particular emphasis on the relationship between atmospheric dust mass and aerosol optical depth. The overall uncertainty on the total mass is roug .hly a factor_+3. In the absence of clouds it appears that the major uncertainty results from the lack of knowledge of the actual mass-size distribution of suspended dust particles, pointing out the lack of relevant data on particles larger than 10 ]•m in diameter. A simple calculation based on results from both computations and simultaneous field measurements yields a net transfer velocity of particles from the dust layer of approximately 1 can s' 1.1. INTRODUCTION
Atmospheric fallout has been recognized to significantly
influence the trace element biogeochemistry in the ocean
[B uat-Mdnard and Chesselet, 1979; Martin and Fitzwater, 1988;
Knap et al., 1990]. Previous studies in the western Mediterranean have shown that atmospheric transport of soil
dust from Africa is responsible for sporadic but intense aerosol
concentration peaks, with daily mean values greater than
background by up to 2 orders of magnitude [Arnold et al., 1982;
Chester et al., 1984; Tomadin et al., 1984; Dulac et al., 1987;
Bergametti et al., 1989a; Corregiari et al., 1990]. These events
control the atmospheric input to the sea of major particulate
elements, such as A1, Si, or Fe [Bergametti et al., 1989b], and
play a significant role in the p H of associated precipitations
[Lo•e-Pilot et al., 1986; Losno et al., 1988; Glavas, 1988]. Moreover, they are followed by significant increases of
elemental concentrations and fluxes in the upper water column
[Buat-Mdnard et al., 1989]. Unfortunately, accurate transport and deposition estimates are troublesome to obtain on a
regional scale because they require observations over extended
time and space scales. Long term ground sampling
experiments, performed in various oceanic regions, have also shown that annual atmospheric fallout of mineral dusts are
governed by a few rainfall events [Uematsu et al., 1985;
Bergarnetti et al., 1989b; Prospero, 1990].
Satellite observations offer an opportunity to make spatial extrapolations of local ground measurements, meteorological
satellites being of particular interest for long term and large scale studies. It was recognized early on that remote sensing
techniques could be used to detect desert dust clouds [Fujita, 1970; Prospero et al., 1970; Shenk and Curran, 1974], and
satellite data have often been used for qualitative investigations
of movements and source areas of individual dust plumes [e.g.,
Oliva et al., 1983; lwasaka et al., 1983; Legrand et al., 1985;
Coudd-Gaussen et al., 1897; Bergametti et al., 1989b], or for
long-term assessment of frequencies and source regions of dust
1Centre
des
Faibles
Radioactivitrs,
Centre
National
de
la Recherche
transports
[Middleton
et al., 1986; Jankowiak
and Tanrd,
Scientifique/Commissariat h l'Energie Atomique, Gif-sur-Yvette, 1992]. Moreover, it has been shown that aerosol optical depths France. may be derived from visible (VIS) or infrared (IR) satellite data2Laboratoire
d'Optique
Atmosphrrique,
Universit6
des
Sciences
et [Griggs,
1975,
1979;
Carlson,
1979;
K'dstner
et al., 1983;
Techniques de Lille, France. Tanrd et al., 1988a; Haggerty et al., 1990; Tanrd and Legrand,
3Laboratoire
de Physico-Chimie
de l'Atmosph•re,
Universit6
de 1991].
Observations
in the
visible
range
over
the
ocean
allow
Paris VII, France. more accurate estimations due to the low value of oceanic
4Laboratoire
de
Mrt6orologie
Dynamique,
Ecole
Polytechnique,
surface
albedo.
For
instance,
over
the
last
few
years,
global
Palaiseau,
France.
maps
of aerosol
optical
thickness
over the oceans
have been
5Now
at Department
of Computer
Science,
Birkbeck
College,
produced
and
distributed
on
a weekly
basis
[Raoet
al., 1988].
London,
England.
Such data are particularly
useful to meteorologists
and
atmospheric physicists. However, up to now, very few attempts
Copyright 1992 by the American Geophysical Union. have been made to derive the mass of aerosols being
transported. Such information would be extremely useful when
Paper number 91JD02427. assessing the geochemical significance of such transport and
0148-0227/92/91JD-02427505.00 deposition events, especially over open ocean areas.
2490 DULAC •T ,,,L.: I•.,•T DUST MASS (• TI-U• 1VItto•A•F•o• IV[EI'BOflAT DATA
Measurements of aerosol mass from satellite data were first
reported by Fraser [ 1976], who derived the desert dust columnar
atmospheric density over the ocean off northwestern Africa from multispectral MSS Landsat data. Fraser et al. [1984]
estimated the columnar atmospheric density of particulate sulfur
over polluted areas of the United States from the aerosol scattering coefficient derived from GOES data. Desert aerosol
mass was also estimated from aerosol optical thickness derived
from Landsat data offshore from Israel [Melder et al., 1977] and
from GOES data offshore from the Arabian peninsula [Sirocko
and Sarnthein, 1989]. The method consists in using a
mathematical relationship between the aerosol mass density in
a vertical column and an optical parameter such as radiance
[Fraser, 1976], aerosol scattering coefficient [Waggoner and
Weiss, 1980], or aerosol optical thickness [Carlson and Caverly, 1977], derived from the satellite signal using an
Earth-atmosphere radiative model.
In this paper we focus on the use of Meteosat data to
estimate the mass of desert dust over the western Mediterranean,
with special reference to a dust transport event which occurred
in early July 1985 and for which ground-based measurements
were available. Aerosol optical depth over the basin is estimated from Meteosat VlS data using an Earth-atmosphere radiative transfer model, and a relationship between aerosol
optical depth and aerosol mass is computed. Uncertainties are
evaluated and discussed. Finally, the transfer velocity of particles from the dust layer is evaluated from the computed
aerosol atmospheric loading and ground deposition sampling
measurements.
2. TlmDn•n Bns•.
2.1. Satellite Data
Digital data from both visible (VIS: 0.35-1.1 I. tm) and
thermal infrared (IR: 10.5-12.5 I. tm) channels of the operational
meteorological satellite Meteosat 2 were obtained from the European Space Operation Center, Darmstadt, Germany. A
sequence of 8 VIS and 8 IR images have been considered,
corresponding to Meteosat slot 24 (1100-1130 UT
observation) and slot 25 (1130-1200 UT observation) on July
1-4, 1985. Data were coded over 8 bits, so that numerical values
were integers ranging between 0 and 255. We modified the VIS
data by setting its two least significant bits to zero. This was done because VIS data consist of a 6-bit signal to which an
extra 2 bits, whose value is random, have been added for
technical reasons [European Space Operation Center (ESOC), 1987]. Our modified VIS data thus have values ranging from 0 to 252 in steps of 4.
The resolution of full Earth disk images is 5000 columns by
2500 lines in the VIS channel and 2500 by 2500 in the IR. We
resampled the VIS images to make them coincident with the IR
images, by sampling one colunto in every two of VlS data. We
used windows of 510 pixels x 510 lines, approximately
centered on Algiers, and covering Spain, southern France, Italy,
the western Mediterranean, and northwestern Africa.
2.2. Field Sampling and Analytical Methods
Atmospheric aerosol s•rnples were collected at Capo
Cavallo (42ø31N, 8ø40E), Corsica. The sampling site has an
unimpeded view of the sea, is 700 m from the shore, and at an
altitude of about 300 m. Noon-to-noon daily aerosol samples
were collected between February 1985 and December 1987, at
the top of a 10-m-high meteorological tower, on 0.41•ni
porosity
Nuclepore
© filters
[Remoudald,
1990].
Samples
of
total deposition (wet plus dry) were also collected there during
the same period, on a 10- to 20-day basis, using a hemispheric
collector
with an area
of 0.1 m 2. The deposition
samples
were
acidified using HNO 3 0.1N and filtered on 0.4 IJ.m porosity
Nuclepore
© filters. Details of sampling
location
and
conditions have already been published elsewhere [Bergametti,
1987; Bergarnetti et al., 1989a; Dulac et al., 1989]. We shall
focus here on the late June-early July 1985 period, during which
a transport of dust particles from Africa was recorded
[Bergametti et al., 1989b]. Data include (1) daily atmospheric
concentrations of A1, Si, and Fe, from June 21-22 to July 10-
11, excluding two missing samples on June 27-28 and July 9-
10; and (2) Si total deposition, integrated from June 21, 1100,
to July 1, 1000, from July 1, 1000, to July 11, 1140, and from July 11, 1140, to August 1, 1000. It rained during the first deposition sampling period but the two other samples
consisted only of dry deposition.
Xray fluorescence was used for Al, Si, and Fe analyses of
aerosol samples [Losno et al., 1987], and for Si in the
undissolved fraction of total deposition samples. Analytical
precision was better than :1:5% for the samples considered here.
Si concentration in the filtered solution was determined from
total deposition samples by colorimetry, with a precision of
about +10% [Bergametti, 1987].
2.3. Meteorological Data
Conventional data. Basic meteorological parameters (wind
velocity and direction, cloud coverage, precipitation) were
recorded at intervals of 6 hours at Capo Cavallo, which used to
be a French meteorological station. Vertical profiles of
temperature and relative humidity from the ground level up to
500 hPa (about 5900 m), from July 1 to 7, 0000 and 1200 UT,
were obtained from rawindsonde soundings of the atmosphere
performed at the Corsican meteorological station of Ajaccio
(41ø55N, 08ø48E).
Air mass trajectories. In order to trace back the transport of
aerosol particles from their source regions, air mass trajectories
have been computed by the Service des Etudes Sp•ciales,
M6t6o-France, Paris [Martin et al., 1987; Bergametti et al.,
1989a; Martin et al., 1990]. Three-dimensional, 4-day back
trajectories, finishing at the sampling point and at the midtime
of each daily sampling time and arriving at the 925-, 700-, and
500-hPa final levels, have been computed from the analyzed
wind fields of the European Center for Medium-Range Weather
Forecasts in Reading, England. Forward trajectories leaving the
source region, as identified from Meteosat data, were also computed.
3. •Rn'HMSAND METHODS
3.1. Cloud Discrimination
Because of the high albedo of clouds, aerosol optical
thickness should be inferred from cloud-free pixels. Applying a
simple adjusted multispectral threshold on VIS and IR counts is
insufficient to discriminate cloud-covered pixels, so that more
complex tests are necessary [Schiffer and Rossow, 1983;
Saunders and Kriebel, 1988]. The reason is that comparable VIS
DUL•C gr AL.: DESERT DUST.MAss OVER THE MED•ANFROM •tlE'I•OSAT DATA 2491
semi-transparent or partial cloud coverage, and comparable IR
radiative temperatures are produced by dust and water clouds
present at comparable altitudes. However, Coackley and
Bretherton [1982] have shown that water or ice clouds and dust
clouds may be discriminated by differences in local standard
deviation of pixel values, determined over square areas of some
pixels. This is due to the difference in spatial homogeneity of
water and dust clouds.
In order to detect cloudy pixels we applied an objective
discrimination method, based on four different threshold tests.
The first three were respectively applied to the VIS count, to the
IR count, and to the VIS local variance calculated over a 3 by 3
pixel area. Respective threshold values were optimized by visual examination of the images so that evident cloud- contaminated pixels were marked out, and pixels at the limit
between homogeneous areas of dust pixels of different
luminances were saved. Pixels were discarded as cloudy when (1)
their VIS count was greater than 60, which otherwise would
have lead to aerosol optical thickness values greater than 3.5;
(2) their IR count was lower than 120, corresponding to a
radiative temperature lower than 5øC according to the IR sensor
calibration [Meteosat Exploitation Project (MEP), 1985]; and
(3) their VIS variance was greater than 8. This spatial coherence test was the most severe one, as verified by Jankoviak and Tanrd [1992] from Meteosat data over the Atlantic. Only a few likely cloud pixels in large scale cloud structures and in
scattered cloud fields were not discarded. However, these few
pixels appeared to have a significant influence when interpolating pixel values over masked areas (see section 3.3 on integration over the basin). We discarded these pixels using an edge filter which retains a pixel P if at least six of the pixels adjacent to P have the same value as P and eliminates P otherwise.
3.2. Retrieval of the Aerosol Optical Depth Over the Sea
Earth-atmosphere radiative transfer model. Because of relatively high values of land albedos in the visible the apparent reflectance is only slightly modified by atmospheric aerosol so that it is not easy to extract the aerosol content over
land from the satellite signal. Moreover, the value of these
albedos is difficult to assess precisely at the scale of Meteosat pixels, due to their geographical and temporal variability. On the other hand, surface seawater has a low and fairly constant albedo. So we retrieved aerosol optical depth only over the sea,
from Meteosat VIS data, and using an Earth noncloudy
atmosphere radiative model derived from the computer code
"Simulation of the Satellite Signal in the Solar Spectrum" (5S), available from the Laboratoire d'Optique Atmosph6rique,
Universit6 des Sciences et Techniques de Lille, France [Tanrd et
al., 1986, 1990]. Briefly, this computer code allows the
estimation of the satellite signal due to the backscattering of
the light in the solar spectrum by the ground-atmosphere
system, assuming a cloudless atmosphere. It includes accurate
analytical descriptions of the absorption by aerosol particles and atmospheric gases H20, 0 3, 0 2, and CO 2, and of the scattering by gas molecules and aerosols, as well as an approximate handling of the interaction between the two
phenomena. The apparent reflectance as seen by the satellite is
expressed as a function of the intrinsic atmospheric reflectance,
the actual target reflectance, and the ground reflectance outside
the target, which may be different. The relative contributions of
the direct and diffuse transmittances on the sun-ground and
ground-satellite paths, of the spherical albedo of the
atmosphere and of the environment of the target, are calculated
as well as the transmission multiplicative factor related to the
absorption by atmospheric gases and particles.
Input parameters include geometrical and spectral
conditions, atmospheric gaseous composition, aerosol type and concentration, and ground reflectance. Our geometric and
spectral conditions were defined by Meteosat 2 position and
filter function [Morgan, 1981]. The VIS channel has a nonzero
transmission between 0.35 and 1.1 lxm, with a spectral
integrated value of 0.39. The standard mid-latitude summer atmosphere from the LOWTRAN code [Mc Clatchey et al., 1971; Kneizys et al., 1980] was used to define the gaseous
composition
of the atmosphere.
Corresponding
0 3 and
H20
columnar
densities
a•e 6.83 and
29300
g m
-2, respectively.
The
spectral reflectance of seawater, as computed by model 5S from
data on the spectral dependence of clear seawater reflectance
[Viollier, 1980], was 0.024. This value may be questionable,
and the resulting uncertainty will be emphasized in section 4.4.
Aerosol model. When nmning model 5S, the user can set the
atmospheric aerosol composition by combining four basic components as defined in Worm Climate Programme (WCP)
[1986]: continental dustlike, oceanic, nonoceanic water
soluble, and soot. Each of these standard components is
characterized by a monomodal lognormal distribution with respective geometric mean diameters of 1.0, 0.6, 0.01, and 0.0236 [xm. Ground measurements have shown that a dustlike
component of the aerosol is quantitatively predominant in the
case of transport of African dusts [Bergametti et al., 1989a].
However, aerosol particles in plumes transported from arid
regions have different microphysical properties compared with
other continental dustlike aerosol particles and can be clearly
identified as desert aerosol [Jaenicke, 1987; Coudd-Gaussen, 1989]. Indeed, the optical properties of the WCP standard
dustlike component [WCP, 1986] are significantly different
from optical properties of desert aerosol [Shettle, 1984;
D'Almeida, 1987]. Therefore we had to consider a specific desert
aerosol component and to implement it in 5S.
Fitting data from seven cascade impactor samples of African dust performed in Corsica and at sea during several oceanographic cruises have yielded a single mode for particle size distribution, with a mass-median diameter (MMD) ranging
from 2.3 to 5.2 [tm and a geometric standard deviation ranging from 1.1 to 4.5, the largest values being derived from samples collected along the African coast [Bergametti, 1987;
Dulac, 1986; Dulac etal., 1989; Gomes et al., 1990]. However, our cascade impactors allow the sampling of particles in a
limited range of size, probably from 0.05 to 15 [tm in diameter.
Moreover, the optical properties of these aerosols have not been studied. Because of this lack of relevant data from African dust plumes over the Mediterranean we considered the standard continental desert aerosol models which were available from Shettle [1984] and D'Almeida [1987]. These authors have determined optical properties for several standard models of
desert aerosol, based on measurements of number-particle size
distributions and of refractive index. Size-distribution parameters used by $hettle relied on the compilation by Jaenicke [1987], while D'Almeida relied on his own measurements in Africa. The values of the refractive index in
the visible range used by Shettle and D'Almeida stemmed from
measurements performed on Saharan aerosols by Carlson and
2492 DULACErr aU.: D•F. aTDUSTMASS Ov• TH•••FROM MEIE•ATDATA
TABLE 1. Parameters of the Mass-Size Distributions of Desert Aerosol Models
Aerosol Model Background Wind-carrying dust Sandstorm C,% Background Dust storm D'Almeida [ 1987] 1 0.832 2.10 3.6 2 4.82 1.90 95.7 3 19.38 1.60 0.7 1 0.600 2.15 0.4 2 14.68 2.07 95.7 3 55.6 1.70 3.9 1 0.578 2.15 1.6 x 10 '2 2 37.2 2.50 15.7 3 90.0 1.80 84.3 Shettle [ 1984] 1 0.0110 2.13 2.6 x 10 '4 2 2.52 3.20 78.1 3 42.3 1.89 21.9 1 0.0052 1.77 9.6 x 10 '9 2 468 5.89 32.6 3 456 2.74 67.4
This Work (From Cascade Impactor Data)
Dust event in northwestern
Mediterranean 1 2.50 2.0
MMD: mass-median diameter;, o: standard deviation; C: contribution to the total mass.
100.0
presented the mass-particle size dislxibution parameters that we
calculated from the number distributions they selected,
assuming
spherical
particles
of density
2.5 g cm
'3 . Each
proposed model is composed of three lognormal modes, and it
can be seen in Table 1 that there are significant differences in
the mass-size distribution parameters of the different modes between comparable models by Shettle and D'Almeida. This is also the case for the total distributions when the three modes are summed. A monomodal model of the size distribution of desert dust particles over the northwestern Mediterranean during transport events from Africa is also suggested for comparison
in Table 1, from our cascade impactor samples.
Results in Table 1 show that the mass-particle size distribution of the background desert aerosol model used by
Shettle [1984] seems well adapted to our observations, because
it presents a single mode in the particle size range where cascade impactors efficiently collect particles. This mode
accounts for 78.1% of the total particle mass. There is no
reason to believe that the submicronic mode observed in source areas is not Ixansported in the dust plume [e.g., Schiitz, 1979].
However, the contribution of this mode to both aerosol mass
and optical
properties
is negligible.
On the other
hand,
there
is
observational evidence that giant mineral particles (of diameter
50 Ixm or more) from desert areas are transported over very long distances [Prospero et al., 1970; Jaenicke and Schiitz, 1978;
Carder etal., 1986; Betzer et al., 1988; Coudd-Gaussen, 1989].
Microscopic investigations of aluminosilicate particles in aerosol samples [Coudd-Gaussen, 1989] and in a dry deposition
sample
[Dulac
et al., 1991] from Corsica
also
indicate
that large
particles are present in African dust plumes over the
Mediterranean. Dulac [1986] reported an overall MMD of about
13.5 Ixm for insoluble particles in a red rain collected at sea
(40.62øN-07.17øE) in April 1981. Pitty [1968] also reported a
MMD of 9 Ixm for such particles in a red rain collected in Britain in July 1968, while Biicher and Lucas [1975] reported MMDs of
about 10 and 5.3 Ixm, respectively, in two red snows collected
in the French Pyrenees in February 1972 and in March 1974,
with 25% of the total deposited mass in particles greater than
34.7 and 13.3 Ixm,
respectively.
Moreover,
using
a Coulter
©
counter, Guerzoni et al. [1991 ] measured mass-particle size
distributions from a few rain and aerosol samples associated
with southern origins, which were collected in southeastern
coastal Sardinia. Their results suggest an overall MMD of about
15 Ixm in two different rain samples and the presence of two modes in one aerosol sample. These modes are at about 3 and 15 Ixm in diameter, and the large mode contribution to the total
mass is about 40%. The background aerosol model used by
Shettle states that the relevant large mode has a MMD of 42.2
Ixm and accounts for 22.1% of the total mass (Table 1). Any location in the western Mediterranean basin is within 1500 km
of the North African source region of dust for the episode considered (see section 4.1). Schiitz's [1979] calculations,
which consider only particles in the diameter range 0.2-40 Ixm,
suggest that particles larger than 20 Ixm in diameter can contribute significantly to the total aerosol concentration in this range of distance from Saharan source areas. Therefore in
the absence of more quantitative data on very large particles we
assumed that the particle size distribution of the background
desert aerosol model used by Shettle [1984] was suitable for
DULnCET •.' DESERT DUST MASS OVER •mM_F••ANFROM ME'IEOSATDATA 2493
relevant size distribution used by Shettle is based on a model
for a remote continental environment [Jaenicke, 1987]. Long
range transport of the dust cloud over the sea might allow the
modification of the original, dust storm type, size distribution
toward a background type of distribution. Indeed, according to experts [WCP, 1983] the aerosol over deserts in the absence of
dust storms resembles that of remote continents. Moreover, the
radiative properties of this aerosol model, derived using Saharan dust refractive index, are in good agreement with
optical ground-based measurements performed in Senegal
during dust events [Tanrd et al., 1988b]. The radiative
properties of D'Almeida's [1987] background model were also
very consistent, and the consequence of using either mass-size distribution will be emphasized in section 4.
Aerosol optical depth. All other parameters being fixed, the
aerosol optical thickness at 550 nm (x550) was used to set the aerosol concentration, assuming that the atmospheric aerosol
loading
is directly
related
to x550.
The approach
we used
was
to
look at the variations in the calculated Meteosat signal when varying x550, in order to fit the spectral aerosol optical depth dependence as a function of the Meteosat value for a given
geometry.
The
radiance
at the
top
of the
atmosphere
(L*, in W m '2 st' 1)
has been computed using the radiative properties of the aerosol
model and the modified version of the 5S code, for several values of x550: 0.1, 0.2, 0.4, 0.6, 0.8, 1.0, 1.2, 1.4, 1.7, 2.0,
and 2.5. The corresponding Meteosat value (N, a real positive
number) was retrieved from L*, as calculated by 5S, using the following equation:
N=2+L*/C (1)
where C= 0.575 W m -2 sr '1 8-bit-count '1 is the calibration
constant of the Meteosat 2 VIS channel determined by K6pke [1983].
If we consider only single scattering of light then the
aerosol optical thickness could be expressed analytically as
x = 4 n L* cos (Ov) / E 0 P(Os) (2) where 0 v is the zenith viewing angle, E 0 the solar irradiance at
the top of the atmosphere,
and P(0s) the phase
function
for a
scattering angle O s. This would allow us to express x as a function of N as follows:x =a 0 +a 1 N (3) a0=- 8 C n cos (0v) /EoP(Os) (3a)
a 1 = 4 C • cos
(0 v) / E 0 P(Os).
(3b)
The coefficients a 0 and a 1 depend on the geometrical conditions
(hour of observation and position of the pixel). In fact,
however, a more accurate calculation was performed, which took multiple scattering into account in a simple way, and a
third-order
polynomial
function
was
fitted
between
x550
and
N:
x550
= a'0
+a' 1N+a'
2 N 2 +a'
3 N 3.
(4)
Geometrical conditions corresponded to mid day
observations (specifically at 1145 and 1215 UT (corresponding
to Meteosat slot 24 and 25, respectively) from July 1 to 4) and
to 35 test pixels regularly distributed throughout the western Mediterranean area. Corresponding 0 v ranged between 42 ø and
52 ø , while the sun zenith angle ranged between 13 ø and 23 ø .
Moreover, for each image from the series considered (hour of
observation fixed), the coefficients a i (0<i<3) were fitted as
a i =bo,i+bl,iA,
(5)
where A is the angle between OC and CP if O, C, and P,
respectively, are the point of 0 ø latitude and 0 ø longitude, the
center of the Earth, supposed spherical, and the point of
observation,
and
each
b 0,i and
b 1 ,i a constant
for that
particular
image.The accuracy
of the overall
fit of x550
in function
of N and
A was checked.
Any test value of x550 was approximated
to
within -t-0.015. The relative precision was better than 1% for
x550 > 0.6. The highest deviations between fitted and computed values were observed for x550 = 0.1 at the far southwest and northeast of the basin for slot 24 (maximum relative deviation
of 4.5%) and at the far southeast for slot 25 (maximum 8.5%).
3.3. Airborne Dust Mass
Columnar aerosol mass loading at the pixel scale. It is
generally accepted that the aerosol optical thickness at a
wavelength
3. (x;•) is •roportional
to the total aerosol
mass
loading (M, in g m 'z) in a vertical column [Volz, 1970; Carlson and Caverly, 1977]'
M=R x)•
(6)
where the proportionality factor R depends on aerosol
properties. The mass M depends on the aerosol size distribution
n(r,z), r being the radius of particles, supposed spherical, and z
the altitude, and on the aerosol density d,
M = (4/3)
n dloøødz
I0øør
3 n(r,z)
dr
(7)while
x;• depends
on the aerosol
size
distribution
n(r,z) and
on
the Mie theory extinction cross section Q, itself depending on the aerosol particle size r and refractive index m, and on thewavelength •,
X•.=
n;
Ioøødz
I0
øø
r 2 Q(m,r,)•)
n(r,z)
dr.
(8)
Assuming
a particle
density
of 2.5 g cm
-3 [Fraser,
1976;
Carlson and Caverly, 1977], a particle refractive index of 1.55-
0.005i [Patterson et al., 1977] and a constant size distribution as a function of the altitude, we computed the ratio R550
between
M and
x550, the aerosol
optical
thickness
at • 550
nm, for the five desert aerosol distribution models fromShettle [1984] and D'Almeida [1987]. Results are reported in Table 2. The large spread of the results shows that the
determination of M from x550 is very sensitive to the aerosol mass-size distribution and therefore subject to large
uncertainties. The computed value of 1.3 is in good agreement
with the values of 1.3 and 1.5 reported for Saharan aerosol after
Atlantic crossing, by Volz [1970] and by Carlson and Caverly
[1977], respectively, after measurements in the Caribbean and
at Barbados. When only the intermediate mode of Shettle's
background model is considered, the ratio R550 is 0.965 (Table 2). This value is 26% lower than when considering the three
modes together, when 22% of the mass is due to the single third
mode (Table 1). This confirms that extinction is essentially due to the second mode, while the third mode also contributes
significantly to the total mass. We also determined the value of
R for the model derived from cascade impactor Mediterranean
samples of African aerosol presented in Table 1. The result is
2494 DULACgr •.: DESERTDUSTMASS OVeR THE••ANFRO• ]VIEIF. OSATDATA
TABLE 2. Ratio R 550 Between the Total Aerosol Mass in an
Atmospheric Column and the Aerosol Optical Thickness
at 550 nm for Desert Aerosol Distribution Models
Aerosol Model
R550
= M (g
m'2)!
'r.550
D'Alrneida [ 1987]
Background 2.4
Wind carrying dust 8.2
Sandstorm 45.1 Shettle [1984] Background, mode 2 0.965 Background 1.3 Dust storm 135.6 This Work
Dust event in northwestern Mediterranean 1.13
derived from Shettle's background model. As already mentioned, Shettle's background model fits our ground
measurements, which cover a limited range of particle size, so that the value of 1.30 seems the most realistic one. Therefore
we used the following relationship to infer the columnar
atmospheric dust loading from the atmospheric turbidity:
M (g m
-2) = 1.3
x550.
(9)
For comparison, let us also mention the value of 3.75
measured by Carlson and Caverly [1977] at Cape Verde Islands
(off the West African coast) and the value of about 10, deduced
from measurements performed by D'Almeida [1986] at Agadez
assuming the thickness of the equivalent homogeneous Saharan
air layer was 3 kin. Although all these coefficients are deduced
from optical thicknesses determined for different spectral
conditions, the authors agree that the dependence of x on }• is
weak in the case of desert aerosol [Carlson and Caverly, 1977;
Shettle, 1984; D'Almeida, 1987] so that the different values of the ratio R from the literature may be compared to the value of R550 calculated in this work.
Integration over the basin. The aerosol columnar densities were determined from a limited number of pixels, due to the
presence of islands and clouds over the basin. In order to take
into account the mass of dust present in the numerous pixels
where raw data were not exploitable in terms of aerosol loading,
we performed a linear interpolation of the discontinuous M
fields. This is justified because the continuity of aerosol densities through areas that were masked suggest that water clouds did not significantly modify the structure of the dust
front (Plate 1). Indeed, the meteorological reports from Ajaccio
confirmed the presence of a partial coverage of the sky (< 50%)
by altocumulus clouds, but only over 2500 m (the highest
altitude of the standard scale used for reports) during the passage
of the cloud system over Corsica (July 4, 0000 and 1200 UT reports), while clear sky was observed on the day before and after.
We used a standard distance weighted interpolation routine of
the Uniras©/Unimap
2000
© graphic display package
[UNIRAS, 1988, 1989]. The grid cell for interpolation was fitted to have one pixel per grid node. No smoothing of
interpolated data was performed, so that the numerical values of
unmasked pixels remained unchanged after the interpolation process.
4.1. Atmospheric Circulation
The Meteosat images displayed in Plate 1 have been simply colored in order to show the transport of a dust plume from North Africa to Europe over the western Mediterranean, associated with the eastward movement of a cyclonic cloud
system over the basin. With a view to a better understanding of the atmospheric processes involved in this dust production and
transport event, it is necessary to briefly describe the
mesoscale meteorological situation. The meteorological charts
reported in Figure 1 are based on the meteorological synoptic
charts from the European Meteorological Bulletin. The 850 hPa
chart in Figure la shows the incursion of a cold polar air mass
over the eastern Atlantic at the latitude of the Iberian peninsula.
An anticyclonic wedge was located over Tunisia and the
southern part of the western Mediterranean Sea. Ground level
charts report a NW-SE front, between the trough located over the eastern Atlantic and this anticyclonic wedge, generating strong winds ahead of itself in northeastern Algeria. The
evolution of the 850 hPa situation on July 3 and 4 is reported in
Figures lb and lc. The eastward movement of the trough, which
was located over the Iberian peninsula on July 3, generated a
SW-NE circulation at 850 hPa in the western part of the western
Mediterranean, propitious to dust transport from North Africa
to the basin. Simultaneously, the front also moved eastward and
was located over Corsica and Sardinia on July 4.
Meteorological reports from Ajaccio and Capo Cavallo did not
mention any precipitation during the passage of the front.
A high pressure center was located over the gulf of Gabes and
northern Tunisia, which generated a W-E circulation over the
central Mediterranean. Hence the SW-NE transport of the
western part of the dust cloud, as visible in Plate 1, was due to
the cyclonic flow generated by the trough located over the
Iberian peninsula, while the eastern part of the dust cloud was
transported eastward under the influence of the high pressure
cell located over Tunisia.
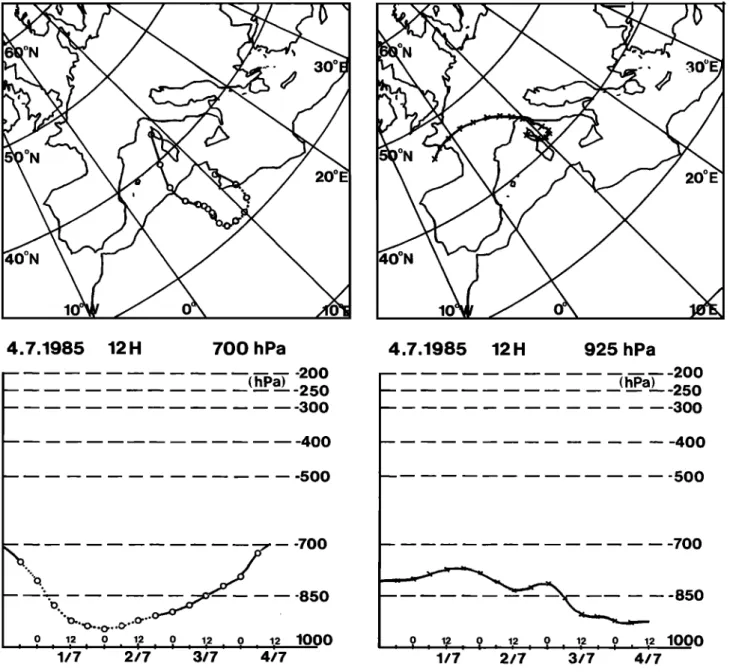
Backward air mass trajectories, finishing at our ground
sampling station at Capo Cavallo, on July 4, at 700 and 925
hPa, are reported in Figure 2. They clearly show that the upper
air mass, transported from Africa to Corsica, experienced a mean continuous upward movement from the source region, over a lower layer air mass coming from the Ariantic over France. This is in agreement with the frontal character of African dust transport events over the western Mediterranean
and western Europe [Prodi and Fea, 1979; Reiff et al., 1986;
Bergametti et al., 1989• Martin et al., 1990]. These
trajectories suggest that the dust layer was transported at a mean
altitude of about 3 km over Corsica. Moreover, rawindsonde
soundings performed at Ajaccio showed that the thickness of
the dust layer over Corsica was up to 5500 m on July 3, 0000 LIT, and that an average thickness of about 3500 m may be assumed for the dust layer during its presence over Corsica
(Table 3).
Only a rough indication of the source region of the dust is
given by finishing trajectories (Figure 2). Meteosat IR images
taken on July 1 and 2 show that a dust rise occurred on the
Algerian Arias plateaus (Plate 2),which has extensive areas of dried marshes in summer [Peters, 1989]. Indeed, the dust rise on
July 1, as visible in plate 2, was limited to the chott Ech Chergui area. Two forward air mass trajectories have been computed, starting on July 2, 0600 UT, at 850 hPa, from the
2•2
:.•,,...x, •. .... . . _ . '•.•,•; •' :;' •,• .•. =.. ,_-. -.. ;,-,
-
i5'z,0 7 z.
• -.- .!:..•.' :,:-xE•!:k•.•...•r .• .• -'• ,q•.., . . ... ... :. . ß . . ...
?l•t• 1. Colored l•I•t•o•at !/IS imaõ• Ouly I to 4, 1985, •1ot 24) •ho•dnõ th• transport of a du•t plum• over th• w•stem Mediterranean basin. Pix•l• with their numeric ½oum at 8 (•h• lowest v•lu• in •h• imaõ•) are displayed in white, pix•l• •t
12 in dark blu•, pix•l• at 16 in liõht blu• ... pixels at 36 in r•d. Pixel• with upper valu• are black and whit• •h•ded.
2496 DULACET.•L.: DESERT DUST MASS • THEMED•FRcavl •VIErEOSAT DATA
eastern and western borders of the source region as observed on
the satellite IR image (Plate 2). The starting barometric level of 850 hPa was chosen to be representative of the altitude of the Ariasic high plains in the considered region. These two trajectories are reported in Figure 3. They are consistent with
the outlines of the dust cloud during its transport over the
western Mediterranean, as deduced from meteorological charts
(Figure 1) and seen on Meteosat VIS images (Plate 1). 4.2. Ground-Based Measurements
Daily atmospheric concentrations. The atmospheric parti- culate concentrations of Al or Si are well known to be efficient
tracers of the soil-derived dust component of the tropospheric
aerosol [Rahn, 1976]. The daily atmospheric particulate
concentrations of A1, Si, and Fe at Capo Cavallo from June 21-
22 to July 12-13 are reported in Figure 4. During this period,
mean
background
levels
were
observed
(about
300 ng m '3 for
A1 and Fe and about 1000 for Si). These correspond to the
typical summer background levels in this part of the western
Mediterranean, as observed by Bergametti et al. [1989a].
However, the samples collected on July 2-3 to July 5-6 exhibit
much
higher
concentrations,
up to 5900
ng m
-3 for Si on July
4-5. Such high atmospheric concentrations of soil-derived dust
in this area are generally connected to African dust inputs
[Chester et al., 1984; Dulac et al., 1987; Bergametti et al.,
1989a; Correggiari et al., 1990]. Rawind soundings at Ajaccio
showed that changes in A1 and Si concentrations were strongly
correlated to changes in tropospheric air temperature. This is
illustrated in Figure 5 where the temperature of air at the altitude
of 2000 m is plotted together with the noon-to-noon daily
atmospheric Si concentration at Capo Cavallo.
It is noteworthy that the concentration peak at the ground
level corresponded to the July 4-5 sample (Figure 4), when the
dust layer had already passed Corsica (Figure 5 and Plate 1). In
contrast the maximum integrated dust load over Corsica seemed
to have occurred during the sampling time of the previous sample, i.e., July 3-4. This is probably due to the frontal
character of the dust transport. Indeed, the observation of dust
at the ground level in Corsica when the dust layer was still at high altitude, on July 2-3, may be attributed to strong vertical
mixing in the frontal zone. Later, maximum concentrations at
the ground level were observed. This was when the lowest part
of the front passed over Corsica, allowing the presence of the
dust layer at the sampling level. Results from the rawind
soundings conf'u'med that the base of the warm and dry air layer
regularly descended from about 550 m on July 3, 0000 UT, to
the sea level on July 4, 1200 UT (Table 3). This layer reached the level of the sampling station (about 300 m) late on July 3 and was no longer present on July 5, 0000 UT. High
concentrations, still observed on July 5-6, were probably due
to the settling of particles.
The northward movement of another large dust cloud is visible over central Sahara on the July 3 Meteosat IR image (Plate 2). The Meteosat July 4 images (Plates 1 and 2) indicate that a secondary dust input occurred over the western
Mediterranean from July 4. The neck of dust visible off Algeria
on the July 4 VIS image (Plate 1) and still high Al, Si, and Fe
atmospheric loading at Capo Cavallo on July 5-6 and 6-7
(Figure 4) suggest that this secondary dust plume could have
2.0 7. 1985
÷44
136
156 156 152
148
Fig. 1. Synoptic meteorological situation at 850 hPa around the Mediterranean area on (a) July 2), (b) July 3, and (c) July 4,
DULACET •L ß DESERTDUSTMASS •ER T!mM••n•FRoM MEmOSATDATA 2497 16 6(} 156 132 3.0 7. 1985 136 140 152 \ L v 152 160 156 4.07. 1985
15/2
./ 156 156 148 148 152 Fig. 1. (continued)2498 DtJLACET,•L.: DESERTDUST]MASS OVER T•mME••nsFaoM Mm'EOSATDATA
6
•
40 10 4.7.1985 12H 700 hPa 4.7.1985 12H 925 hPa ,200(hPa)
-250 ...
(hPa)
200
300 ,400 -500 -- -700 ß o "!3.., .o-- ß o...o...o.' 12 o 12 1/7 2/7 850 25O 3OO 400 5OO 7OO 850o
?
,o •:, 1000
o
•:,
o
•:,
o
•:,
o
? 1000
ß ! ! I I . ß . .. . .. ß . . i ß . ! ß ß317
4)7
1/7
2/7
3/7
4/7
Fig. 2. Computed backward, three-dimensional air mass trajectories, ending at Capo Cavallo, at 1200 UT on July 4, 1985,
at 700 and 925 hPa. The time step between consecutive marks is 6 hours.
reached Corsica. Indeed, interelemental concentration ratios at
Capo Cavallo showed a strong discontinuity between July 4-5 and July 5-6 samples. It has been shown that in the case of
African dust transport in Corsica, characterized by high A1, Si,
and Fe atmospheric concentrations, different source regions are
characterized by different values of interelemental ratios in aerosol particles [Bergametti, 1987; Bergametti et al., 1989b].
While Si/A1 and Fe/AI in July 2-3 to 4-5 aerosol samples were
characterized by values typical for dust particles coming from
Morocco and northwestern Algeria (Si/AI= 2.64, 2.82, 2.77' Fe/AI= 0.67, 0.73, 0.68), the July 5-6 sample exhibited much higher values (3.45 and 1.12 respectively), encountered in Corsican samples of desert aerosol coming from more remote
Saharan source regions [Bergametti et al., 1989b]. However,
this secondary input was much more limited in intensity and
spatial extension, as confirmed by examination of a spare Meteosat VIS image taken in the morning of July 5.
The evolution of atmospheric concentrations (Figure 4) and of the dust plume (Plate 1) suggest that the presence of
atmospheric dust at Capo Cavallo lasted from early July 3 to
early July 6, i.e., for 3 + 0.5 days. In order to average the Si TABLE 3. Base Vertical Level and Thickness of the Warm and
Dry African Air Layer Over Corsica, as deduced from rawindsonde soundings perfomaed at Ajaccio
Date Hour, UT Base, m Thickness, m
July 3, 1985 0000 540 5500 July 3, 1985 1200 410 3500 July 4, 1985 0000' 250 > 2800
July 4, 1985 1200 0 3000
Dta•^c•r n•.. D•s•T DusT MAss On• T•mMm>rm•.•n•nNFgoM ME•EOSATDATA 2499
...
6000
• 5000
.----o---
A1
• 4000 • 3000.• 2000
$ looo'•
0
i I i i , '1 ' Date, June-July, 1985Fig. 4. Daily (noon to noon) mean atmospheric particulate concentra- tions of Si, A1, and Fe at Capo Cavallo between June 28-29 and July
30ø
10-11,
1985.
The
July
9-10
sample
is missing.
20O 250 3OO 400 500 (hPa) 700
850
5 ...
10t")t"t 12 18 0 .6 12 18 0 6 12 18 0 6 12 18 0 6 ... ß . ß • ß ! ß i i i i i i IFig. 3. Computed forward, three-dimensional air mass trajec-tories, leaving the eastern (o) and western (+) boundaries of the dust source area at 0600 UT on July 2, 1985, and at the 850 hPa initial level. The time step between consecutive marks is 6 hours.
atmospheric concentration during that period and because of the
noon-to-noon sampling period, we assumed background Si
concentrations
of 1000
and 1200
ng m
-3, respectively,
during
the first half of the July 2-3 sampling period and the secondhalf of the July 5-6 period (Figure 4). This yielded a mean
atmospheric
Si concentration
of about
4900 ng m -3 over
the 3
days of presence of dust particles over Corsica. Using the meanSi concentration of 33% in average soil [Vinogradov, 1959;
Bowen, 1966] as a reference for Si concentration in the aerosol, we estimated that an average concentration of dust of about
15000
ng
m
-3 occurred
at the
ground
level
durin•
those
3 days.
Atmospheric deposition. The total atmospheric deposition
of Si measured at Capo Cavallo during the sampling period
considered
was
(6.64
+ 0.42) 10
-3 g m
-2 d
-1 from
June
21 to
July 1, (10.74
+ 0.33) 10
-3 g m -2 d
-1 from
July
1 to July
11,
and (3.13 + 0.13) 10
-3 g m -2 d
-1 from July 11 to August
1.
Precipitation was recorded at Capo Cavallo on June 22 (9 nun)and June 23 (traces), i.e., during the first deposition sampling
period. The two other samples corresponded to dry deposition only. While comparable background concentrations of atmospheric particulate Si were observed during the first and third deposition samples, the deposition flux was twice as
intense during the farst smnple as during the third, due to the wet
deposition event. These results confirm that wet deposition is
more efficient at aerosol deposition than dry deposition [Slinn,
1983]. Despite the absence of wet deposition but due to the occurrence of the dust event considered, the atmospheric
deposition of Si was still higher for the second total deposition
sample. Approximating the contribution of background Si deposition during this sampling period (10.12 days) from a
mean
atmospheric
S i concentration
of 1000
ng m
-3 and
a dry
deposition
velocity
of 1 cm s
-1 for background
conditions
[Dulac
et al., 1989],
we calculated
that
a total
of 0.10 g m
-2 of
Si was deposited due to the African dust plume itself. This corresponds to 92% of the Si deposition during the relevanttotal deposition sampling period. Using the mean S i
concentration of 33% as a reference for Si concentration in the
20 I t t t t t ß 6OOO 5O00 4000 3000
! [oo
ooo
6 7 Date, July, 1985Fig. 5. Daily (noon to noon) mean atmospheric particulate concentra- tion of Si at Capo Cavallo and air temperature at the altitude of 2000 m
as deduced from available rawind soundings from July 1, 0000 UT, to July 7, 1200 UT The July 6, 1200 UT, sounding is missing.


![[DOC] cours Acces les Macro en Doc| Télécharger PDF](data:image/gif;base64,R0lGODlhAQABAIAAAP///wAAACH5BAEAAAAALAAAAAABAAEAAAICRAEAOw==)