HAL Id: tel-01425297
https://tel.archives-ouvertes.fr/tel-01425297
Submitted on 3 Jan 2017HAL is a multi-disciplinary open access archive for the deposit and dissemination of sci-entific research documents, whether they are pub-lished or not. The documents may come from teaching and research institutions in France or abroad, or from public or private research centers.
L’archive ouverte pluridisciplinaire HAL, est destinée au dépôt et à la diffusion de documents scientifiques de niveau recherche, publiés ou non, émanant des établissements d’enseignement et de recherche français ou étrangers, des laboratoires publics ou privés.
Rare Earth doped Si based frequency conversion layer
for Si Solar Cell
Lucile Dumont
To cite this version:
Lucile Dumont. Rare Earth doped Si based frequency conversion layer for Si Solar Cell. Materials. Normandie Université, France; Université de Caen Normandie, 2016. English. �tel-01425297�
THESE
Pour obtenir le diplôme de doctorat
Spécialité Physique
Préparée au sein de l’Université de Caen Normandie
Rare Earth doped Si based frequency conversion layer for Si Solar
Cell
Soutenue par
Lucile DUMONT
Thèse dirigée par Fabrice GOURBILLEAU avec co-encadrement par Julien Cardin, laboratoire CIMAP
Thèse soutenue publiquement le 17/11/2016 devant le jury composé de
M. Hervé RINNERT Professeur des Universités/Université de
Lorraine- Institut Jean Lamour (Nancy) Rapporteur
M. Nicolas BARREAU Maitre de conférence (HDR)/Institut des
Matériaux Jean Rouxel (Nantes) Rapporteur
M. Didier STIEVENARD Directeur de Recherche CNRS/ IEMN
(Lille) Examinateur
Mme. Marzia CARRADA Chargée de Recherche CNRS/ CEMES
(Toulouse) Examinatrice
M. Julien CARDIN Ingénieur de Recherche(HDR)/ CIMAP
(Caen) Co-encadrant de thèse
M. Fabrice GOURBILLEAU Directeur de Recherche CNRS/ CIMAP
Acknowledgement
Already three years have passed, and this stimulating enterprise that is a thesis is close to an end. I am grateful to the CNRS and the Basse-Normandie region that financed my thesis, to the French National Research Agency that provided support for this work through the GENESE Project (ANR-13-BSS09-0020-01), and to the Hubert Curien Partnership (PHC) that allowed a partnership with Ing-Song Yu assistant professor in the National Dong Hwa University in Taiwan.
I would like, first, to thanks the Jury members, Nicolas Barreau, Hervé Rinnert, Marzia Carrada, and Didier Stievenard for agreeing to contribute their expertise to and review this work. I also thank the last two for the constructive talk we had on this work.
I express my sincere gratitude to my thesis director Fabrice Gourbilleau for his guidance and support of my research work as well as for trusting me with the presentation of this work in various conferences over the world. I extend my gratitude to Julien Cardin, my co-supervisor, for its clear and precise explanations and the time he took to discuss with me about the theoretical points of my thesis.
My sincere thanks go to Phillipe Marie for his help with the ellipsometry measurements, Xavier Portier for teaching me the basics of TEM handling and his subsequent help when I was using it, Christophe Labbé for the photoluminescence lifetime measurements he provided and explained, Cedric Frilay for teaching me the fabrication process as well as for always having time to help me, Michael Boisserie for the measurements he performed on several machines, Frank Lemarié for the TEM samples preparation, Patrick Voivenel and Stéphane Renouf for the help they provided when machines encountered technical problems, and Silvain Foubert for manufacturing needed pieces. I also thank Patrizio Benzo for his help during my first year and his contribution to this work. I extend my thanks to Christiane Malot, Delphine Hasley, and Lucie Berker that take care of the administrative part of the research and Cédric Gendreau that maintains the computer network of the laboratory. I would like to thank them all along with Christian Dufour for their acceptance, support and encouragements as well as for the very good times we spent together.
I thanks also Ing-Song Yu thanks to whom we were able to deposit our layers on industrial solar cells and that welcomed us warmly in Taiwan.
I acknowledge Marie-Paule Besland who performed XPS measurements on our samples. I am grateful to Marzia Carrada who made TEM analyses on our samples
I thank all the PhD students, Post-docs, and trainees that shared an office with me for the constructive talks as well as for the good moments and the laughs. I speak about Christian Davesnne-Aubert, Ahmed Ziani, Florian Ehre, Nicolas Chery, Jennifer Weimmerskirch-Aubatin, and Clément Guillaume. I thank them as well as Hichem Ben Ammar, Nicolas Guth, and Delphine Marie for their friendship and support.
Last but not least, I would like to thanks my family: my parents, my brother as well as my grandparents for their love and support during this thesis and in life generally. I also thank Nicolas Bordes for bearing with me even during the redaction period. I thank him and his family as well as all my friends for their support and encouragements.
Contents
List of abbreviations... i
Introduction ... 1
Chapter I: State of the art ... 5
I.1. Silicon solar cells ... 5
I.1.1. Background ... 5
I.1.2. History ... 7
I.1.3. Advantages and drawbacks ... 8
I.2. Efficiency limitations ... 10
I.2.1. Shockley-Queisser limit ... 10
I.2.2. Other efficiency losses ... 12
I.2.3. Exceeding the Shockley-Queisser limit ... 13
I.2.3.1. Multijunction cells ... 13
I.2.3.2. Spectrum conversion ... 14
I.3. Down-conversion principle ... 16
I.3.1. History ... 16
I.3.2. Rare earth ions in the down-conversion process ... 19
I.3.2.1. The rare earth elements ... 19
I.3.2.2. Review of the rare earth ions used for the down-conversion ... 22
I.3.3. Matrix requirements ... 23
I.3.3.1. Silicon solar cell application ... 23
I.3.3.2. The sensitizing matrix ... 24
I.4. Energy transfers ... 25
I.4.1. Matrix to rare earth ions ... 25
I.4.2.1. Energy transfer between rare earth ions ... 26
I.4.2.2.Down-conversion possible energy transfers ... 28
I.4.3. Possible energy losses ... 29
I.5. Conclusion ... 31
Bibliography ... 32
Chapter II: Experimental techniques ... 41
II.1. Layers fabrication ... 41
II.1.1. Deposition: Radiofrequency Reactive Magnetron Co-Sputtering ... 41
II.1.1.1. Principle... 41
II.1.1.2. Experimental setup ... 44
II.1.2. Annealing processes ... 44
II.1.2.1. Classical Thermal Annealing ... 45
II.1.2.2. Rapid Thermal Annealing ... 46
II.2. Structural and composition characterizations ... 46
II.2.1. Fourier Transform Infrared Spectroscopy ... 46
II.2.1.1. Principle... 46
II.2.1.2. Experimental setup ... 47
II.2.2. Transmission Electron Microscopy ... 49
II.2.2.1. High Resolution Transmission Electron Microscopy ... 49
II.2.2.2. Energy-Dispersive X-ray spectroscopy ... 51
II.2.2.3. Sample preparation ... 52
II.2.3. Rutherford Backscattering Spectroscopy ... 52
II.2.3.1. Principle... 52
II.2.3.2. Experimental setup ... 53
II.2.3. X-ray Photoelectron Spectroscopy ... 54
II.2.3.1. Principle... 54
II.3. Optical characterizations ... 56
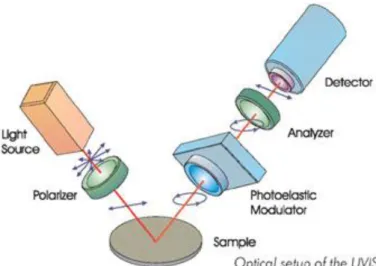
II.3.1. Ellipsometric spectroscopy ... 56
II.3.1.1.Experimental setup and principle ... 56
II.3.1.2. Spectrum modeling... 58
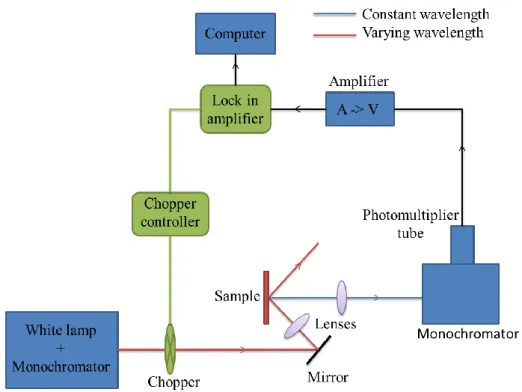
II.3.2. Photoluminescence Spectroscopy ... 60
II.3.2.1. General principle ... 60
II.3.2.2. Energy resolved photoluminescence spectroscopy ... 60
II.3.2.3. Energy resolved photoluminescence in excitation ... 62
II.3.2.4. Time resolved photoluminescence ... 63
II.4. Solar cell characterization ... 65
II.4.1. Photoconductance lifetime ... 65
II.4.1.1. Principle... 65
II.4.1.2. Experimental setup ... 66
II.4.2. External quantum efficiency measurement ... 66
II.4.3. I-V curves ... 68
II.5. Modeling ... 69
II.5.1. Access to optical parameters ... 69
II.5.2. Propagation of light emission in layered media ... 71
Bibliography ... 73
Chapter III: A study on SiNx and SiNx:Tb3+ layers ... 75
III.1.Introduction ... 75
III.2. SiNx Matrix... 75
III.2.1. Composition analyses ... 76
III.2.1.1.Preliminary results ... 76
III.2.1.2. Effect of the nitrogen ratio ... 79
III.2.1.3. Effect of the plasma pressure ... 80
III.2.2. Optical properties ... 83
III.2.2.1. Preliminary analyses ... 84
III.2.2.2. Experiments ... 86
III.2.2.4. Photoluminescence... 92
III.2.3. Conclusion ... 95
III.3. Terbium-doped Matrix, SiNx:Tb3+ ... 95
III.3.1. Effect of the plasma pressure and the nitrogen ratio ... 96
III.3.1.1. Composition analyses ... 96
III.3.1.2. Optical properties ... 98
III.3.2. Influence of the RF power density on the Tb target on the growth of SiNx: Tb3+ film 100 III.3.2.1. Composition analyses ... 100
III.3.2.3. Photoluminescence... 100
III.3.3. Conclusion ... 102
III.4. Study of the energy transfer ... 102
III.4.1. Energy transfer from the matrix to the terbium ... 102
III.4.1.1. Terbium non-resonant excitation ... 102
III.4.1.2. Transfer mechanism ... 104
III.4.2. Comparison with a previous study ... 105
III.4.3. Conclusion ... 107
III.5. Conclusion ... 108
Bibliography ... 109
Chapter IV: A study of the down-conversion process in the SiNx:Tb3+-Yb3+ and SiNx:Yb3+/SiNx:Tb3+systems ... 111
IV.1.Introduction ... 111
IV.2. SiNx:Tb3+-Yb3+monolayer system ... 112
IV.2.1. Structural analyses ... 112
IV.2.1.1. Effect of the annealing treatment ... 112
IV.2.2. Photoluminescence ... 116
IV.2.2.1. Effect of the terbium target power density ... 117
IV.2.2.2. Effect of the ytterbium target power density ... 118
IV.2.3. Other optical properties ... 120
IV.2.4. Conclusion ... 122
IV.3. Energy transfer and efficiency ... 122
IV.3.1. Energy transfer from the terbium ions to the ytterbium ions ... 122
IV.3.2. Down-conversion system efficiency ... 125
IV.3.2.1. Comparison with a previous study... 125
IV.3.2.2. Time-resolved photoluminescence and lifetime based efficiency ... 128
IV.3.3. Conclusion ... 129
IV.3. Multilayer system ... 130
IV.3.1. Principle ... 131
IV.3.2. Effects of the deposition parameters ... 131
IV.3.2.1. Terbium target power density ... 132
IV.3.2.2. Ytterbium target power density ... 133
IV.3.2.3. Terbium-doped sublayer thickness ... 134
IV.3.2.4. Ytterbium-doped sublayer thickness ... 135
IV.3.3. Composition properties ... 136
IV.3.3. Comparison with the monolayer system ... 136
IV.3.4. Conclusion ... 138
IV.4. Conclusion... 139
Bibliography ... 140
Chapter V: Application to silicon solar cells ... 141
V.1. Introduction ... 141
V.2. Prerequisite to the deposition on silicon solar cells... 142
V.2.2. Fabrication process ... 143
V.3. Adaptation of the fabrication parameters of our layers to the silicon solar cell system ... 145
V.3.1. 1st round -Efficiency improvement ... 145
V.3.2. Deposition and annealing temperatures studies ... 148
V.3.2.1. Annealing temperature adaptation ... 149
V.3.2.2. Deposition temperature adaptation ... 150
V.3.3. Conclusion ... 151
V.4. Improvement of the fabrication process ... 152
V.4.1.Study of the annealing temperature ... 152
V.4.2. Conclusion ... 155
V.5. Conclusion ... 155
Bibliography ... 156
Conclusion and perspectives ... 157
Annex 1: Matrix representation and formulation ... 161
Annex 2: Single emitter modeling... 165
Annex 3:List of the bonds between the Si, N, H, and O elements and their bands wavenumber in a SiOxNy:H material. ... 169
i
List of abbreviations
A
→
Absorbance A→
ActivatorAPTE
→
Addition de Photon par Transferts d’Energie AR→
Anti-reflectionCET
→
Cooperative energy transfer CTA→
Classical thermal annealing CZ→
CzochralskiDC
→
Down-conversion DS→
Down-shiftingEDP
→
Electrons diffraction patternsEDX
→
Energy-Dispersive X-ray spectroscopy EQE→
External quantum efficiencyESA
→
Excited State Absorption ET→
Energy transferETMM
→
Extended transfer matrix method ETU→
Energy Transfer Up-conversion FEG→
Field emission gunFIB
→
Focus ion beamFRET
→
Förster resonant energy transferFTIR
→
Fourier Transform Infrared SpectroscopyGIEC
→
Groupe d’experts intergouvernemental sur l’évolution du climat GSA→
Ground State Absorptionii
IQE
→
Internal quantum efficiency IR→
InfraredLO
→
Longitudinal optical modes ML→
MultilayerNIR
→
Near infraredOPO
→
Optical Parametric OscillatorPECVD
→
Plasma-enhanced chemical vapor deposition PIPS→
Precision ion polishing systemPL
→
Energy resolved photoluminescencePLE
→
Energy resolved photoluminescence in excitation PV→
PhotovoltaicPVD
→
Physical vapor deposition QC→
Quantum cuttingQE
→
Quantum efficiency R→
ReflectanceRBS
→
Rutherford Backscattering Spectroscopy RE→
Rare earthRF
→
Radio frequencyRTA
→
Rapid thermal annealingS. H. G
→
Second Harmonic Generation S→
SensitizerSC
→
Solar cellsccm
→
Standard Cubic Centimeters per Minute SEM→
Scanning Electron Microscopyiii
S-Q
→
Shockley-QueisserSTEM-EELS
→
Scanning Transmission Electron Microscopy- Electron Energy Loss Spectroscopy T→
TransmittanceTEM
→
Transmission Electron Microscopy TMM→
Transfer matrix methodTO
→
Transverse optical modes UC→
Up-conversionUV
→
Ultraviolet1
Introduction
The use of renewable energies (mainly solar and wind) has been increasing for the past several years as an alternative to fossil fuels. Their use has been limited by their high cost and/or still low efficiency. However, the trend is changing with lower cost and higher efficiency devices being developed. With the recently worldwide signed COP21 agreement aiming to keep the global temperature rise under 2 °C, the renewable energy sources will be even more used. Efficiency improvements have thus to be realized to meet the energy demand.
Solar energy is expected to contribute largely to the future energy supply. The commercial crystalline silicon (c-Si) solar cells that currently dominate the market operate with an energy conversion efficiency of at most 20 % for a price lower than 1 $/W since 2014 while the highest efficiency achieved in laboratory is of 27.6 % which is close to the Shockley-Queisser limit. The major issue leading to such low efficiency is the spectral mismatch (> 50 %) between the solar spectrum and the solar cell material bandgap. Indeed, the AM1.5 solar spectrum includes all photons between 300 and 2500 nm (corresponding to 0.5 to 4.4 eV) while the solar cell optimally used the photons close to their material bandgap. The final converted energy represents a small part of the available energy.
The cells are transparent to the photons with an energy below their material bandgap while absorbing the photons with an energy equal or higher than the material bandgap. However, the excess energy of the photons with an energy above the bandgap is transmitted to the lattice as heat, thus increasing the cells temperature and decreasing the cell efficiency in a so-called thermalization process. This loss of energy may be minimized either by adapting the cells to the solar spectrum, by employing a stack of cells with different bandgap energies called tandem cells, or by adapting the spectrum to the cells thanks to frequency conversion films such as, down-conversion, up-conversion, or shifting layers. Frequency conversion processes, and particularly the down-conversion one, thanks to trivalent rare earth ions are promising ways to improve the cells efficiency while keeping a low cost.
The down-conversion process allows to absorb one ultraviolet (UV) photon and emit 2 infrared (IR) ones, thus obtaining a quantum efficiency greater than 1. By choosing the right couple of rare earth ions, the photons with an energy of at least twice of the cells bandgap may be converted in photons of the bandgap energy. Thus the cell receives an increasing number of photons (2 times in the UV range) allowing the increase of the cell efficiency while decreasing the thermalization process.
This down-conversion process has already been achieved in various host matrices doped with various couple of rare earth ions. However, these matrices were not totally compatible with the silicon solar cells process.
Our team (NIMPH team) has already studied rare earth ions doping such as Er3+, Nd3+, Pr3+, Tb3+, and Yb3+ in different host matrices. A previous thesis by Y-T. An, was focused on the silicon oxynitride matrix (SiOxNy) doped with either the Pr3+/Yb3+ or the Tb3+/Yb3+ couple for
down-2
conversion process. Such Si-based matrix is compatible with the silicon solar cells and thus reduces production cost, but the oxygen it contains favors the rare earth ions clustering that we wish to avoid. Thus in this work, we choose the silicon nitride (SiNx) as a host matrix. The two rare earths
ions couples then studied present energy transfers compatible with the silicon solar cells application but only the second couple has showed promising results of a promising down-conversion process occurring. Thus, this second rare earth ions couple, Tb3+:Yb3+ is chosen for our work.
The main goal of this thesis is to develop a down-conversion layer having also anti-reflective properties that may be deposited on top of industrial solar cells to increase their efficiency. Other goals are to develop Tb-doped- and Tb-Yb co-doped- layers that have a higher PL intensity of the Tb3+ and Yb3+ peaks respectively than the Tb-doped- and Tb-Yb co-doped- SiOxNy layers
developed during the precedent work of Y-T An. The main challenge of this work is to optimize the deposition parameters (thus the composition and microstructure of the deposited layers) to achieve a layer with the highest Yb3+ PL peak intensity possible. For this purpose, the undoped matrix, followed by the Tb-doped layer is first studied before the Tb-Yb co-doped layer systems (monolayer and multilayer) are optimized. The optimized layers obtained are then compared to their SiOxNy counterparts before being deposited on industrial solar cells to determine the additional
efficiency achieved through down-conversion. The energy transfer mechanisms, between the matrix and the Tb3+ ions and then the down-conversion process from the Tb3+ ions to the Yb3+ ones are also studied.
In the first chapter, the bibliographic study will address the place of the solar cells in the current and future global energy supplies. Various solar cell concepts are introduced as well as their advantages and drawbacks. The mains reasons of the efficiency limit of the solar are detailed and various approaches to overcome this limit are presented among which the frequency conversion (down-conversion, down-shifting, and up-conversion) processes. The choice of the matrix and rare earth ion couple used is detailed. Additionally, the various energy transfers, between the matrix and the rare earth ions, between two rare earth ions, and the possible energy loss paths are exposed. In the second chapter, the experimental techniques used throughout this work will be detailed beginning by the fabrication process, followed by the characterization techniques, and ending by the modeling of our system. The first is composed of the deposition technique and the annealing process. The second encompasses the structural, composition, and optical characterizations as well as the characterizations specific to solar cells. The third describes the two models used to access optical properties and compare the layers transmission toward the cell efficiencies.
In the third chapter, the undoped- and Tb-doped- SiNx layers are studied. First the composition and
optical properties of the undoped layer are analyzed for various deposition parameters. This undoped layer is optimized to meet the criteria needed both for a down-conversion layer and an anti-reflective one. Second, the Tb-doped composition and optical properties are studied for various deposition parameters in order to optimize their Tb3+ PL peaks emission. The optimized layer is compared with a similar layer of SiOxNy:Tb3+ obtained in the previous Y-T An thesis work. The
3
In the fourth chapter, the Tb-Yb co-doped SiNx layer is studied. First a monolayer is developed and
its composition and optical properties studied to achieve the highest Yb3+ PL peak emission. Then a multilayer system is devised to act as a model where the rare earth ions concentration in each sublayers is better controlled. The system is optimized and compared to the monolayer one. The optimized monolayer layer is also compared with a similar layer of SiOxNy:Tb3+-Yb3+ obtained in
the previous thesis work. The energy transfer between the Tb3+ and Yb3+ ions is studied.
In the fifth chapter, the above mentioned optimized layers are adapted to the requirements of the silicon solar cells fabrication in an industrial process and deposited on such solar cells. Various parameters are studied to improve the efficiency of the cell but only one example is given that resume the difficulties encountered while going through the scaling from the laboratory experiment from the industrial application.
5
Chapter I: State of the art
In this first chapter, a brief introduction on the silicon solar cells (SC) overviewing their economic and historical backgrounds as well as their advantages and drawbacks will be followed by the origin of their efficiency limitations. Among the several approaches proposed to resolve those limitations, the spectral modification processes, particularly the down-conversion and down-shifting ones, attract our interest. Those processes are developed by doping a matrix with rare earth (RE) ions among which the energy transfer takes place. The principle of those processes is overviewed and the choice of the materials employed is explained. The various energy transfers and possible energy losses involved are then detailed.
I.1. Silicon solar cells
I.1.1. Background
The challenge of our century is to maintain the stability of energy supplies with the addition on the network of an increasing share of intermittent energy sources. In fact, the ever growing global population coupled with the raise of the global standard of living increase each year the energy consumption. The energy production has to be increased concurrently which gives rise to resources sustainability problems. Indeed, the main energy sources employed nowadays are fossil fuels that are known to have limited stocks. The current reserves may sustain the energy consumption growth for between tens and hundreds of years depending of the fossil fuel, oil being the most consumed and also the more limited. In addition, for more than twenty years scientists have been warning the world about the effect of the greenhouse gases that may induce a global warming. Nowadays, more and more people realize the need to decrease the emission of those greenhouse gases and particularly the CO2 one which is a byproduct of our principal energy
production processes.
Several ways to decarbonize the energy supply and consumption have been initiated these last years. Therefore actions are taken to save energy in both industry and domestic which entail improving the efficiency of the means of production but also of the consumption of energy. Energy saving allows for a lower growth of the energy demand or its stabilization in the future years depending of the scenarios given by the last GIEC report [1]. Renewable energies are also used to first meet this additional energy need and even substitute the fossil fuels in the long term. Thus, the worldwide investments on renewable energies represented the larger energy supply related investments [2] before the fossil fuels and the nuclear energy in 2014. Moreover, this same year, 8300 TWh of renewable energy were installed which represents almost half of the global energy supply increase. Those two axes will be reinforced following the rating by all the member states of
6
the COP21 goal, based on the last GIEC report [1]. The goal is to maintain an increase of global temperature bellow 2 °C.
However, renewable energies have to answer some requirements before being widely used. Renewable energies should have a price comparable with the ones of fossil fuels or nuclear energy to not impact the people finances. In addition the grid should remain stable even with the integration of intermittent energy sources. This point is difficult to satisfy with most of the renewable energy sources that are weather or daytime dependent. Currently the other energy sources (fossils, Nuclear, hydroelectric dam …) have to compensate the variation of the renewable energies by decreasing or increasing their own production rapidly (Figure I-1). In the future, efficient alternatives (batteries or other electrical, and mechanical storage devices [3]) in addition of hydroelectric dam have to be developed to integrate the renewable energies seamlessly to the grid. The efficiency of the production should also be increased to obtain more energy using less space and material.
Figure I-1: Example of the impact of intermittent renewable energies (here solar) on the grid; CSP stands for Concentrating Solar Power from [2].
Several renewable energies are used and/or may be developed (Figure I-1). The already most employed is the hydroelectric power that is very efficient and can compensate the irregularity of other renewable energy sources. However, the increase of the number of such structures is geographically limited. Come next the wind power and the solar photovoltaic (PV) that are intermittent because dependent of the weather or daytime. The concentrating solar power is more flexible but need a large surface. The geothermal power is used in some specific places but has huge cost of geologic drilling. The bioenergy can also be a solution in region producing a lot of agricultural byproducts but the coupling to the food market of the energy market may result in some food price increase crisis. Other renewable energies are in development such as wave power, tidal power, etc.
7
I.1.2. History
There are two different technologies using the solar energy to produce electricity, the thermal-, and the photovoltaic- solar.
In the thermal solar technic, mirrors concentrate the light on a specific area were a heat conductive fluid passes. The concentrated light heats this fluid which is then stocked in an insulating heat tank. The heated fluid can then be used anytime allowing a certain flexibility in the electricity production. The thermal solar technic is based on the same principle than used for fossil fuels. Here the heated fluid is used to heat water thus creating steam that will then drive a thermodynamic heat machine allowing the production of electricity [4]. The expansive cost of such structure coupled with the low efficiency of the technic and the need for a large surface prevent this technic to be widely used. In the photovoltaic solar technic, the solar illumination is used to create directly electricity thanks to the photovoltaic effect. The sunlight striking the cell causes the “release” of electrons and holes that generate an electric current. A photovoltaic panel presents several solar cells linked in parallel and serial which multiply the current and voltage obtained for one cell by the number of cells, hence increasing the total voltage and current obtained [5].
The photovoltaic effect was first mentioned by the French physicist Alexandre-Edmond Becquerel in 1839 [6,7] who found that certain materials produce small amount of electricity when exposed to light. The first practical solar cell was demonstrated in 1954 at Bell laboratories by Chapin et al. [8]. It is only in the 60s that solar cells began to be used in the space industry. From this point, the technology was really developed leading to an increase in efficiency and a decrease of the cost. The solar cells are usually described into three historical generations [9]:
- The first generation is principally composed of bulk silicon doped with phosphorus and boron creating N- and P-type materials, respectively, to form a P-N junction. The SC exhibits an efficiency from 15 to 20 % and constitutes the major part of the cell market especially on rooftops (85 % of the cells produced).They show a good stability with a lifetime of up to 50 years and a price of up to 3.5 $/W (Figure I-2).
- The second generation was aiming at decreasing the quantity of material used and thus the cost of the thin film cells was decreased to about 1.0 $/W. Amorphous silicon, cadmium telluride (CdTe), and copper indium gallium diselenide (CIGS) solar cells are the main cells of this generation. Those cells are thinner than the first ones and even flexible. However, their efficiency is lower, varying from 10 to 15 %.
- The third generation aims at increasing the cells efficiency above their thermodynamic limit with 1 sun while keeping a low cost, in most cases below 0.50 $/W. Several technologies are integrated in this generation and most of them are still ongoing researches. This generation is composed of a lot of technologies among which SCs using new materials but also multijunction cells that demonstrate efficiencies up to 45 % and are considered third generation even if their cost is really high (n times the price of a SC with n the number of junctions). Technologies that aim to increase indirectly the efficiency of the silicon solar cells are also a part of this generation. Those technologies have presently a lower efficiency but are very promising.
8 Figure I-2: Efficiency and cost projection for the first (I), second (II), and third (III) generation of
photovoltaic solar cells, from [10].
I.1.3. Advantages and drawbacks
Although renewable energies are still expensive and difficult to integrate in the energy grid because of their variability, year after year they constitute a bigger part of the energy production each year. The main advantage of those sustainable energies is to be environment friendly thanks to the absence of greenhouse gases emission while producing energy [11]. However, other points, playing an important part in the fast growth of the renewable energies, may be forward [12]. The leveled cost of those energies (initial and maintenance cost over a long period of time), particularly wind and solar energies, has been steadily decreasing in the recent years [13] thanks to technologic improvements.
Photovoltaic solar cell in particular has those characteristics but presents also some additional [14]. Indeed, solar cells use an energy source that has an infinite duration at our scale (sun life) and is accessible worldwide and in a large amount. Studies show that there is enough solar irradiation available to satisfy 10 times the global energy need [15]. SCs do not require any fuel to work and are silent. They are thus not polluting. SCs are simple to install (do not require drilling, etc.) whether it is to be used in electrical plants or put on individual roofs providing accessible electricity even in the most remote locations. However, the spot on which the solar panels are placed has to be carefully analyzed to avoid shadow, soiling, etc. In addition the production can only take place during the daytime and is very dependent of the weather. The light also heats the cell leading to a temperature increase. Unfortunately, the consequence is a decrease of the cell efficiency by 0.4 %/°C [16]. The development of SCs has to be coupled with the development of energy storage facilities and an adaptation of the grid to intermittent energy sources.
Several types of solar cells have been developed, but the most employed nowadays remains the silicon ones that have the advantage of using the same technology as the microelectronics which allows mass production. Those cells also offer the advantage of being nontoxic. The main drawback
9
of the silicon remains its low bandgap that does not allow the optimum use of the major part of the sun photons.
There are three types of silicon solar cells [14,17]:
- The monocrystalline silicon (c-Si) solar cells that have the best efficiency with 27.6 % (Figure I-3) obtained in laboratory. The cells currently on the market have a maximum of about 20 % efficiency. Those cells have a quite long lifetime of up to 50 years thanks to their low rate degradation. However, their fabrication process needs very high temperature and energy which make them quite expensive compared to other Si SCs (0.75 $/W [14]). This process also produces quite a lot of wastes such as silicon tetrachloride. The indirect bandgap of the monocrystalline silicon leads to a low optical absorption and thus a thickness of 125 μm is required to absorb 90 % of the incident light. Therefore, the cells are thick so use a lot of materials.
- The polycrystalline silicon (p-Si) solar cells present a lower fabrication temperature and produce fewer wastes that allow a cheaper production price (0.62 $/W). However, their efficiency is also lower, around 15 % with a record at 20.8 %.
- The amorphous silicon (a-Si) solar cells are lightweight thin film solar cells that may thus be deposited on flexible substrates and have a cost of 0.69 $/W. Those cells present a higher bandgap [18] and a higher photo absorbance that allow them to work even in low light conditions. However, their efficiency is really low (around 10 % with a record at 13.6 %) and their lifetime short, around 10 years.
10
I.2. Efficiency limitations
In this work we will focus on improving the silicon solar cells efficiency. However, to succeed in this task, one needs to understand the different loss mechanisms that take place in a solar cell. Based on this understanding, several ways to improve the efficiency will be detailed.
I.2.1. Shockley-Queisser limit
The first solar cells, as most of the solar cells on the market nowadays, are made of on silicon P-N junction. During the photovoltaic process many loss mechanisms may take place. Researches, since the first silicon solar cell demonstration in 1954 [8], have been conducted to improve the efficiency of solar cells. However, in 1961 Shockley and Queisser [20] calculated the theoretical maximum efficiency of a single junction solar cell using P-N junction and called Shockley-Queisser (S-Q) limit. Those calculations were based on the detailed balance principle of Pfann and van Roosbroeck [21]. This principle supposes that all the photons above the bandgap are completely absorbed and that carriers mobility is infinite allowing thus the carriers collection even if they are generated outside of the P-N junction space-charge zones. This implies an equivalent recombination rate everywhere in the cell, the bulk or the surface, and equal to the incident radiation exciting rate. S-Q limit also considers the solar cell as a blackbody that absorbs all light above its bandgap and none below. The cell has a refractive index of 1, a bandgap of 1.1 eV and operates at a temperature of 300 K under illumination of a blackbody at 6000K (the sun). With the assumptions that the illumination is made by unconcentrated sunlight, that one in-coming photon excites one electron/hole pair, and that the electron/hole pair energy in excess (higher than the bandgap) is relaxed thermally, the S-Q limit takes into account:
- The spectral mismatch [22] between the solar spectrum and the cell bandgap that have two components. First, the cell is transparent to the photons with an energy lower than the bandgap which represents a 18% efficiency loss (Figure I-4 (2)). And second, the photons with an energy above the bandgap are absorbed but have more energy than necessary for the electron/hole pair excitation. Those electrons (holes) relax to the conduction (valence) band edge by transferring the excess energy to the lattice via phonons [23] that will propagate in the lattice (process called thermalization see Figure I-4 (1)). This represents an efficiency loss of 38.2 %. Thus the spectral mismatch leads to an efficiency loss of around 56.2 %. - The radiative recombinations (Figure I-4 (3)) between two charge carriers of opposite sign
may occur anywhere in the cell. As an absorbed photon creates an electron/hole pair, the reverse (the recombination of an electron and a hole producing a photon) is also possible and reduces the efficiency by about 10 % for silicon.
11
The S-Q limit does not take into account the non-radiative recombinations. This calculation leads to an efficiency limit of 33.8 % at 1.1 eV. This limit shows that even if the photovoltaic process itself is perfect, the efficiency would be limited to 33.8%. A recent study by Tiedje et al. [24] implemented the S-Q limit for silicon cells taking into account the non-radiative recombinations. Those non-radiative recombinations account for about another 4 % efficiency loss decreasing to 29.8 % the silicon solar cells efficiency.
Figure I-4: Loss processes in a single junction solar cell: 1_lattice thermalization losses, 2_transparency, 3_recombinasion losses, 4_junction losses, and 5_contact voltage, from [25].
12
I.2.2. Other efficiency losses
In addition of the S-Q limit, other factors may decrease even more the cell efficiency. Resistive losses due to series and shunt resistances [26] contribute to up to another 7 % of the efficiency losses [27]. The series resistance may be due to the carriers motion through the P and N zones of the solar cell, the contact resistance (Figure I-4 (5)) between the metal contact and the silicon, and the resistance of the top and rear metal contacts. The shunt resistance (Figure I-4 (4)) is mostly due to fabrication defects that provide alternate current leak for the light generated current. Another factor is the reflection of the light at the surface of the cell that will not be absorbed and used by the cell (Figure I-5(a)). This factor counts for around 9 % efficiency loss [27].
Several approaches are currently applied to decrease those losses, for example:
- The optimization of the distance between the contacts lowers the resistivity losses. The metal contact grid should be tight enough to decrease resistivity but not so much as to increase the electrode shadowing effect that would decrease the light absorption in the cell. - Texturing the cell surface (Figure I-5(b)) will enable the reflected light to strike the cell
again instead of it going out directly, which reduces significantly the reflection. Different forms and structures of textures have been studied [28,29].
- Depositing an anti-reflection (AR) layer on top of the cell (Figure I-5(c)) will result in a net reflected energy equal to zero thanks to the destructive interferences between the beam reflected on the AR layer surface and the one reflected on the solar cell surface. The refractive index of the layer has to be between the one of the air (nair = 1) and the one of the
cell (nSi = 3.89 at 1.95 eV). In addition, the couple refractive index and thickness of the layer
have to be optimized for an optimal AR process. Models using up to three layers have been studied [30–33].
Figure I-5: Schematic of a) a bare solar cell/substrate, b) a textured solar cell/substrate, and c) a solar cell/substrate with an anti-reflection layer on top of it.
13
I.2.3. Exceeding the Shockley-Queisser limit
Most of the silicon solar cells available on the market are equipped with some of the above technologies which allow to reach 20 % efficiency for crystalline silicon solar cells. However, monocrystalline silicon solar cells displaying up to 27.4 % of efficiency have been developed in laboratory (Figure I-3). This value is very close to the S-Q limit of 29.8 %. This closeness shows the need to develop new technics to improve efficiency not by working directly on the cell itself but by finding indirect ways to go over the S-Q limit. Some of those currently research technics to go over the S-Q limit will be described below.
I.2.3.1. Multijunction cells
Figure I-6: (a) Schematic of a three-layer cell with tunnel junction. (b) Parts of the solar spectrum used by each of the three cells of the tandem cell from [36].
The S-Q limit calculation shows that over 50 % of the efficiency of a single junction solar cell is lost due to spectral mismatch between the solar spectrum and the solar cell bandgap. One way to improve the absorption of the light is to adapt the cell to the spectrum. For this purpose, multijunction solar cells [34,35] also called tandem cells were developed. Indeed, only the energy of the photons of similar wavelength than the bandgap of the cell (corresponding to a very small part of the solar spectrum) is totally used. Thus staking cells with different bandgap will increase the part of the solar spectrum for which the energy of the photons is totally used without losses. The cells are stacked according to the value of their bandgap with the larger on top and the smaller at the bottom (Figure I-6).The cells may be individual cells or connected in series. However, the cells must have compatible crystalline structures. They must also have the same current going through them. A tunnel junction has to be put between two cells to allow the electrons to flow in the same
14
direction between the cells without lowering the global voltage and to keep the electric fields of the cells separated.
This technic can increase greatly the solar cells efficiency as the maximum theoretical efficiencies calculated are 60 % and 72 % respectively for multilayer systems with 24 [37] and 36 [38] junctions with different bandgaps. The world record is currently held by Tibbits et al. [39] with a four-layer cell having a measured efficiency of 46.5 %. Those cells are though very expensive and employed only in space projects that favor lightness and efficiency over production cost, and in concentrator systems that need small surface device as the sun light is concentrated on this small area (0.3 to 1 cm² compared to the 25 cm² and more of a standard solar cell).
I.2.3.2. Spectrum conversion
In order to minimize the efficiency losses due to spectral mismatch, another approach may be developed. Instead of adapting the cell to the spectrum, it is the solar spectrum that will be adapted to the cell bandgap. For this purpose, optical frequency conversion technics may be used to fit the solar spectrum to the SC bandgap [40].
The cell is transparent for the photons having an energy below the SC bandgap. Thanks to the up-conversion (UC) process (Figure I-7), two photons with at least half the SC bandgap energy may be absorbed by a luminescent center which then emits a single photon with an energy higher than the SC bandgap energy that will hence be absorbed by the solar cell [41].The up-converters are placed at the rear part of the solar cell with a bottom/external reflector (Figure I-8).
The photons having an energy above the bandgap are absorbed. However the energy in excess of the carriers (higher than the bandgap) is lost in the lattice through a thermalization process. Moreover we already saw that the increase of the cell temperature decreases its efficiency. Two processes allow to absorb high energy photons before they reach the cell and to emit lower energy photons where the internal quantum yield of the cell is higher. The down-conversion (DC) process (Figure I-7) enables the absorption of one high energy photon leading to the emission of two photons with half the energy of the absorbed one. This process decreases the thermalization of photogenerated carriers while increasing the number of photons that the cell can absorb. The down-shifting (DS) process is similar to the down-conversion but leads to the emission of only one lower energy photon per higher energy absorbed photon and the remaining energy is dissipated non-radiatively [42]. This process allows a shifting of the spectrum toward a wavelength range where the cell is more efficient. The down-converters or down-shifters are placed at the front of the cell to tune the spectrum before it interacts with the cell (Figure II-8).
15 Figure I-7: The three mechanisms of the photon luminescent conversion processes [43].
Figure I-8: Diagram of an up-conversion (left) and down-conversion (right) setup [25].
When looking at the solar spectrum received on earth (AM1.5G) (Figure I-9), one can see that the fraction of the energy absorbed by a crystalline silicon solar cell, in green, represents 468 W/cm². Using up conversion layer would potentially allow to use another 164 W/cm² [25] corresponding to 35 % of the absorbed light. Using the down-conversion process will enable to use 149 W/cm² corresponding to 32 % of the absorbed light.
Figure I-9: Solar spectrum received on earth with the parts used by a silicon cell in green, possibly used by down-conversion (DC) in red, and possibly used by up-conversion (UC) in orange. Only
16
I.3. Down-conversion principle
I.3.1. History
In 1953, D. L. Dexter published his “theory of sensitized luminescence in solids” [44] that was an extension of the resonance theory of Förster [45] applied to solids. For Dexter this sensitized luminescence takes place between two impurities called sensitizer (S) and activator (A). S will absorbs light with certain wavelengths, undergo a Stoke’s shift (because of non-radiative relaxation-NRR- with lattice), and transfers this energy to A (Figure I-10 (b)). This last particle will, in turn, undergo a Stokes’s shift before undertaking a radiative or non-radiative transition. This way, A may emit even if its absorption range is different from the one of the exciting light. Indeed, it is S that will have an absorption range compatible with the one of the exciting light and will absorb the energy. As S emitting range encompasses at least to some extends the absorption range of A (Figure I-10 (a)), a dipole-dipole interaction occurs leading to the above mention process.
Figure I-10: Overlapping of S emission curves and A absorption ones (a) and schematic of the sensitizer-activator interaction (b).From [46].
A few years later, Dexter was the first to demonstrate the possibility of “luminescent quantum yield greater than unity” [47] happening between S and two A during such sensitized luminescence process. A quantum yield higher than unity may be achieved only in the case of S having three energy levels such that they are separated by an energy in the visible range and that the probability of radiative transitions between those levels is high (Figure I-11). It is important to note that for the “photon splitting” to take place, the two activators, A, to which the sensitizer energy is transferred have to be below a certain distance of S.
17 Figure I-11: Schematic of the sensitized luminescence process with a “luminescent quantum yield
greater than unity” described by Dexter [47].
The first authors to achieve experimentally such photon splitting also called quantum cutting (QC) were Piper et al.[48] and Sommerdijk et al. [49,50].The QC was obtained by doping a lattice of YF3
with a single rare earth ion (Pr3+). The rare earth ions, after absorbing UV photons, undergo a cascade emission (Figure I-12) leading to the emission of one or two photons of lower energy. They both prove two-photons luminescence from an UV excitation in fluoride doped praseodymium system (YF3:Pr3+). Phosphors doped with a single rare earth ions [51–53] present a high UV
absorption but a weak visible emission and UV and IR losses.
Figure I-12: Quantum cutting (photon cascade emission) for a single ion system, here the Pr3+ in YF3. From [54].
18
In 1999, the first system composed of a lattice doped with two rare earth ions -RE1 and RE2- (LiGdF4:Er3+) is published by Wegh et al. [55,56].This system allows for a still high UV absorption,
like the lattice with only one RE ion, but also, contrary to this later, for an enhanced visible and IR emission. The RE1ion absorbs photons in the UV range (blue arrow on Figure I-13) and transfers part of its energy to two RE2 ions leading to the emission of two visible photons (red arrows on
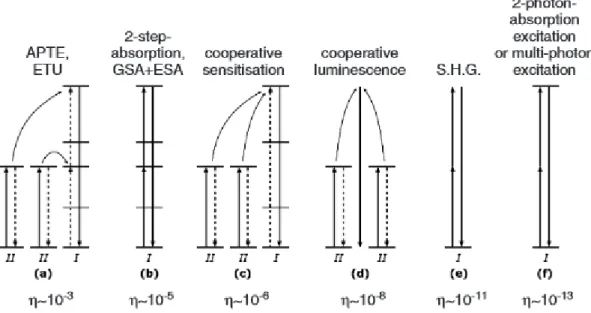
Figure I-13) of half the energy of the UV photon. As the above mentioned energy transfer mechanism has a reverse energy flow compared to the up-conversion energy transfer mechanism described by Auzel in 1990 [57], Wegh et al. called it down-conversion.
Figure I-13: Visible quantum cutting for a two ions system, here the Gd3+-Eu3+. From [55].
Wegh et al. also published a down-conversion system with three rare earths ions [58] where the first rare earth absorbs the UV photons and transmits part of its energy to the second ion. This second ion is used as “bridge” to transport the energy to two other ions that will emit visible photons. Figure I-14 describes this mechanism.
The first mention of down-conversion as a way to go over the S-Q limit and thus increase the solar cells efficiency was made by Trupke et al. [59,60] in 2002-2003. The authors proposed two solar cell/down-conversion layer configurations. The first one consists in putting the down-converters at the back surface of the cell. It was calculated that this method would increase to 39.6 % the solar cell efficiency, far higher than the S-Q limit. However, this method implies to develop new bifacial solar cells. The second one consists in depositing a down-conversion layer on the top surface of the cell. This method leads to a slightly lower efficiency of 38.6 % but allows to use any conventional solar cells. For obvious practical reasons, it’s the second configuration that has been developed up till now. In addition, those same authors explained that down-conversion is particularly efficient for 1.1 eV materials rendering this technic ideal for silicon solar cells.
19 Figure I-14: Visible quantum cutting for a three ions system, here the Er3+-Gd3+-Tb3+. From [58].
I.3.2. Rare earth ions in the down-conversion process
The rare earth ions have been rapidly and extensively used in luminescent devices [52,61]. The motivation of using rare earths comes from their very narrow emission band ranging from the near-infrared (NIR) to the ultra-violet (UV) thus allowing the production of blue, green, and red emission devices. Moreover, rare earth ions have also been used in laboratory for frequency conversion mechanisms and particularly in QC ones that lead to a quantum yield higher than unity that find some applications in lightning industries [54].
I.3.2.1. The rare earth elements
Rare earths are a group of metal elements including the scandium, the yttrium and the fifteen lanthanides elements. Despite their name, rare earths are relatively common in Earth’s crust as shown in Figure I-15.
In phosphors doped with optically active rare earths, the rare earths occur mainly in the trivalent form (RE3+). However, divalent (RE2+) and tetravalent (RE4+) forms may also be present. Those last forms tend to reduce the luminescence as they act as energy traps.
20 Figure I-15: Abundance of the chemical elements in the Earth’s crust. From [62].
The rare earths all have similar chemical and physical properties thanks to their very similar electronic structures. They all have an incomplete 4f electronic orbitals surrounded by 5s, 5p, and 5d complete outer electronic orbitals. The 5s, 5p, and 5d orbitals shield the inner 4f electronic orbitals from the crystal field. The rare earth ions have thus almost kept their atomic character which leads to f-f transitions relatively insensitive to their physical and chemical environment. In addition, the transitions between 4f levels are parity forbidden. However, in case of RE ions inside a matrix, the relaxation of selection rules allows the 4f transitions. Therefore, those RE ions have a low absorption cross-section (10-20 cm2 [63]) and a long life time (μs to ms [61]).
The 4f orbitals of the rare earths have been determined by Dieke [64] and Carnall et al. [65]; they are shown on Figure I-16 called Dieke diagram. We can see that the 4f energy levels of the rare earth ions in a matrix are widely distributed between UV and IR allowing absorption and emission in this whole wavelength range.
21 Figure I-16: Dieke diagram [64] with the energy of the silicon bandgap, the 2F5/2 energy level of
the ytterbium ion, twice the energy of the ytterbium, and the 5D4 energy level of the terbium ion
signaled by color lines.
Tb
3+Si bandgap
Yb
3+2X Yb
3+22
I.3.2.2. Review of the rare earth ions used for the down-conversion
Thanks to the Dieke diagram (Figure I-16) and the Judd-Ofelt theory [66,67], that allows to determine the possible transitions (radiative or non-radiative) for each rare earth ion and their probabilities, various rare earth ions have been selected to achieve QC.
The first studies on QC used a single RE ion,Pr3+ [48,49] or Gd3+ [53], that have three energy levels separated by the same amount of energy (Figure I-12). Following the same logic, Eu3+ [68] and Dy3+ [69] single RE ions were studied with different third generation solar cells technologies, resulting in solar cell efficiency improvement.
Most QC studies however used two kind of RE ions (Figure I-17). In this case, the first RE ion– RE1- has to have a transition with an energy above twice the energy of the secondary RE-RE2- transition. The first couple investigated was Gd3+-Eu3+ by Wegh et al. [55]. They proved that a two ions system is more efficient that a single ion one.
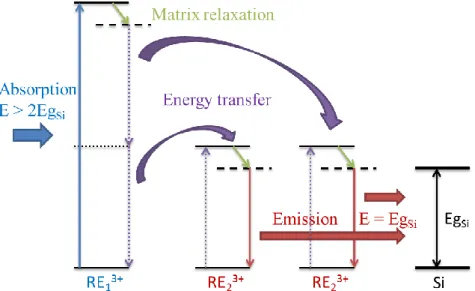
In the case of silicon solar cells, the selected RE ions couple should lead to the emission of photons with an energy equal to or just above the silicon bandgap (EgSi = 1.1 eV). Thus the RE2 (Figure
I-17) should have a transition with an energy slightly higher than the silicon bandgap to take into account the energy loss due to the matrix relaxation. In a similar way, the RE1 should have a transition with an energy slightly higher than twice the energy of the RE2 transition because of the matrix relaxation.
Figure I-17: Schematic of the energy transfers taking place in a down-conversion system applied to solar cells.
Many couples of RE ions have been investigated. Systems emitting in the visible range such as Gd3+-Eu3+ [55,70] or in the far IR range such as Er3+-Ce3+ and Nd3+-Ce3+ [71], or Er3+-Gd3+ (made for germanium SC) do not fit the silicon solar cell absorption energy. In order to work with the Si SC, the activator ion has to have an energy level just above 1.1 eV (below 1127 nm). Thus Yb3+ and Er3+ are good candidates. Among them, Yb3+ ion is the most used one due to its two levels system
23
configuration which limits cross-relaxations. By contrast, Er3+ ions have multiple energy levels and may therefore present cross-relaxations. Many couples may be formed with the ytterbium ions (see the Dieke diagram on Figure I-16).In the Pr3+-Yb3+ [72–75], and Er3+-Yb3+ [76–78] couples, the sensitizers have an intermediate energy level which may favor cross-relaxation and up-conversion energy loss processes. In the Tm3+-Yb3+ [79–81], Eu2+-Yb3+ [82], and Ho3+-Yb3+ [83]couples, the sensitizers have no exact intermediate energy level but many levels in between the levels used for the DC process which may favor multiphonon-relaxation energy loss processes. In the couple Tb3+ -Yb3+ [84–87], the sensitizer has no intermediate energy level which allows to avoid the above mentioned energy loss processes. In addition, the energy transfers take place between an excited energy level and the ground state instead of between two excited states that then may be relaxed non-radiatively to the ground state thus increasing thermalization. The Ce3+-Yb3+ [88] couple offers the advantage to have a higher absorption cross-section than the previous ones (10-18 instead of 10-21 cm² [89]) which favors the light involved in the DC process without the need of a sensitizer.
In this work, the couple Tb3+-Yb3+ that shows promising results [84,90] will be studied but in a different matrix than the previous works (see § I.3.3).
I.3.3. Matrix requirements
I.3.3.1. Silicon solar cell application
The QC systems studied till now were composed of a crystalline- [70,91,92], nanostructured- [77,90,93,94], or amorphous- [78,89,95–97] matrix doped with up to three kinds of rare earth ions that act as impurities [47]. In most of those systems, the matrix is not involved in the QC process. The matrix, as the host, is however chosen for its properties relevant for the specific application (lightning, SC, …). Richards, in 2004, listed the properties of luminescent DC materials (matrix + RE ions) required for lighting, display and photovoltaic applications [98]. All those properties depend on some level of the matrix used. Hence, in the case of photovoltaic applications, the matrix must be stable under high energy photon illumination (UV) and should not degrade during the device fabrication. Matrices should also play the part of antireflective layers with a reflective index between the ones of the air and of the cell (see § I.2.2). The matrix should not be toxic and allow for a recycling process.
As the studies focused on lighting applications such as plasma display and mercury-free fluorescent tubes, every kind of glasses have been developed as a host matrix for RE ions. Those glasses were mostly fluorides [22,55,70,77,86,87,97,99], borates [89,93,100,101], phosphors [80,84],etc. However, those glasses have a low stability under high energy photon illumination (UV) as well as during the solar cell firing process leading to defects formation such as trapped-hole color centers and electrons trapped by RE3+ transformed in RE2+ [102], and/or diffusion of dopants. Those defects play the role of traps for the photons. Most glasses also involve environmental and safety issues due to the presence of heavy metals like cadmium [103], or lead [78]. Thus, silicon oxide
24
[104] and silicon oxynitride [105] matrices that are compatible with the silicon solar cell fabrication process have been developed.
In this work an amorphous silicon nitride matrix, SiNx, free of oxygen will be studied. The absence
of oxygen allows for a higher RE ions concentration in the matrix before photoluminescence quenching [106]. SiNx offers the advantage of being largely used in microelectronics and especially
as reflective layers on actual silicon solar cells that eases the fabrication of both a DC and anti-reflective layer. This material is also highly compatible with the fabrication processes of the silicon solar cells. Silicon and nitrogen are also non-toxic and very common elements. The fact that the matrix is amorphous also decreases the chance of carrier recombinations that usually occur at the grain boundaries.
I.3.3.2. The sensitizing matrix
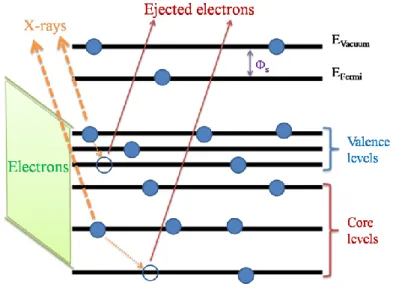
Richards shows that experimental external quantum yields are lower than the theory because of the poor absorption cross section of RE ions [98]. Indeed, most of the rare earth ions have a small absorption cross-section (around 10-20 cm² [63]) which decreases the efficiency of the system. In order to increase the absorption, a sensitizer has to be used. Such sensitizer has an absorption cross-section higher than the rare earth ions and will absorb the photons before transferring their energy to the ions. Two kinds of sensitizer have been described by Dexter. The first kind is a dopant that may be another rare earth that have higher absorption cross-section such as the Ce3+ (10-18 cm-1 [107]).They also have broader absorption and emission cross-section enabling an excitation and an energy transfer over a broader spectral range. They are then used in three rare earths systems [108,109]. The second is the matrix itself that have an absorption coefficient of around 103 cm-1 (at 0.8 eV) [110]. In this case the matrix should be chosen for its bandgap that must have an energy higher than the absorption energy of the selected rare earth ions. In that way, the matrix will absorb the photons in a wide range of energy and transmits easily the energy to the surrounding rare earth ions (at the RE energy of absorption). It is important to note that the ideal matrix should absorb the photons with an energy higher than twice the energy of the bandgap of the SC but be transparent for all the photons with a lower energy. Indeed, absorption of photons below this limit will decrease the cell efficiency under its usual efficiency without the DC layer [22].
In this work, we will use the silicon nitride, SiNx, that showed large emission due to defect states in
25
I.4. Energy transfers
Several energy transfer mechanisms in systems containing up to three rare earth ions have been reported. In this section, we will first review the energy transfer mechanisms from the matrix to the RE ions. The various energy transfers in between RE ions will then be described. Finally, the energy losses that might happen in such systems will be exposed.
I.4.1. Matrix to rare earth ions
As exposed above (§ 1.3.3. (a)), the 4f-4f transitions of the RE ions having a low absorption cross-section, a more effective excitation of those transitions is obtained by using matrix-assisted excitation via energy transfer. In silicon nitride matrices, SiNx, free of Si clusters, the origin of the
sensitization towards the RE ions are mainly the band tails and the deep states in the bandgap that have a much higher absorption cross-section than the 4f-4f transition direct excitation of the RE ions.
Figure I-18: (a) Density of states of the different defects and their energy, from [104]. (b) PL spectra normalized to the peak intensity for various R ([N]/[Si] ratio), from [113].
The SiNx matrix, as an amorphous dielectric material, shows local fluctuations in the interatomic
distances and the bonding angles which create localized states near the band edges capable of trapping the charge carriers. Those localized states leads to band tails with exponential shape density of states extending in the bandgap [114]. The matrix also contains structural defects that are broken or unsaturated bonds such as dangling bonds (≡Si- ,≡Si0 , =N-) and the unit (≡Si-Si≡ , =N20 ,
=N4+) [111]. Those defects create distinct energy states inside the bandgap of SiNx. Levels may be
localized near the conduction and/or valence bands thus extending their states that are then called localized states (Figure I-18). Levels may also be localized in the middle of the bandgap creating what are called deep states.
(b) (a)
26
The SiNx matrix containing Si or N excess has been widely studied [115–117]. It has been
demonstrated [111,112,118–120] that the defects due to the disorder of the non-stoichiometric material create various states (Figure I-18 (a)):
- the ≡Si-Si≡ σ and σ* centers levels situated just in the gap at 0.4 eV and 5.0 eV, respectively - the =N- centers level situated at 0.5 eV
- the =N20 centers level situated at 1.8 eV
- the ≡Si0 centers level situated just above midgap at 2.7 eV
- the ≡Si- centers level situated below the conduction band at 3.0 eV - the =N4+ centers level situated at 3.6 eV
It has been shown that by tuning the material composition and particularly the [N]/[Si] ratio, the width of the band tails may be monitored [116,121,122]. Wang et al. [113] and Kistner et al. [123] have demonstrated that by varying the nitrogen content, the disorder of the matrix may be increased (Figure I-18 (b)) which leads to the creation of deeper band tail states and a shift in the PL emission.
This tuning of the band tails width may be used to obtain a matrix emission that overlap the RE ions energy absorption band. Previous studies on Erbium-doped systems have proven that: first, the band tails can transfer energy within a broad spectral range from 2 to 4 eV directly to the Er3+ ions [124], and second, that the band tails excitation of Er3+ ions is prevailing for a material annealed at lower temperature than 1050°C (at higher temperature the excitation via Si-nanoparticles is dominant) [125].
I.4.2. Rare earth to rare earth transfer (dipole)
I.4.2.1. Energy transfer between rare earth ions
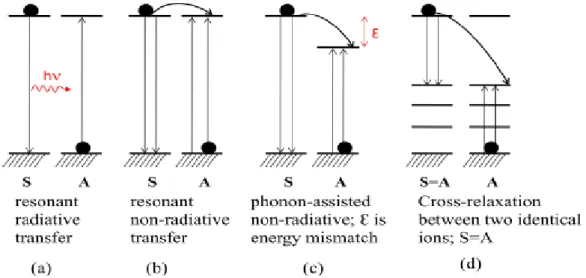
Several energy transfer mechanisms may take place between rare earth ions. Such mechanisms have been described by Auzel [57] and are shown on the Figure I-19. Those mechanisms involve the energy transfer from a sensitizer, S, to an acceptor, A, following different mechanisms:
- The resonant radiative energy transfer in which S emits a photon that will then be absorbed by A (Figure I-19 (a)). In this case the lifetime of S remains constant with the concentration increase of A.
- The resonant non-radiative energy transfer in which S excites A by a non-radiative channel (Figure I-19 (b)). In such case, the lifetime of S is strongly dependent of the concentration of A as the non-radiative transitions contribute to depopulate the excited energy levels.
![Figure I-4: Loss processes in a single junction solar cell: 1_lattice thermalization losses, 2_transparency, 3_recombinasion losses, 4_junction losses, and 5_contact voltage, from [25]](https://thumb-eu.123doks.com/thumbv2/123doknet/12852052.367959/26.892.179.709.300.528/figure-processes-junction-lattice-thermalization-transparency-recombinasion-junction.webp)
![Figure I-13: Visible quantum cutting for a two ions system, here the Gd 3+ -Eu 3+ . From [55]](https://thumb-eu.123doks.com/thumbv2/123doknet/12852052.367959/33.892.233.674.307.600/figure-i-visible-quantum-cutting-ions-gd-eu.webp)