HAL Id: hal-00318243
https://hal.archives-ouvertes.fr/hal-00318243
Submitted on 21 Dec 2006
HAL is a multi-disciplinary open access
archive for the deposit and dissemination of
sci-entific research documents, whether they are
pub-lished or not. The documents may come from
teaching and research institutions in France or
abroad, or from public or private research centers.
L’archive ouverte pluridisciplinaire HAL, est
destinée au dépôt et à la diffusion de documents
scientifiques de niveau recherche, publiés ou non,
émanant des établissements d’enseignement et de
recherche français ou étrangers, des laboratoires
publics ou privés.
sawtooth events and isolated substorms at
geosynchronous orbit with GOES data
X. Cai, M. G. Henderson, C. R. Clauer
To cite this version:
X. Cai, M. G. Henderson, C. R. Clauer. A statistical study of magnetic dipolarization for sawtooth
events and isolated substorms at geosynchronous orbit with GOES data. Annales Geophysicae,
Eu-ropean Geosciences Union, 2006, 24 (12), pp.3481-3490. �hal-00318243�
Ann. Geophys., 24, 3481–3490, 2006 www.ann-geophys.net/24/3481/2006/ © European Geosciences Union 2006
Annales
Geophysicae
A statistical study of magnetic dipolarization for sawtooth events
and isolated substorms at geosynchronous orbit with GOES data
X. Cai1, M. G. Henderson2, and C. R. Clauer1
1Department of Atmospheric, Oceanic and Space Sciences, University of Michigan, Ann Arbor, Michigan, USA
2Los Alamos National Laboratory, Los Alamos, New Mexico, USA
Received: 5 April 2006 – Revised: 30 October 2006 – Accepted: 10 November 2006 – Published: 21 December 2006
Abstract. We investigate whether the dipolarization process
during sawtooth events is global or not through an examina-tion of the local time distribuexamina-tion of the magnetic tilt angle (i.e. the angle between the B vector and the equatorial plane in dipole VDH coordinates) at geostationary orbit. From the statistical analysis of 207 individual teeth and 212 isolated substorms, we find that individual teeth follow a dipolariza-tion pattern similar to that observed for isolated substorms. The dipolarization for individual teeth initiates in the sector between 22:00 magnetic local time (MLT) and 00:00 MLT. Then the dipolarization expands both eastward and west-ward. However, relative to isolated substorms, we find that the nightside magnetosphere is much more stretched prior to the onset, and the change of the tilt angle during the dipo-larization process is much larger during individual teeth. The magnetic dipolarization is seen over a wider local time sector during individual teeth than during isolated substorms. How-ever, the magnetic dipolarization is rarely observed near local noon during individual teeth. This suggests that the magnetic dipolarization process during individual teeth is still confined primarily to the nightside.
Keywords. Magnetospheric physics (Magnetosheath;
Mag-netospheric configuration and dynamics; Storms and sub-storms)
1 Introduction
Sawtooth events are so named due to their global and pe-riodic variations, i.e. slow decreases followed by rapid in-creases, in the (>50 keV) energetic proton fluxes measured at geosynchronous orbit by the Synchronous Orbit Particle Analyzer (SOPA) instruments on the Los Alamos National Laboratory (LANL) geosynchronous satellites (e.g. Belian et
Correspondence to: X. Cai
al., 1995; Henderson et al., 2006; Borovsky et al., 20061). The periodicity is approximately 2–4 h.
It is generally accepted that the gradual decrease and rapid increase (i.e. particle injection) in energetic particle fluxes near local midnight at geosynchronous orbit is a typical fea-ture of magnetospheric substorms (e.g. Sauvaud and Winck-ler, 1980). During substorms, a change in the magnetic field configuration is also observed which consists of a gradual stretching and rapid dipolarization at geosynchronous orbit (e.g. Cummings et. al., 1968; Kokubun and McPherron, 1981; Walker et al., 1976; Erickson et al., 1979). A super-posed epoch study by Swanson (1978) showed that a statis-tical relationship exists between the energetic particle flux variation and the H component of the magnetic field change. The sudden increases in the particle fluxes correspond to the rapid increase in the magnitude of the H component. Dur-ing a substorm growth phase, the decrease in particle fluxes corresponds to the thinning of the plasma sheet (e.g. Reeves et al., 1996). The nightside magnetic field lines become stretched and tail-like. After the onset of substorm expan-sion phase, the increase in particle fluxes correspond to the dipolarization that occurs during the unloading process. The particle injection is also found to be localized near the mid-night sector (e.g. Belian, 1978). Cummings et al. (1968) showed that during the two substorms they examined, the H component of the magnetic field was decreased and the in-clination was radially outward in the dusk-to-midnight
quad-rant. However, the distortion of the magnetic field was
not observed in other local time sectors. From a statistical study of 194 substorm events, Nagai (1991) found that the dipolarization initiates in a narrow region centered around 23:30 MLT. The dipolarization spreads both eastward and 1Borovsky, J. E., Nemzek, R. J., Smith, C. W., Skoug, R. M.,
and Clauer, C. R.: The solar-wind driving of periodic substorms and global sawtooth oscillations: What determines the periodicity?, Ann. Geophys., submitted, 2006
02:44 03:14 03:44 04:14 04:44 05:14 05:44 40
60 80
Tilt angle, degree
21:50 22:20 22:50 23:20 23:50 00:20 00:50
Sec.10 Sec.11 Sec.0
UT MLT (a) -2.0 -1.5 -1.0 -0.5 0.0 0.5 1.0 40 60 80 Tilt angle,degree Sec.10 (20 MLT - 22 MLT) (b) -2.0 -1.5 -1.0 -0.5 0.0 0.5 1.0 40 60 80 Tilt angle,degree Sec.11 (22 MLT - 00 MLT) (c) -2.0 -1.5 -1.0 -0.5 0.0 0.5 1.0 40 60 80 Tilt angle,degree Sec.0 (00 MLT - 02 MLT) (d)
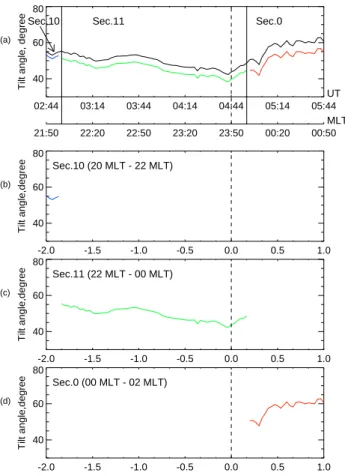
Fig. 1. An example shows the superposed epoch methodology that
is applied to each event used in the averaging process. The top panel shows a 3-h variation of the tilt angle in black. The magnetic local time is also shown beneath the universal time. The vertical dashed line marks the onset time and two vertical solid lines divide the interval into three parts according to the local time. The different parts are marked in three different colors.
westward. Tsagouri et al. (1996) found the averaged
west-ward and eastwest-ward propagation speeds are 0.48◦/min and
0.93◦/min, respectively.
Since the individual teeth in most sawtooth events look similar to magnetospheric substorms in the energetic particle data, there is a debate as to whether an individual tooth is just an intense form of a magnetospheric substorm or a pre-viously unknown phenomenon that operates globally in a coherent manner. Some recent investigations of sawtooth events have determined that the individual teeth are similar to magnetospheric substorms, as described by McPherron et al. (1973). For example, Henderson et al. (2006) examined the magnetic field tilt angle (which they defined as the angle between the vector B and the equatorial plane in Geocen-tric Solar Magnetospheric (GSM) coordinates), using GOES data for the 18 April 2002 sawtooth interval, and found that the region which experienced field stretching and dipolariza-tion spans a larger local time sector and sometimes extended past the terminators into the dayside. However, the largest
dipolarization is typically observed when the satellite is ap-proximately in the pre-midnight sector. They argued that the dipolarization process during individual teeth is still approxi-mately confined to the nightside. Borovsky et al. (2006)1 sta-tistically analyzed the magnetic-field rotation angle – which they defined as the final magnetic tilt angle minus the initial magnetic tilt angle – for 181 teeth from 1986 to 2002 using GOES data. They concluded that the rotation angle for indi-vidual teeth is smaller at local noon than it is on the nightside but they did find signatures on the dayside.
It is still an open question as to whether the magnetic dipo-larization during individual teeth is global or not. Specifi-cally, it is not clear to what extent the magnetic dipolariza-tion process occurs on the dayside magnetosphere (i.e. sun-ward of the terminator). The answer to this question may be crucial in determining whether an individual tooth should be considered a substorm or not. A direct method to answer this question would be to examine the global behavior of the magnetosphere during individual teeth – however, this is not possible for any given individual event due to the limited number of spacecraft available. In this paper, we undertake a statistical investigation of the averaged local time – universal time distribution of the magnetic tilt angle during individual teeth and during isolated magnetospheric substorms, using GOES magnetometer data at geostationary orbit. Then the local time extent of dipolarization process and the changes in tilt angle are investigated in detail using a superposed epoch technique.
2 Data and methodology
The magnetic field data is measured by magnetometers on-board the Geostationary Operational Environmental Satel-lites (GOES). Normally, there is one GOES satellite situated over the east coast of North America (at ∼75◦W geographic longitude) and one situated over the west coast (at ∼135◦W geographic longitude).
The GOES magnetic field data are converted from space-craft coordinates into the dipole VDH coordinate system. The H axis is parallel to the Earth’s dipole axis and is pos-itive northward. The D axis is perpendicular to the H axis and the radial position vector of the satellite. The D axis is positive eastward. The V axis completes a right-handed or-thogonal set and is positive outward. The magnetic tilt angle in this paper is defined as θ = tan−1(H /√V2+D2), therefore 0◦indicates tail-like magnetic field orientations and 90◦ in-dicates dipole-like field orientations.
In previous studies, the magnetic tilt angle is only shown as a temporal variation. Since the satellites are located at dif-ferent local times during each event, it is difficult to compare the measurements between the two events. It is also impos-sible to obtain a global picture of the dipolarization process at a certain time for a single event.
X. Cai et al.: Magnetic tilt angle for sawtooth and substorm 3483 To overcome this limitation, we obtain the global spatial
distribution by modifying the averaging method applied in Nagai (1982, 1991). In this method, the average magnetic field variations at each local time are obtained by Super-posed Epoch Analysis (SEA). Nagai (1991) only examined the local time sectors from 18:00–03:00 MLT, including local midnight, where substorm dipolarization occurs more than 80% of the time. We extend the local time sectors to global coverage, as we are also interested in the behavior of the magnetic field on the dayside of the magnetosphere.
Figure 1 gives an example of our methodology. Here we show the magnetic tilt angle calculated from GOES 8 for one isolated magnetospheric substorm which occurred on 28 June 1997. The onset of the expansion phase of the sub-storm is 04:44 UT, based on ground magnetic disturbance. First, we divide local time into 12 sectors, each 2 h wide (e.g. sector 0 is from 00:00 MLT to 02:00 MLT). Second, as the stretching phase is generally longer than the dipolarization phase (e.g. Swanson (1978) showed that the typical durations for the two phases are 40 min and a few minutes) and the typical period for individual teeth is 3 h, we examine the tilt angle variation from 2 h before the onset to 1 h after the on-set for the superposed events (the dipolarization onon-set is the key time or “zero-epoch” time). The universal time bin size is 2 min. The tilt angle at the onset time is specifically put into one bin. Therefore, the number of universal time bins is 91 for each universal time interval. Third, we convert tempo-ral variations into spatial variations. As shown in panel (a) of Fig. 1, we plot 3 h of variation of the tilt angle from 02:44 UT to 05:44 UT. This is a time series. As GOES is a geostation-ary satellite, a time series can be easily converted into a spa-tial variation series. The magnetic local time is calculated as
MLT =(φsatellite−φSun)/15.0−12.0, where φsatelliteand φSun are the longitudes of the satellite and the Sun measured in the geomagnetic coordinate system. In this case, the mag-netic local time is from 21:50 MLT to 00:50 MLT. Based on the local time, the tilt angle measurements are divided into three different sections which are highlighted as three differ-ent colors. The first section with magnetic local time from 21:50 MLT to 22:00 MLT is put into sector 10, as shown in panel (b) of Fig. 1. Each data point is binned again into 91 bins based on the relative time from onset. For example, the tilt angles at 21:50 UT and at 21:51 are binned into univer-sal time bin 0, in sector 10. Similarly, the second and third sections are put into sectors 11 and 0, as shown in the bot-tom two panels of Fig. 1. The same procedure is applied for all individual teeth and isolated substorms. Finally, in each universal time bin in one local time sector, we have a data array of tilt angles at this specific local time and universal time relative to the onset. The averaged tilt angle is obtained by calculating the mean value of the data array. If there is no data in this bin, the tilt angle is spatially linear interpolated.
In this methodology, we combine the data from east-ern GOES spacecraft (∼11◦magnetic latitude) and western GOES spacecraft (∼5◦magnetic latitude), to improve
statis-tics, though the variations are slightly different due to the dif-ferent magnetic latitudes of each spacecraft. This is similar to the approximation used by Nagai (1982; 1991).
In the statistical study of the solar wind drivers for saw-tooth events, Borovsky et al. (2006)1 found that sawtooth events are usually associated with magnetic cloud events in the solar wind, where Bzis strong and southward, and vBs
is large and steady. Therefore, it is possible that the dayside magnetosphere could be pushed inside of the geostationary orbit. When this happens, the geostationary satellites re-side in the dayre-side magnetosheath. Such intervals, when the GOES spacecraft are located in the dayside magentosheath, must be excluded from our analysis.
Song et al. (1990) examined the structure and properties of the magnetopause for southward interplanetary magnetic field with ISEE satellite observations. There is an abrupt change from the south magnetic field in the magnetosheath to the northward magnetic field in the magnetosphere, due to the Chapman-Ferraro current. There is also a boundary layer between the Chapman-Ferraro current sheet and the magne-tosphere, separating the magnetosheath-like plasma from the magnetospheric plasma. Both plasma data and magnetic field data are necessary to determine the magnetopause crossing. However, since there is no direct measurement of the plasma density from GOES, we just use the magnetic field data from GOES to estimate the magnetopause crossing. The typical thickness of the magnetopause is ∼800 km (Berchem and Russell, 1982). Then the typical time for the geostationary satellite to cross the magnetopause is ∼ 4 min, assuming a stationary magnetopause and that the satellite orbit velocity is normal to the magnetopause. While this is an oversimplifi-cation, we also inspect the variations of the three components of the magnetic field for each event, we exclude the intervals when the satellite measures abrupt northward turnings in the
Hcomponent of the magnetic field around the dayside mag-netosphere, including an extra 5 min before and after for the satellites to cross the magnetopause.
In this study, we include 42 sawtooth intervals which con-tain 207 individual teeth between January 1998 and De-cember 2002. We identify sawtooth events using the same method as Cai et al. (2006). Sawtooth events are identified using high resolution (10 s) energetic proton flux data from the LANL satellites. Our selection criteria require: 1) at least one satellite near local noon (±3 MLT h from local noon) and one near local midnight (±3 MLT h from local midnight); 2) the particle injection to be observed quasi-globally (i.e. around all local time regions at geosynchronous orbit). We also apply the same analysis to 212 isolated substorms dur-ing the same period for comparison. We only examined sub-storms from 15 days before the equinox/solstice to 15 days after the equinox/solstice each year. The number of isolated substorms will definitely increase if we include substorms in 12 months instead 4 months of each year. However, the cur-rent number of isolated substorms is adequate for the present
statistical study. Isolated magnetospheric substorms are
Sec. 6 12 - 14 MLT Sec. 7 14 - 16 MLT Sec. 8 16 - 18 MLT Sec. 9 18 - 20 MLT Sec.10 20 - 22 MLT Sec.11 22 - 24 MLT Sec. 0 0 - 2 MLT Sec. 1 2 - 4 MLT Sec. 2 4 - 6 MLT Sec. 3 6 - 8 MLT Sec. 4 8 - 10 MLT Sec. 5 10 - 12 MLT 200 -2. -1. 0. 1. Hour Noon Dusk Dawn Noon Midnight Isolated substorms Sec. 6 12 - 14 MLT Sec. 7 14 - 16 MLT Sec. 8 16 - 18 MLT Sec. 9 18 - 20 MLT Sec.10 20 - 22 MLT Sec.11 22 - 24 MLT Sec. 0 0 - 2 MLT Sec. 1 2 - 4 MLT Sec. 2 4 - 6 MLT Sec. 3 6 - 8 MLT Sec. 4 8 - 10 MLT Sec. 5 10 - 12 MLT -2. -1. 0. 1. Hour Individual teeth
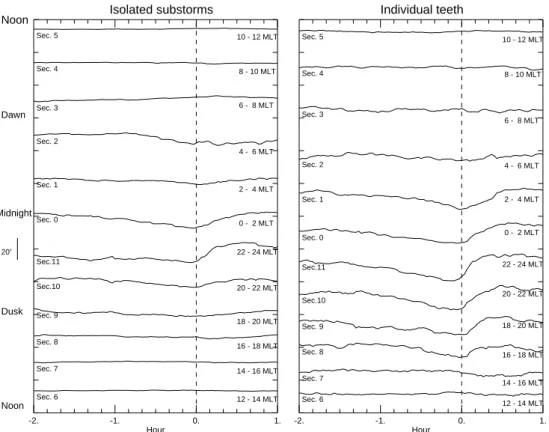
Fig. 2. Stackplots of the average magnetic tilt angle variations for isolated substorms (left) and individual teeth (right) in each sector.
Universal time is shown on the X axis where 0 is the onset time. The dashed vertical line is the onset time. Local midnight is in the middle while local noon is on the top and the bottom. The tilt angle is shown in an absolute scale that is identical for both panels.
identified by their mid-latitude features (Clauer and McPher-ron, 1974). An isolated magnetospheric substorm is defined as: 1) positive mid-latitude perturbations in the northward geomagnetic field component measured by ground magne-tometers near local midnight; 2) clear, field-aligned currents in the eastward geomagnetic field component (i.e. clear sub-storm current wedge) and 3) no perturbation at least 1 h be-fore the substorm expansion phase onset time.
During 19 out of 207 individual teeth, the GOES space-craft are found in the dayside magnetosheath. These teeth are excluded in our statistical study.
3 Results and discussion
3.1 Isolated substorms and individual teeth
Stackplots of the dipolarization process in each local time sector for isolated substorms and individual teeth are shown in Fig. 2. For isolated substorms (left panel), the dipolar-ization is clearly seen in sectors 10, 11, and 0 (20:00 MLT– 02:00 MLT). It is most prominent in sector 11 (22:00 MLT– 00:00 MLT). The dipolarization in sector 10 and sector 0 starts several minutes after sector 11, which implies that the dipolarization starts first in the pre-midnight sector. This
agrees with the results of Nagai (1991), who found that the dipolarization near 22:00 MLT and 01:00 MLT starts 5 min after the dipolarization initiates at 23:30 MLT. From sec-tor 3 to secsec-tor 9, which covers local times 06:00 MLT to 20:00 MLT including local noon, there is no variation ob-served. Only small magnitude fluctuations are observed in sectors 1 and 2. This clearly shows that for isolated sub-storms the averaged magnetic dipolarization is localized and confined to the pre-midnight sector. For individual teeth (right panel), the dipolarization is seen from sector 8 to sec-tor 1 (16:00 MLT–04:00 MLT), comprising 12 h of MLT across local midnight. The process is most prominent in sec-tor 11 (22:00 MLT–00:00 MLT). The dipolarization process is observed to occur about 5 min earlier in sector 11 than other sectors, which is similar to what we found for iso-lated substorms. The dipolarization initiates in the same sec-tor (22:00MLT–00:00 MLT) as that found for isolated sub-storms. It then expands both eastward and westward. There are also only small magnitude disturbances in sectors 2 and 7. However, there is no clear signature of the magnetic dipo-larization in other sectors (04:00 MLT–16:00 MLT, including the local noon sector). Therefore, the dipolarization process during individual teeth is not global but does have a wider local time coverage than that during isolated substorms.
X. Cai et al.: Magnetic tilt angle for sawtooth and substorm 3485 To further illustrate the magnetic tilt angle distributions,
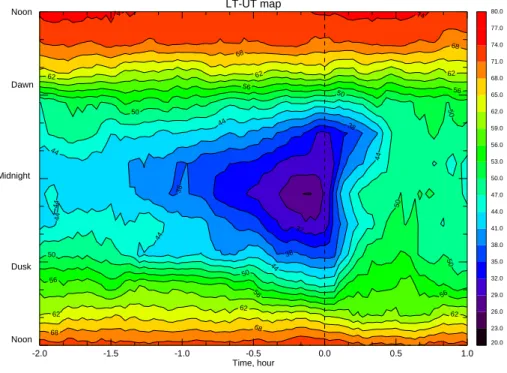
we plot the superposed results as a function of local time and universal time (LT–UT). This technique is widely applied in ground magnetometer data analysis (e.g. Clauer and McPher-ron, 1974; Clauer et al., 2003). As shown in Figs. 4, during the stretching phase of the dipolarization process of individ-ual teeth, the magnetic tilt angle near local midnight is much smaller (∼26◦) than that during isolated substorms (∼43◦) shown in Fig. 3. This shows that the nightside magneto-sphere is more stretched during individual teeth. We also examined the change from the maximum tilt angle in the 20 min after onset to the minimum tilt angle in the 10 min before onset. The maximum difference is 24.4◦for individ-ual teeth and 14.9◦ for isolated substorms. The change in the tilt angle of the individual teeth is slightly larger than that of the isolated substorms. For the dayside magneto-sphere, the magnetic field lines are slightly more stretched, on average, during individual teeth than those during isolated substorms. However, the magnetic tilt angles in the local noon sectors (10:00 MLT–14:00 MLT) are approximately the same. During the entire dipolarization process, the tilt angles near local noon are ∼77◦and ∼75◦during the isolated sub-storms and individual teeth, respectively. The whole magne-tosphere during the dipolarization process of individual teeth is more stretched than during isolated substorms. Again, the LT–UT maps confirm that the magnetic dipolarization pro-cess during an individual tooth is still most prominent in the pre-midnight sector with a wider local time extent.
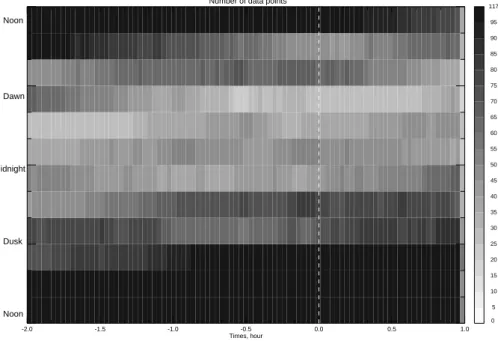
The number of data points in each bin for the statistical studies is showen in Figs. 5 and 6. We find that there are more data points around local noon than at other local times for isolated substorms. We suggest this is due to the uneven distribution of ground magnetometers, as shown in Fig. 7, and the method we used to identify isolated substorms. Our criteria require that the mid-latitude features for isolated sub-storms be observed by a number of magnetometers near local midnight. As shown in Fig. 7, there are a few magnetome-ters in the Pacific Ocean, which is west of the western GOES spacecraft, and in the Atlantic Ocean, which is east of eastern GOES spacecraft; it is possible that isolated substorms which occur when the oceans are near local midnight are underes-timated. This is evidently indicated in the post-midnight re-gion, as the light color shaded area in Fig. 5, due to the Pacific Ocean. However, as the minimum number of data points is 15 in Fig. 5, our statistical study for isolated substorms is still valid. For individual teeth, there are slightly more data points around local midnight than local noon for individual teeth. This is expected, as we exclude some teeth when GOES was in the dayside magnetosheath. As the smallest number of data points is 15 in Fig. 6, we have confidence in our statisti-cal study.
Borovsky et al. (2006)1 claimed that the magnetic field signatures near local noon are observed less frequently than at other local times due to two factors: 1) the signature is small and difficult to observe during noisy, storm-time
con-ditions; 2) the satellites are in magnetosheath on the dayside. In our analysis, the averaged tilt angle is obtained by SEA, which is widely used to reduce the noise level and to obtain common features for a quasi-periodic phenomenon. For each category, we have at least ∼180 events. So, if the dipolariza-tion signature is common in the dayside during individual teeth, it should be seen in the SEA results. Moreover, inter-vals when the satellites are in the dayside magnetosheath are excluded in our analysis. We find no clear signature of mag-netic dipolarization on the dayside. Therefore, we suggest the magnetic dipolarization is not global, on average, during individual teeth (but perhaps can be during a small number of rare events).
3.2 The first tooth and all subsequent teeth
The statistical study in Sect. 3.1 shows that before the on-set time, the whole magnetosphere – especially the nightside magnetosphere – is more stretched during individual teeth than during isolated substorms. The inner magnetosphere is, on average, much more stretched during an interval of indi-vidual teeth. We want to determine if this is true, in general, for the first event in a sequence of sawtooth events. There-fore, we have examined the magnetosphere for the first tooth in the sawtooth interval and for all subsequent teeth. There are 40 “first” teeth and 148 “subsequent” teeth.
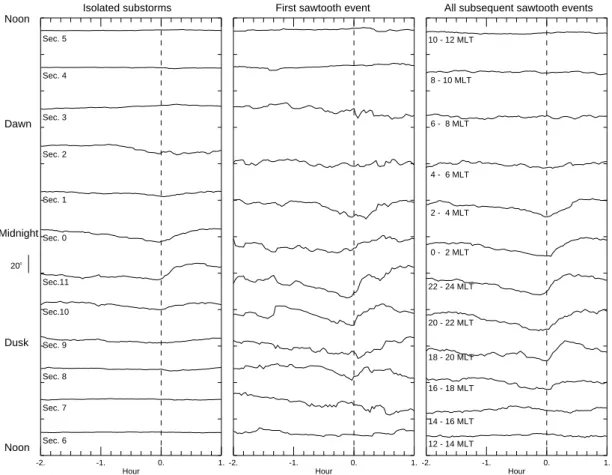
The stackplots for isolated substorms, the first tooth in the intervals, and all subsequent teeth are shown in Fig. 8. As there are only 40 events in the first tooth events, the noise is higher than it is in the other two groups. We introduce spa-tial linear interpolation to fill in data gaps, if there are any. No other smoothing technique is applied. For the first tooth events, the magnetosphere in sectors 4, 5 and 6, i.e. local time from 08:00 MLT to 14:00 MLT, including the local noon sector, looks almost the same as that during isolated sub-storms. The behavior of the magnetosphere in sectors 7 and 8 (14:00 MLT–18:00 MLT) and 3 (06:00 MLT–08:00 MLT) is noteworthy. In these sectors, the tilt angle is similar to that of the isolated substorms 2 h before the onset and then de-creases to the tilt angle observed during subsequent teeth. At the same time, the dipolarization signature is seen in sector 8 (16:00 MLT–18:00 MLT). The tilt angle variation patterns from sector 9 to sector 2 (18:00 MLT–06:00 MLT, including the local midnight) are similar to all subsequent teeth. Ex-cept for sector 2, they all have dipolarization signatures. The magnetosphere in these sectors is more stretched than that during isolated substorms, even 2 h before the onset time. For all subsequent teeth, the dayside magnetosphere in sec-tors 4, 5 and 6 (08:00 MLT–14:00 MLT) is slightly more
stretched than the first tooth events. The magnetosphere
near dusk (14:00 MLT–18:00 MLT) and dawn (06:00 MLT– 08:00 MLT) stays at the same level as it is at the end of the first tooth events. The nightside magnetosphere (18:00 MLT– 06:00 MLT, including local midnight) follows a pattern sim-ilar to that of the first tooth events.
LT-UT map -2.0 -1.5 -1.0 -0.5 0.0 0.5 1.0 Time, hour Midnight Dusk Dawn Noon Noon 44 50 50 50 56 56 56 56 56 62 62 62 62 62 68 68 68 68 74 74 74 74 23.0 26.0 29.0 32.0 35.0 38.0 41.0 44.0 47.0 50.0 53.0 56.0 59.0 62.0 65.0 68.0 71.0 74.0 77.0 20.0 80.0
Fig. 3. Local time – universal time contour plot of the tilt angle during isolated substorms. The tilt angle is plotted from 20◦to 80◦. The
contour level is 3◦. Local midnight is in the middle and local noon is on the top and bottom. The dashed vertical line marks the onset time of substorms. LT-UT map -2.0 -1.5 -1.0 -0.5 0.0 0.5 1.0 Time, hour Midnight Dusk Dawn Noon Noon 32 38 38 38 44 44 44 44 44 44 44 50 50 50 50 50 50 50 56 56 56 56 56 62 62 62 62 62 62 68 68 68 68 74 74 23.0 26.0 29.0 32.0 35.0 38.0 41.0 44.0 47.0 50.0 53.0 56.0 59.0 62.0 65.0 68.0 71.0 74.0 77.0 20.0 80.0
Fig. 4. Local time – universal time contour plot of the tilt angle during individual teeth. See Fig. 3 caption.
From the comparison above, we suggest that there is a pre-condition for the occurrence of the sawtooth events in the nightside magnetosphere. Two hours before the onset of saw-tooth oscillations, the dayside magnetosphere (06:00 MLT–
18:00 MLT, including local noon) is similar to what we ob-serve during isolated substorms. The nightside magneto-sphere (18:00 MLT–06:00 MLT, including local midnight), however, is more stretched than it is during isolated
sub-X. Cai et al.: Magnetic tilt angle for sawtooth and substorm 3487 Midnight Dusk Dawn Noon Noon
Number of data points
-2.0 -1.5 -1.0 -0.5 0.0 0.5 1.0 Times, hour 5 10 15 20 25 30 35 40 45 50 55 60 65 70 75 80 85 90 95 0 117
Fig. 5. Local time – universal time distribution of the number of GOES data points for the averaging process during isolated substorms.
Local midnight is in the middle while local noon is on the top and bottom. The dashed vertical line indicates the onset time of the expansion phase of isolated substorms.
Midnight
Dusk Dawn Noon
Noon
Number of data points
-2.0 -1.5 -1.0 -0.5 0.0 0.5 1.0 Times, hour 5 10 15 20 25 30 35 40 45 50 55 60 65 70 75 80 85 90 95 0 117
Fig. 6. Local time – universal time distribution of the number of GOES data points for the averaging process during individual teeth. See
Fig. 5 caption. The dashed vertical line indicates the onset of a rapid proton flux increase of each tooth.
storms. Then the dayside magnetosphere (08:00 MLT–
14:00 MLT, including local noon) remains steady during the first tooth event. The magnetosphere at dusk (14:00 MLT– 18:00 MLT) and dawn (06:00 MLT–08:00 MLT) stretches slowly to a more tail-like configuration. At the same time,
there is also a dipolarization signature in the magnetosphere from 16:00 MLT to 18:00 MLT. The dipolarization fea-tures are seen in the nightside magnetosphere (18:00 MLT– 06:00 MLT, including the local midnight sector). After the first oscillation, the dayside magnetosphere (08:00 MLT–
-90 -60 -30 0 30 60 90 -180 -150 120 -90 -60 -30 0 30 60 90 120 150 180 Longitude, degree Latitude, degree
Fig. 7. Global distribution of the locations of ground magnetometers in geographic coordinate system. Each magnetometer is marked as a
red plus sign. The mid-latitude regions in corrected magnetic coordinate system (–45◦≤θcgm≤−5◦and 5◦≤θcgm≤45◦) are shown as light
yellow shaded area. Eastern GOES and western GOES are illustrated as blue dots in the equator.
14:00 MLT, including local noon) continues to remain steady, although it is slightly more stretched. The magnetosphere at dusk (14:00 MLT–18:00 MLT) and dawn (06:00 MLT– 08:00 MLT) are near the same levels as at the end of the first tooth. The dipolarization is clearly seen in the night-side magnetosphere (18:00 MLT–06:00 MLT, including local midnight). The only difference between the magnetosphere before the first tooth events and all subsequent teeth is the magnetic field variations near the dusk and dawn regions.
Arnoldy and Moore (1983) analyzed the results from Na-gai (1982) and claimed that successive substorms will in-crease the size of the substorm wedge. This does not ap-pear to be the case for sawtooth oscillations. Similarly, if the extraordinary width of the injection region during saw-tooth events was just a consequence of a series of succes-sive typical substorms, we would expect the first tooth to be-have more like a typical isolated substorm. However, we find the dipolarization region for the first oscillation is also large, which implies that the characteristics of sawtooth oscillations cannot be simply explained as a result of successive typi-cal substorms occurring closely together in time. Clauer et al. (2006) also showed, based on low-latitude magnetic mea-surements, that the width of the current wedge which forms during a sawtooth dipolarization shows a considerable vari-ability in width from tooth to tooth. Henderson (2004)
con-cluded that sawtooth events are a mode during which mag-netospheric substorm activity is brought close to the Earth for extended periods of time. This model can explain the large local time extension of the dipolarization. However, it does not explain the periodicity of the sawtooth events. Hen-derson et al. (2006) found strong evidence that the 18 April 2002 sawtooth event is a sequence of recurrent quasi-periodic substorms. They proposed that the periodicity is determined by the time it takes the magnetosphere to be driven beyond some instability threshold, after which time substorms can be triggered internally or externally. The magnetosphere re-sets itself periodically to dissipate the large energy trans-ferred from the solar wind to the magnetosphere. Huang et al. (2003) suggested that the periodicity of sawtooth events is actually the intrinsic periodicity of magnetospheric sub-storms. This intrinsic periodicity is unrelated to the varia-tion of solar wind driving condivaria-tions. Sawtooth injecvaria-tions can be initiated by solar wind pressure or be triggered by os-cillations in the solar wind ram pressure with a changing pe-riod comparable to the substorm intrinsic cycle (Huang et al., 2003). It remains, however, unclear what the trigger mech-anism of the sawtooth events is, and why sawtooth events occur quasi-periodically.
X. Cai et al.: Magnetic tilt angle for sawtooth and substorm 3489 Sec. 6 Sec. 7 Sec. 8 Sec. 9 Sec.10 Sec.11 Sec. 0 Sec. 1 Sec. 2 Sec. 3 Sec. 4 Sec. 5 200 -2. -1. 0. 1. Hour Noon Dusk Dawn Noon Midnight Isolated substorms -2. -1. 0. 1. Hour
First sawtooth event
12 - 14 MLT 14 - 16 MLT 16 - 18 MLT 18 - 20 MLT 20 - 22 MLT 22 - 24 MLT 0 - 2 MLT 2 - 4 MLT 4 - 6 MLT 6 - 8 MLT 8 - 10 MLT 10 - 12 MLT -2. -1. 0. 1. Hour
All subsequent sawtooth events
Fig. 8. Stackplot of the averaged magnetic tilt angle variations for isolated substorms (left), the first tooth in sawtooth series (middle) and all
subsequent individual teeth (right). See figure caption of Fig. 2.
4 Conclusion and summary
To determine the spatial extent of the magnetic dipolar-ization process during individual teeth, we constructed the global distribution of the magnetic tilt angle during isolated magnetospheric substorms and individual teeth at geostationary orbit. The distribution of the magnetic tilt angle during individual teeth is further examined by dividing them into two groups: the first tooth in the series and all subsequent teeth. From our analysis we find that:
Isolated magnetospheric substorm. The dipolarization process is evident from 20:00 MLT to 02:00 MLT (6 h MLT extent) and is prominent from 22:00 MLT to 00:00 MLT. The dipolarization initiates in a narrow local time range between 22:00 MLT and 00:00 MLT. The minimum tilt angle before the onset is ∼43◦. The typical change in magnetic tilt angle is ∼15◦.
The first tooth in the sawtooth oscillation. The dipolarization
is seen from 16:00 MLT to 04:00 MLT (12 h MLT extent). It is prominent from 22:00 MLT to 00:00 MLT. The dipolar-ization initiates between 22:00 MLT and 00:00 MLT. The minimum tilt angle is ∼23◦ before the onset. The typical
change in the tilt angle is ∼25◦. The dayside magnetosphere from 08:00 MLT to 14:00 MLT, including local noon, has a tilt similar to that observed during isolated substorms. No dipolarization signatures are seen in the dayside magneto-sphere. The magnetosphere in the dawn and dusk regions (06:00 MLT–08:00 MLT and 14:00 MLT - 18:00 MLT) slowly decrease to a level which remains steady during all subsequent teeth.
All subsequent teeth. The nightside magnetosphere (16:00 MLT to 04:00 MLT) behaves in a manner similar to what was observed during the first tooth. The minimum tilt angle before the onset is ∼26◦. The typical change in the tilt
angle is ∼24◦. The dayside magnetosphere is slightly more
stretched than during the first tooth. The magnetosphere at dawn and dusk remains steady.
The magnetic dipolarization process during individual teeth is similar to that observed during isolated substorms. The dipolarization process initiates in the same local time re-gion between 22:00 MLT and 00:00 MLT. The dipolarization expands eastward and westward in both cases. This implies that the magnetic dipolarization mechanism may be the same for these two categories. However, the dipolarization process
during individual teeth occurs over a much wider local time range than that during isolated substorms. But the dipolar-ization process is not global. The nightside magnetosphere is more stretched before the onset time and the dipolarization is larger during individual teeth than during isolated substorms. The magnetosphere during first teeth is a mixed picture of that during isolated substorms and subsequent teeth, i.e. the dayside magnetosphere (08:00 MLT to 14:00 MLT, including local noon) varies similarly to that during isolated substorms, the nightside magnetosphere (16:00 MLT to 04:00 MLT, in-cluding local midnight) changes with a similar pattern to that during subsequent teeth and the magnetosphere at dawn and dusk evolves from substorm-like to subsequent teeth-like. This fact suggests that the nightside magnetosphere is preconditioned before the onset of the first teeth. The re-lationship between the dipolarization processes during iso-lated substorms, first teeth and subsequent teeth could pro-vide clues to explain trigger mechanisms for sawtooth events.
Acknowledgements. Thanks to NGDC for providing GOES data
and LANL for providing SOPA energetic particle data. This research is supported by NASA grants (NAG5-12176 and NNG0565896) and NSF grants (OPP-0220735, ATM0402163 and ATM 0202303).
Topical Editor I. A. Daglis thanks H. Singer and C. Jacquey for their help in evaluating this paper.
References
Arnoldy, R. L. and Moore, T. E.: Longitudinal structure of substorm injections at synchronous orbit, J. Geophys. Res., 88, 6 213– 6 220, 1983.
Belian, R. D., Baker D. N., Higblie, P. R., and Jones Jr., E. W.: High resolution energetic particle measurements at 6.6 Re, 2, High en-ergy proton drift echoes, J. Geophys. Res., 83, 4857-4862, 1978. Belian, R. D., Cayton T. E., and Reeves, G. D.: Quasi-periodic, substorm associated, global flux variations observed at geosyn-chronous orbit, in: Space Plasmas: Coupling between Small and Medium Scale Processes, edited by: Ashour-Abdalla, M., Chang, T., and Dusenbury, P., American Geophysical Union, Washington, D.C., 143–148, 1995.
Berchem, J. and Russell, C. T.: The thickness of the magnetopause current layer: ISEE-1 and -2 observations, J. Geophys. Res., 87, 2108–2114, 1982.
Cai, X., Clauer, C. R., and Ridley, A. J.: Statistical analysis of iono-spheric potential patterns for isolated substorms and sawtooth events, Ann. Geophys., 24, 1977–1991, 2006,
http://www.ann-geophys.net/24/1977/2006/.
Clauer, C. R. and McPherron, R. L.:, Mapping the local time – universal time development of magnetospheric substorms using mid-latitude magnetic observations, J. Geophys. Res., 79(19), 2811–2820, 1974.
Clauer, C. R., Cai, X., Welling, D., and DeJong, A.: Charac-terizing the April 18, 2002 storm-time sawtooth events using ground magnetic data, J. Geophys. Res., J. Geophys. Res., 111, doi:10.1029/2005JA011099, 2006.
Clauer, C. R., Liemohn, M. W. , Kozyra, J. U., and Reno, M. L.: The relationship of storms and substorms determined from
mid-latitude ground-based magnetic maps, in: Disturbaces in Geospace: The Storm – Substorm Relationship, edited by: Sharma, Y. K. A. S. and Lakhina, G., AGU, Washington, D.C., 143–157, 2003.
Cummings, W. D., Barfield, J. N., and Coleman Jr., P. J.: Magneto-spheric substorms observed at the synchronous orbit, J. Geophys. Res., 73(21), 6687–6698, 1968.
Erickson, K. N., Swanson, R. L., Walker, R. J., and Winckler, J. R.: A study of magnetosphere dynamics during auroral electrojet events by observations of energetic electron intensity changes at synchronous orbit, J. Geophys. Res., 84, 931–942, 1979. Henderson, M. G.: The May 23, 1986 CDAW-9C
inter-val: A sawtooth event, Geophys. Res. Lett., 31, L11804, doi:10.1029/2004GL019941, 2004.
Henderson, M. G., Reeves, G. D., Skoug, R. M., Thomsen, M. F., Denton, M. H., Mende, S. B., Immel, T. J., Brandt, P. C., and Singer, H. J.: Magnetospheric and auroral activity during the 18 April 2002 sawtooth event, J. Geophys. Res., 111, A01S90, doi:10.1029/2005JA011111, 2006.
Huang, C. S., Reeves, G. D., Borovsky, J. E., Skoug, R. M., Pu, Z. Y., and Le, G.: Periodic magnetospheric substorms and their re-lationship with solar wind variations, J. Geophys. Res., 108(A6), 1255, doi:10.1029/2002JA009704, 2003.
Kokubun, S. and McPherron R. L.: Substorm signatures at syn-chronous altitude, J. Geophys. Res., 86, 11 265–11 277, 1981. McPherron, R. L., Russell, C. T., and Aubry, M. P.: Satellite studies
of the magnetospheric substorms on August 16, 1968, 9, Phe-nomenological model for substorms, J. Geophys. Res, 78, 3131– 3149, 1973.
Nagai, T.: Observed magnetic substorm signatures at synchronous altitude, J. Geophy. Res., 87(A6), 4405–4417, 1982.
Nagai, T.: An empirical model of substorm-related magnetic field variations at synchronous orbit, in: Magnetospheric Substorms, Geophysical Monograph 64, edited by: Kan, J. R., Potemra, T. A., Kokubun, S., Iijima, T., AGU, Washington, D.C., 91–95, 1991.
Reeves, G. D., Henderson G. D., McLachlan P. S., and Belian R. D.: Radial propagation of substorm injections, in Proceedings of the Third International Conference on Substorms, Eur. Space Agency Spec. Publ., ESA SP-339, 579–584, 1996.
Sauvaud, J.-A. and Winckler, J. R.: Dynamics of plasma, ener-getic particles, and fields near synchronous orbit in the nighttime sector during magnetospheric substorms, J. Geophys. Res., 85, 2043–2056, 1980.
Song, P., Russell, C. T., Elphic, R. C., Gosling, J. T., and Cattell, C. A.: Structure and properties of the subsolar magnetopause for northward IMF – ISEE observations, J. Geophys. Res., 95, 6375–6387, 1990.
Swanson, R. L.: Electron intensity and magnetic field changes at synchronous orbit for the auroral electrojet, M.S. thesis, Univ. of Minn., Mineapolis, 1978.
Tsagouri, I., Mavromichalaki, H., and Belehaki, A.: Azimuthal expansion of the substorm current wedge, in: Proceedings of the Third International Conference on Substorms, Eur. Space Agency Sec. Publ., ESA SP-389, 359–362, 1996.
Walker, R. J., Swanson, R. L., Winckler, J. R., and Erickson, K. N.: Substorm-associated particle boundary motion at synchronous orbit, J. Geophys. Res., 81(5), 5415–5550, 1976.