Ductility Enhancement of High Performance Cementitious
Composites and Structures
by
Eugene Chuang
B.S., Massachusetts Institute of Technology (1996)
M.S., Massachusetts Institute of Technology (1998)
Submitted to the Department of Civil and Environmental Engineering
in partial fulfillment of the requirements for the degree of
MASSACHUSETTS I STITUTE., OF TECHNOLOGY
Doctor of Science
--
~~.-S EP
I
Q
ljoz
at the
LIBRARIES
MASSACHUSETTS INSTITUTE OF TECHNOLOGY
September 2002
2002 Massachusetts Institute of Technology. All rights reserved.
Signature of Author...
..
. ... ...Department of Civila Environmental Engineering
August 1, 2002Certified by ...
Accepted by....
. . ... ... ... .
Franz-Josef Ulm
Associate Professj of Civil and Environmental Engineering
Thesis Supervisor
Ductility Enhancement of High Performance Cementitious Composites and Structures
by
Eugene Chuang
Submitted to the Department of Civil and Environmental Engineering on August 1, 2002, in partial fulfillment of the
requirements for the degree of Doctor of Science
Abstract
High performance cementitious composites (HP2C) are a new generation of fiber reinforced cementitious composites (FRCC) with substantial improvements in mechanical behavior. The most important development in these HP2C materials may be the nearly elasto-plastic ductile behavior, which allows safe exploitation of the tensile and shear capacity in structural elements. This thesis presents a comprehensive investigation into the ductility enhancement of HP2C structures. Beginning at the micromechanical level, sources of ductility are examined and micro-to-macro relations are derived from homogenization theory and fracture mechanics. These micro-to-macro relations form the basis for a novel 3-D two-phase material model, which cap-tures macroscopically observed behavior. Currently existing models which describe the me-chanical behavior of FRCC are often micromeme-chanical in nature. However, this macroscopic approach permits one to model the mechanical behavior of HP2C in a continuous fashion, i.e. through the various states of cracking in HP2C, while capturing - through the two-phase com-posite structure of the model - the micromechanical sources of energy dissipation in the fiber reinforced composite.
The 3-D model is implemented in a finite element program to simulate the behavior of two HP2C applications: a flexural girder and a shear girder, which have recently been tested by the FHWA. It is shown how the two-phase model aptly and accurately predicts the structural behavior of HP2C. Next, a sensitivity analysis of the HP2C model parameters elucidates how changes in HP2C mechanical behavior, observed at material level, manifest themselves at the structural level. By setting limits on the permanent composite matrix strain, which accounts for cracking in HP2C, one can set service limits on HP2C structures.
Hence, a comprehensive (micromechanical, macroscopic, and structural) method for the assessment of the ductility enhancement of HP2C structures is presented. A significant scientific benefit of this research is the HP2C model which links micromechanical processes to macroscopic behavior and ultimately to structural behavior. This research also provides a design tool, that is the finite element applicati6n, which can be used to predict the behavior of HP2C structures
and suggest improvements in HP2C structural and material design.
Thesis Supervisor: Franz-Josef Ulm
Contents
1 Introduction 1.1 Industrial Context . . . . 1.2 Characteristics of HP2C . . . . 1.3 Research Motivation . . . . 1.3.1 Research Objectives . . . . 1.4 Outline of Thesis . . . . 18 . . . . 1 8 . . . . 2 1 . . . . 2 1 . . . 2 3 . . . . 2 5I MICRO-TO-MACROSCOPIC DUCTILITY ENHANCEMENT
2 Micromechanical Sources of Ductility
2.1 The Fiber Pullout Model . . . .
2.2 Length Scales of FRCC . . . .
2.2.1 Elastic Embedment Length . . . . 2.2.2 Anchorage Length - Stress Criterion . . . 2.2.3 Radial Influence Zone . . . . 2.2.4 Optimal Fiber Radius . . . . 2.2.5 Anchorage Length - Fracture Criterion 2.3 Discussion of the Micromechanical Length Scales
3 Micromechanical to Macroscopic Behavior
3.1 Micromechanical Behavior of FRCC . . . . 3.2 Continuum Micromechanics Modeling of FRCC . . . . 3.2.1 Elements of Linear Elastic Continuum Micromechanics . . . .
27 28 . . . 28 . . . 30 . . . 31 . . . 36 . . . 38 . . . 42 . . . 47 . . . 49 51 53 57 57
3.2.2 Homogenization Model for FRCC Elasticity . . . 59
3.2.3 Homogenization Model for Cracking in FRCC . . . 66
3.3 Cracking Strength . . . 71
3.3.1 Fracture Toughness of FRCC . . . 72
3.3.2 LEFM-Analysis of Fiber Bridging Effects on Composite Strength . . . 74
3.3.3 Macroscopic Stress After First Cracking . . . 78
3.4 Fracture Mechanics of Post-Cracking Behavior . . . 83
3.4.1 Elements of Fracture Mechanics of FRCC . . . 83
3.4.2 Through Crack Formation . . . 84
3.4.3 Double Periodic Crack Distribution . . . 88
3.5 Generating the Complete Stress-Strain Curve . . . 93
3.6 Chapter Sum m ary . . . 95
II MATERIAL MODELING
97
4 A Two Phase Composite Model in 1-D 98 4.1 Constitutive Model for Matrix-Fiber Couplings . . . 994.1.1 Two-Phase Composite Model . . . 100
4.1.2 Model with a Brittle-Plastic Matrix . . . 107
4.2 Energy States and Energy Transformation . . . 111
4.2.1 Elements of 1-D Thermodynamics . . . 111
4.2.2 Energy States of the Composite Model . . . 112
4.2.3 Energy Transformations of the Composite Model . . . 115
4.2.4 Micromechanical Examination of Energy Dissipation . . . 117
4.3 Application to FRCC and HP2C . . . 119
4.3.1 Determination of Coupling Modulus from Tensile Stress-Strain Data . . . 121
4.3.2 Determination of the Ductility Ratio from Energy Dissipation . . . 126
4.4 Summary of the 1-D Model . . . 131
5 Extension of the Composite Model to 3-D 133 5.1 3-D Constitutive M odel . . . 133
5.1.1 Energy Considerations of the 3-D Model . . . 134
5.1.2 Isotropic State Equations and Material Constants . . . 137
5.2 HP2C Plasticity in 3-D . . . 140
5.2.1 Construction of the 3-D Strength Domain . . . 144
5.2.2 Composite Flow Rules . . . 151
5.3 The 1-D Consistency Condition . . . 152
5.3.1 Determination of the 3-D Coupling Modulus . . . 154
5.3.2 A 3-D Mode of Plastification . . . 158
5.4 Energy Transformations of the 3-D HP2C Model . . . 164
5.4.1 Uniaxial Energy Transformation . . . 165
5.4.2 Biaxial Energy Transformation . . . 166
5.5 Determination of the 3-D Model Parameters . . . 168
5.6 Domain of Application for the 3-D Model . . . .. . . . 169
5.7 Chapter Summary . . . 172
6 Elements of Computational Mechanics and Implementation 174 6.1 The Return Mapping Algorithm . . . 175
6.2 Return Mapping Algorithm for the 1-D Model . . . 175
6.2.1 The 1-D HP2C Simulator . . . 180
6.3 Return Mapping Algorithm for the 3-D Model . . . 183
6.3.1 The 3-D HP2C Simulator . . . 191
6.4 The Finite Element Program . . . 193
6.4.1 Principle of Virtual Displacements . . . 193
6.4.2 Finite Element Equations . . . 195
6.4.3 The HP2C Finite Element Module . . . 197
6.5 Verification of the HP2C Module -A Uniaxial Simulation . . . 197
6.5.1 Domain of Application for the Finite Element Program . . . 201
III ENGINEERING APPLICATION
7 Large Scale Structural 3-D Model Validation and Size Effect Study of Model Parameters
7.1 The FHWA Large Scale Structural Tests . . . . 7.1.1 Section Modeling . . . . 7.1.2 HP2C Model Parameters . . . . 7.1.3 Simplified Modeling of Prestressing . . . . .
7.1.4 Effective Stiffness and Strength of the Botto 7.1.5 Application of Loading . . . . 7.2 Case Study: FHWA Flexure Test . . . . 7.2.1 Global Results: Load-Deflections Curves . . 7.2.2 Local Results: Strain Gauge Measurements 7.2.3 Local Results: Cracking Patterns . . . . 7.3 Case Study: FHWA Shear Test . . . . 7.3.1 Global Results: Load-Deflections Curves . . 7.3.2 Local Results: Strain Gauge Measurements
7.3.3 Local Results: Cracking Patterns... 7.4 Discussion of Large Scale Simulation Results . . . 7.5 Size Effect in HP2C Structures . . . .
7.6 7.7
7.5.1 An Instructive Example: A Small Scale Unn 7.5.2 Size Effect Study on Self-Similar Small Scale 7.5.3 Interpretation of Results with Ba2ant's Size] 7.5.4 Domain of Application for Model Parameters Guidelines for Using the FE Implementation . . . . Chapter Summary . . . . 207 . . . . 208 . . . . 210 . . . . 210 . . . . 211 m Flange . . . 212 . . . 214 . . . 214 . . . 217 . . . 217 . . . 219 . . . 224 . . . 224 . . . 228 . . . 229 . . . 229 . . . 232 tched Beam . . . 233 Notched Beams . . . 238 Effect Law . . . 247 . . . 249 . . . 249 . . . 251 8 Structural Effect of Ductility Enhancement
8.1 Quantifying Structural Performance . . . . 8.1.1 Cracking Criteria . . . . 8.2 Ductility Parameters . . . . 252 253 254 255 206
8.3 Sensitivity Analysis of Ductility P 8.3.1 Effect of Stiffness Ratio 8.3.2 Effect of Ductility Ratio 8.3.3 Effect of Strength Ratio 8.4 Chapter Summary . . . .
9 Conclusions
9.1 Summary . . . . 9.2 Industrial Benefits . . . . 9.3 Suggestions for Future Research. 9.4 Perspectives . . . . . . . 2 5 8 . . . 2 6 0 . . . 2 6 4 . . . 2 6 7 . . . 2 7 3 275 . . . 275 . . . 277 . . . 278 . . . 279 A Eshelby Tensors A.1 Maple Files for the Eshelby Tensors . . . . A.1.1 Maple File for the Elastic Composite Model . . . . A.1.2 Maple File for the Cracked Composite Model . . . . B Plastic Projection Schemes B.1 Triaxial Loading . . . . B.1.1 Projection Scheme for the Tension Cut-Off Condition B.1.2 Projection Scheme for the Drucker-Prager Condition . . . B.1.3 Multisurface Projection Schemes . . . . B.2 Uniaxial Loading . . . . B.2.1 Multisurface Projection Schemes for Uniaxial Loading . . B.3 Plane Stress Loading . . . . B.3.1 Multisurface Projection Schemes for Plane Stress Loading 306 . . . 307 . . . 308 . . . 308 . . . 309 . . . 313 . . . 314 . . . 316 . . . 317 288 290 290 295
List of Tables
1.1 Mix Design for DUCTAL. ... ... 21
2.1 Typical Values of Fiber and Concrete Material Parameters. . . . 35 2.2 Typical Values of Length Scales. . . . 49 3.1 Micromechanical Values of the HP2C Test and Assumed Values for the Prediction
Schem es. . . . 93 3.2 Micromechanical Input Parameters for the Prediction of Stress-Strain Behavior. . 95 4.1 Material and Specimen Data for the Four Different FRCC Material (FRCCa,
FRCCb, HP2Ca, and HP2Cb) Tests. . . . 120 4.2 Model Stiffness Parameters Determined from the Four Different FRCC Material
T ests. . . . 126 4.3 Determined Strength Parameters and Ductility Ratio for the Four Different
FR C C Tests. . . . 128
5.1 Parameters of the 3-D HP2C Model. . . . 172 6.1 General Form of the Return Mapping Algorithm. . . . 175 6.2 Model Parameters Determined from HP2Ca Direct Notched Tensile Test Data. .201
7.1 Values of HP2C Model Parameters Used in the FHWA Flexure and Shear Finite Element Simulations and Associated Ductility Parameters . . . . 210 7.2 "Best Fit" Macroscopic Behavior Listed with Related Model Parameters and
8.1 Modified Values of HP2C Model Parameters Used in the FHWA Flexure and
Shear Finite Element Simulations for Ductility Parameter Study. . . . 260
8.2 Normalized Loads at Service Limit for Different Stiffness Ratios. . . . 262
8.3 Normalized Loads at Service Limit for Different Ductility Ratios. . . . 267
List of Figures
1-1 HP2C Panels for a Building Facade (ductal.com Web Site [24]). . . . 19
1-2 Economic Benefits from Using DUCTALTM (Lafarge [52]). . . . 20
1-3 A Fragment of DUCTALT . . . . 22
1-4 Comparison of the Flexural Strengths of HP2C (Ductal) and Conventional Con-crete (HPC) (imagineductal.com Web Site [37]). . . . 22
1-5 A Comprehensive Solution for the Examination of HP2C Ductility. . . . . 24
2-1 Interface Failure at the Crack Face (Li et al. [59]). . . . . 29
2-2 Budiansky's Three-Body Matrix-Interface-Fiber System [10]. . . . 30
2-3 Three-Body Matrix-Interface-Fiber System (Lim et al. [63]). . . . 31
2-4 Normalized Interfacial Shear Stress (ro(z)/ro(0)) vs. Normalized Distance from Crack Face (z/f,). Expression for Shear Stress Provided by Leung and Li [54. 34 2-5 Possible Stress Profiles in the Fiber and the Interface at the Point of Fiber Yielding. 36 2-6 A Matrix-Fiber Two-Body System and Related Stress State in the Matrix. . . 39
2-7 Fiber Spacing in a Representative Cylinder. . . . 41
2-8 Debonding of Fiber from Matrix. . . . 42
2-9 Comparison of the Simplified Two-Body Displacement Solution with Budiansky's Three-Body Solution. . . . 45
2-10 Friction along the Debonded Interface [40,54] . . . . 46
3-1 Stress-Extension Graph for an HP2C Specimen in Tension (Data from Boulay et al. [9]). . . . 52
3-3 Cracking Evolution during Tensile Loading (Li [55]): (a) First Cracking, (b)
Half-Maximum Strain Capacity, (c) Crack Saturation, and (d) Tension Softening. 55 3-4 Simplified Representation of the Tensile Stress-Strain Curve for HP2C Materials. 56 3-5 Estimate for the Normalized Modulus Ko/Em as a Function of Fiber Aspect
Ra-tio Lf/2rf for Different Fiber Volume Contents cf. Material Parameter Values:
vm = .2, vf = .3, Ef/Em = 4. . . . . 64 3-6 Comparison of the Prediction Schemes for the Normalized Modulus K0/Em as a
Function of Fiber Volume Content cf: Ef/Em = 4 and LJ/2rf = 100. . . . . 65 3-7 The Effect of Crack Aspect Ratio u/2a on the Normalized Cracked Modulus
K1
/Ko
for Different Crack Volume Fractions cr (cf = 0). . . . . 693-8 The Effect of Crack Volume Fraction cc on the Normalized Stiffness of FRCC Composites with Cracks K1
/Ko.
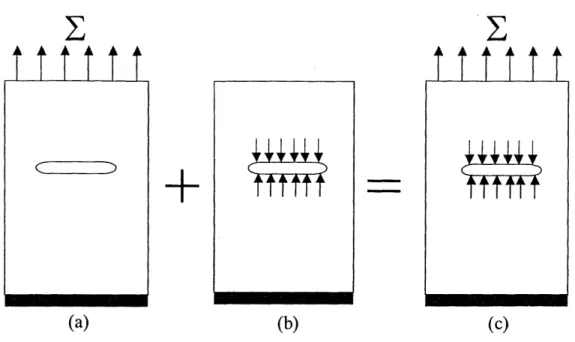
Crack Void Aspect Ratio u/2a = 1/1000. . . . . 70 3-9 Effective Stress Intensity Applied to a Fiber-Bridged Crack Under an ExternalLoad: (a) Effect of External Load, (b) Effect of Crack Bridging, and (c) Total E ffect. . . . 74
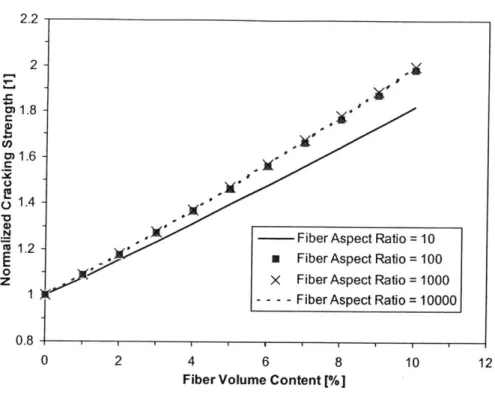
3-10 Effect of Fiber Volume Content cf on the Normalized Cracking Strength 2 = E l /om u.. . . . .. . . . 76
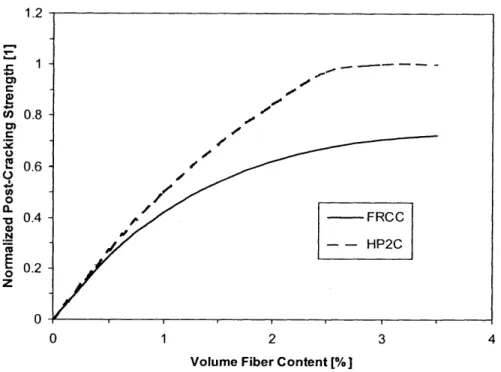
3-11 Through Crack Formation after First Cracking. . . . 78 3-12 Normalized Post-Cracking Strength Ef
/Ej
as a Function of Fiber VolumeCon-tent cf for an HP2C and an FRCC Material. . . . . 82 3-13 A Double-Periodic Array of Bridged Cracks (Karihaloo et al. [45]). . . . 87 3-14 Superposition of Sub-Problems (Karihaloo and Wang [44]). . . . . 88 3-15 Influence of Bridging Stiffness on Crack Opening Displacement (Karihaloo et
al. [451): W/a = 2.5 and H/a = 2.0. . . . 89
3-16 Normalized Post-Cracking Stiffness K1
/Ko
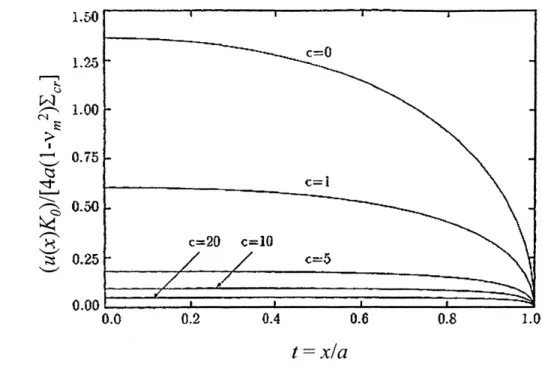
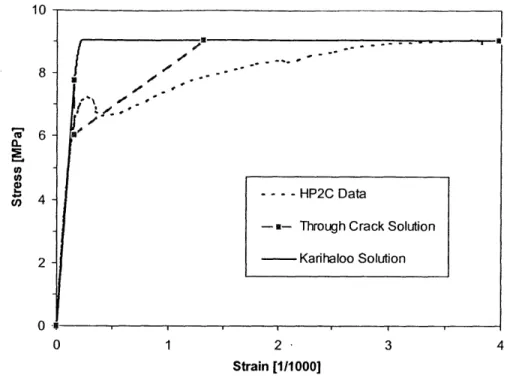
as a Function of Crack VolumeCon-tent ccr for Different H/W ratios. . . . . 91 3-17 Comparison of the Karihaloo Solution and the Through Crack Solution with
HP2C Data (from Boulay et al. [9]). . . . 94
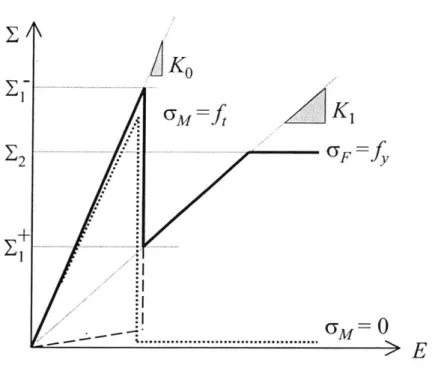
4-1 The Simplified Stress-Strain Curve for the Two-Phase Model. . . . 100 4-2 Two-Phase Composite Model. . . . 101
4-3 Composite Stiffness Ratio r, as a Function of Fiber Volume Content cf for a Typical FRCC Material and a Typical HP2C Material. . . . 105 4-4 The Evolution of the Modeled Matrix and Fiber Stresses with Macroscopic Strain
as Given by the HP2C Model. . . . 108
4-5 The HP2C Model with a Brittle-Plastic Matrix. . . . 108
4-6 Energy Dissipation for an FRCC Material and an HP2C Material: (a) Due to
Matrix Cracking,
-[[4']c,,
i.e. Eq. (4.45); (b) Due to Matrix Yielding, -[[0]].,i.e. Eq. (4.46); (c) Total Dissipation, i.e. Eq. (4.44). . . . 114
4-7 Micromechanical Cracking Mechanisms in HP2C. . . . 117 4-8 Stress-Displacement Curve for an Unnotched FRCC Specimen (Li et al. [57]). . . 121 4-9 Average Notch Stress-Displacement Curve for the HP2Ca Material (Boulay et
al. [9]). . . . 122
4-10 Average Notch Stress-Displacement Curve for the HP2Cb Material (Data from
L afarge). . . . 123
4-11 Asymptotic Behavior of Coupling Modulus M for Ko/K1 = 20. . . . 124
4-12 M/Ko versus Fiber Volume Fraction for the Four FRCC Materials. . . . 127 4-13 Graphical Determination of the Energy Dissipation from Stress-Displacement
Curves (Li et al. (57]). . . . 128 4-14 Ductility Ratio ky/ft vs. Fiber Volume Fraction cf for FRCCa Data [57]. .. . . 129 4-15 Composite Yield Strength E2 as a Function of Fiber Volume Content cf for
FRCCa and FRCCb. . . . 131
5-1 The HP2C Strength Domain in the E, x Eyy Plane (Ez = 0). Based on Kupfer
et al. [49]. . . . 140
5-2 Tension Cut-Off and Drucker-Prager Loading Criteria in the I, - Isj Plane. . . 142 5-3 Strength Domain for the Composite Matrix in the am,., x M,yy Plane (cM,zz 0) 143 5-4 The Initial Strength Domain for the Composite Matrix Expressed by the
Ten-sion Cut-Off, CompresTen-sion-TenTen-sion DP, and the CompresTen-sion-CompresTen-sion DP Criteria in the um,., X OM,yy Plane (oM,zz = 0) . . . . - -. . -. . .. 146
5-6 The Stress-Strain Behavior of the Composite Matrix as Given by The Loading
Functions (Stress-Strain in Absolute Values). . . . 148
5-7 The Loading Functions for the Composite Fiber. . . . 150
5-8 Evolution of Composite Matrix and Composite Fiber Stresses Given by the Uni-axial Output from the 3-D HP2C Model . . . 153
5-9 Comparison of the 1-D and 3-D Model Output for Uniaxial Tensile Loading. . . . 158
5-10 Fiber Bridging of Crack Voids. . . . 159
5-11 The Evolution of the Mean Stresses, (11/3), in the Modeled Matrix and Fiber. .161 5-12 Comparison of 1-D and 3-D HP2C Simulator Output for Uniaxial Cyclic Loading.170 5-13 Cyclic Loading of an Unnotched FRCC Specimen (Kesner [47]). . . . 171
6-1 1-D HP2C Simulator Output (http://cist.mit.edu). . . . 181
6-2 Stages of HP2C Loading: (a) Elastic Loading in Tension, (b) Complete Tension Curve, (c) Unloading and Compression, and (d) Unloading from Compression (http://cist.m it.edu). . . . 182
6-3 Schematic Representation of the 3-D Return Mapping Algorithm for the Two-Phase M aterial. . . . 184
6-4 Possible Plastic Corrections for a Given Composite Matrix Stress State. . . . 188
6-5 3-D HP2C Simulator Output (http://cist.mit.edu). . . . 192
6-6 General Algorithm of the HP2C Module at the Structural Level. . . . 198
6-7 General Algorithm of the HP2C Module at the Element Level. . . . 199
6-8 Uniaxial Response of Finite Element Simulations Compared with the Analytical Solution. Model Parameter Values Listed in Table 6.2. . . . 200
6-9 Mesh Design of the Notched Test Simulation: (a) Coarse Mesh, (b) Fine Mesh. . 202 6-10 Stress-Strain Behavior Calculated from the Notched Cylinder FE Simulation Compared to the Assumed Material Behavior . . . . . . . . 203
6-11 Stress Profile along the Notch of the HP2Ca Test Specimen. . . . 204
7-1 Cross Section of the AASHTO Type II Girder: (a) Actual Beam and (b) Idealized Finite Element Simulation. . . . 208 7-2 Loading Configuration and Strain Gauge Locations for the FHWA Flexure Test. 212
7-3 Mesh and Boundary Conditions for the FHWA Flexure Simulation: (a) Coarse Mesh, (b) Fine Mesh, (c) Deformed Coarse Mesh, (d) Deformed Fine Mesh. . . .215 7-4 Load-Deflection Results Given by the FWHA Flexure Test and the FE
Simula-tion. Load Listed as Total Applied Load, Deflection Measured at Midpoint of the Beam. Experimental Data Provided by FHWA. . . . 216 7-5 Strain Measurements Given by Strain Gauges Placed Longitudinally on FHWA
Flexural Girder and the Upper Bound Fine Mesh FE Simulation. Locations of Strain Gauges Numbered in Fig. 7-2. Experimental Data Provided by FHWA. . 218 7-6 Principal Composite Matrix Plastic Strains E& for the Upper Bound Flexure
Simulation at P = -800 kN: (a) Coarse Mesh, (b) Fine Mesh. . . . 219 7-7 Evolution of Longitudinal Composite Matrix Plastic Strains EP along the
Height of the FHWA Flexure Girder at the Midpoint as Predicted by the Upper Bound Fine Mesh Simulation. . . . 220 7-8 Evolution of Longitudinal Stresses along the Height of the FHWA Flexure Girder
at the Midpoint as Predicted by the Upper Bound Fine Mesh Simulation. . .. .221 7-9 Loading Configuration and Strain Gauge Locations for the FHWA Shear Test. . 222 7-10 Mesh and Boundary Conditions for the FHWA Shear Simulation: (a) Coarse
Mesh, (b) Fine Mesh, (c) Deformed Coarse Mesh, (d) Deformed Fine Mesh. . . . 223 7-11 Load-Deflection Results Given by the FHWA Shear Test and the FE Lower
Bound Fine Mesh Simulation. Experimental Data Provided by FHWA. . . . 224 7-12 Load-Deflection Results Given by the FWHA Shear Test and the FE Simulation.
Deflection Measured at Load Point. Experimental Data Provided by FHWA. . .225 7-13 Shear Cracking in the Web of the FHWA Shear Test Specimen During Pre-Peak
Loading. Picture Provided by FHWA. . . . 226
7-14 Tendon Slip Measured at the End of the Beam (Short Load Span Side) as a Function of Load Point Deflection. Experimental Data Provided by FHWA. . . .227 7-15 Strain Measurements Given by Strain Gauges Placed Longitudinally on FHWA
Shear Girder and the Lower Bound Fine Mesh FE Simulation. Locations of Strain Gauges Numbered in Fig. 7-9. Experimental Data Provided by FHWA. . 228
7-16 Principal Composite Matrix Plastic Strains
ep'
j for the Lower Bound Shear Simulation at P = -3400 kN: (a) Coarse Mesh, (b) Fine Mesh. . . . 2307-17 Composite Matrix Plastic Strain Vectors in the Short Load Span as Predicted by the Fine Mesh Lower Bound Solution: (a) First Shear Cracking, (b) Fully Developed Shear Cracking. . . . 231 7-18 Configuration of the Small Scale Four Point Beam Tests Performed by Lafarge. .233 7-19 Load-Deflection Behavior for SS4P Determined Experimentally and with FE
Simulation. Load Listed as Total Applied Load P, Deflection Measured From Beam Midspan. Experimental Data Provided by Lafarge. . . . 234 7-20 "Best Fit" SS4P Bending Simulation: (a) Mesh and Boundary Conditions, (b)
Deformed Shape at P = 50 kN, (c) Principal Composite Matrix Plastic Strains
EP at P = 50 kN . . . 235
7-21 The Load-Deflection Results for SS4P Using Different Values of First Cracking Strength, El = ky +
ft,
with a Constant Composite Yield Strength, E2 = ky +fy
= 11.5. Experimental Data Provided by Lafarge. . . . 236 7-22 The "Best Fit" Load-Deflection Prediction for SS4P Given by FE Simulationwith k. + ft = 10.5 and ky +
fy
= 12.5. Experimental Data Provided by Lafarge. 237 7-23 Stress-Strain Behavior for the HP2Cb Tensile Notched Plate Test and the "BestFit" for SS4P: (a) Focus on First Cracking Behavior, (b) Entire Stress-Strain C urve. . . . 239 7-24 Configuration of the Small Scale Three Point Notched Beam Tests Performed by
L afarge. . . . 240
7-25 Total Load P as a Function of Crack Opening Displacement as Given by the Experimental Data and FE Simulation. Crack Opening Displacement Measured from the Bottom of the Beam at a Test Gauge Length of 40 mm. Experimental Data Provided by Lafarge. . . . 241 7-26 "Best Fit" N70 Notched Bending Simulation: (a) Mesh and Boundary
Condi-tions, (b) Deformed Shape at P = 27 kN, (c) Principal Composite Matrix Plastic
7-27 "Best Fit" NIO0 Notched Bending Simulation: (a) Mesh and Boundary Condi-tions, (b) Deformed Shape at P = 55 kN, (c) Principal Composite Matrix Plastic
Strains s , at P = 55 kN. . . . 243
7-28 The "Best Fit" Load-Deflection Prediction for the Notched Beams Given by FE Simulation. Experimental Data Provided by Lafarge. . . . 244
7-29 Stress-Strain Behavior for the HP2Cb Tensile Notched Plate Test and the Best Fit for the N100 and N70 Beam Tests: (a) Focus on First Cracking Behavior, (b) Entire Stress-Strain Curve. . . . 246
7-30 Bazant's Size Effect Prediction Shown with N70, N100, and FHWA Cracking Strength Results: (a) Normalized Effective First Cracking Strength E est/BE' ref as a Function of Normalized Beam Height h/DO, (b) Normalized Effective Post-Cracking Strength
Ejf'est/B)''Tef
as a Function of Normalized Beam Height h/D...2488-1 HP2Cb Stress-Strain Behavior with Modified Stiffness Ratios RK . . . ..256
8-2 HP2Cb Stress-Strain Behavior with Modified Ductility Ratios RD . . . . . . . ..257
8-3 HP2Cb Stress-Strain Behavior with Modified Strength Ratios ZS. . . . 258
8-4 Effect of Stiffness Ratio on Normalized Load-Deflection Behavior: (a) Upper Bound of the FHWA Flexure Beam. Deflection Measured at Beam Midpoint, Deflection Normalized by 6, = 50 cm, Load Normalized by P" = -800 kN; (b) Lower Bound of the FHWA Shear Beam. Deflection Measured at Load Point, Deflection Normalized by 6, = 14 mm, Load Normalized by P = -3400 kN. . . 259
8-5 Effect of Stiffness Ratio on Normalized Load-Maximum Crack Width Behavior of Upper Bound of the FHWA Flexure Beam. Cracking EP , Measured in Bottom Flange, Strain Normalized by ePr M,max = 5 x 10⁻³, Load Normalized by P" = -800 kN... ... 261
8-6 Effect of Stiffness Ratio on Normalized Load-Maximum Crack Width Behavior of Lower Bound of the FHWA Shear Beam: (a) Flexure Cracking e ,1 Measured in Bottom Flange, Strain Normalized by e [ = 5 x 10⁻³, Load Normalized by PU = -3400 kN; (b) Shear Cracking ? ,& Measured in Web, Strain Normalized by 6 pa = 5 x 10⁻⁴, Load Normalized by P = -3400 kN. . . . 263
8-7 Effect of Ductility Ratio on Normalized Load-Deflection Behavior: (a) Upper Bound of the FHWA Flexure Beam. Deflection Measured at Beam Midpoint, Deflection Normalized by J, = 50 cm, Load Normalized by P = -800 kN; (b) Lower Bound of the FHWA Shear Beam. Deflection Measured at Load Point, Deflection Normalized by J, = 14 mm, Load Normalized by P = -3400 kN. . .265 8-8 Effect of Ductility Ratio on Normalized Load-Maximum Crack Width Behavior
of Upper Bound of the FHWA Flexure Beam. Cracking 6'M, Measured in Bottom Flange, Strain Normalized by a 5 x 10--3, Load Normalized by P = -800 kN . . . 266 8-9 Effect of Ductility Ratio on Normalized Load-Maximum Crack Width Behavior
of Lower Bound of the FHWA Shear Beam: (a) Flexure Cracking ' Measured in Bottom Flange, Strain Normalized by Ejax = 5 x 10- 3, Load Normalized by PU = -3400 kN; (b) Shear Cracking Egg Measured in Web, Strain Normalized by e-p"un =5 x 10⁻⁴, Load Normalized by Pu = -3400 kN. . . . 268
8-10 Effect of Strength Ratio on Normalized Load-Deflection Behavior: (a) Upper Bound of the FHWA Flexure Beam. Deflection Measured at Beam Midpoint, Deflection Normalized by Ju = 50 cm, Load Normalized by Pu = -800 kN; (b)
Lower Bound of the FHWA Shear Beam. Deflection Measured at Load Point, Deflection Normalized by Ju = 14 mm, Load Normalized by Pu = -3400 kN. . . 270
8-11 Effect of Strength Ratio on Normalized Load-Maximum Crack Width Behavior of Upper Bound of the FHWA Flexure Beam. Cracking eA,, Measured in Bottom Flange, Strain Normalized by = 5e 5x10⁻³ , Load Normalized by P = -800
kN... ... 271
8-12 Effect of Strength Ratio on Normalized Load-Maximum Crack Width Behavior of Lower Bound of the FHWA Shear Beam: (a) Flexure Cracking EP% Measured in Bottom Flange, Strain Normalized by pre m'ax= 5 x 10⁻³, Load Normalized by
PU = -3400 kN; (b) Shear Cracking E 1,j Measured in Web, Strain Normalized
Chapter 1
Introduction
1.1
Industrial Context
One of the primary challenges facing civil engineers today is the rehabilitation and replacement of a deteriorating and inadequate infrastructure. Many structures, especially those built in developed countries, are approaching or have exceeded their useful service lives. For example, approximately 30% of bridges in the U.S. are structurally deficient or functionally obsolete [27]. However, bridge repair comprises just a fraction of the estimated $900 billion gap between needed and existing infrastructure worldwide [38].
Presently, a new generation of fiber reinforced cementitious composites (FRCC), high per-formance cementitious composites (HP2C), with enhanced mechanical, durability, and aesthetic properties offer ideal high-tech/low-cost solutions for repair, retrofitting, and new construction of civil engineering infrastructure. Possible uses of HP2C include bridges, tunnels, pavements, nuclear waste barriers, etc., especially in severe environments (cold weather, marine environ-ments). An example of HP2C is DUCTALTM made by Lafarge, shown in Figure 1-1 as a facade panel application. These materials, which represent a technological leap for construction and construction materials, possess remarkable properties:
" Compressive, flexural, and tensile strengths 3 - 7 times higher than normal concrete; " An elasto-plastic ductile behavior - superior resistance in tension and bending after first
Figure 1-1: HP2C Panels for a Building Facade (ductal.com Web Site [241).
" Smaller section sizes which do not require secondary steel reinforcement, such as shear reinforcement in beams;
" High workability for easier in-situ placement;
" Quasi-impermeability - low risk of carbonation and penetration of chlorides and sulfates; " Negligible shrinkage and very low creep, which makes HP2C particularly suited for
pre-stressing applications.
The principal advantage of HP2C materials is their cost effectiveness. The price of HP2C is $2000/M 3 compared to $150/M3 for concrete and $5000/M3 for steel. However, the economic considerations in using HP2C should not be limited to the material itself. That is, when considered in the context of a construction project, the use of HP2C instead of concrete or steel can be economically advantageous:
* No passive reinforcement required: In addition to the savings in the cost of steel, design and set-up costs of secondary reinforcement are eliminated;
" Lower weight and volume: Structures composed of HP2C can be 2 - 3 times lighter than those composed of conventional concrete and as light as steel structures. This should also translate into lower placement costs;
Figure 1-2: Economic Benefits from Using DUCTALTAI (Lafarge [52]).
* Lower maintenance costs: HP2C structures, especially those situated in aggressive envi-ronments, have environmental resistances and longevities superior to those of conventional concrete structures.
A case study by Lafarge examined the potential cost savings of using HP2C instead of conventional materials for the construction of a bridge [51]. The bridge was a 2 kilometer long by 19 meter wide four lane bridge designed for automobile travel. Despite higher material costs, the use of HP2C yielded almost a 19% project cost reduction with substantial savings in steel, labor, equipment, and time costs. A chart which outlines the potential economic benefits of HP2C structures over conventional concrete structures is given in Figure 1-2 [52].
With enhanced mechanical, durability, and especially economic features, HP2C materials hold a great deal of promise for advancing cementitious material applications in the construction industry, propelling the restoration and modernization of the world's infrastructure. For exam-ple, in the U.S. alone, the concrete construction market is estimated to be $8 billion/year [12]. Therefore, HP2C materials represent an important breakthrough for addressing civil engineer-ing challenges.
Man-Material Ratio Mass/Volume Cement 1 713 kg/M 3 Silica Fume .325 232 kg/M 3 Ground Quartz .3 214 kg/M 3 Fine Sand 1.43 1019 kg/M 3 Steel Fibers .275 196 kg/M3 Superplasticizer .018 43 kg/M3 Water .2 143 kg/M3
Table 1.1: Mix Design for DUCTAL.
1.2
Characteristics of HP2C
The design of HP2C materials is based upon the optimization of the density of the cementitious matrix [22] and the length-diameter spectrum of the reinforcing fibers [73]. The optimization of the HP2C density is achieved through the precise selection of the granular mix, high-efficiency superplasticizers, and pozzolanic additives [17]. Optimization of the packing density has re-sulted in drastic reductions in the total porosity of the material which in turn yields extremely high strengths and excellent durability.
A typical HP2C mix-composition gives a mean 28 days cylinder compressive strength of 180 - 220 MPa, and a ductile tensile strength of 10 - 25 MPa. Among the first industrial applica-tions of HP2C are Reactive Powder Concretes [68,69], which are now known as DUCTALTM materials. The mix design for DUCTALTM is shown in Table 1.1. A fragment of DUCTALTM is pictured in Figure 1-3, exhibiting its high fiber content and random fiber orientation.
1.3
Research Motivation
The considerable economic advantages provided by HP2C over conventional concretes stem primarily from its ductility, the increase and maintenance of stress carrying capacity after cracking. HP2C has considerable tensile strength increases over conventional FRCC. However, without its ductility, the tensile strength of HP2C cannot be exploited in a meaningful and safe manner. Therefore, the ductility, shown after an effective flexural stress of 28 MPa in Figure 1-4, allows for the elimination of secondary steel reinforcement, such as shear stirrups in beams or even possibly steel reinforcement in columns, which translates into dramatic material, labor,
/
I
f
Figure 1-3: A Fragment of DUCTALTM.
50
45 0 iL 40- _ _ _ _ _-
Le
at acckdt
vceload
0 -0 5-- --
Level of normal serice loads
a 10
Wl 0~5
-0.0
Deflection (m m)
Figure 1-4: Comparison of the Flexural Strengths of HP2C (Ductal) and Conventional Concrete
equipment, and time savings.
Although it is clear that the ductility in HP2C exists, this research aims to answer the why and how. Why does this ductility in HP2C exist?; and how do we exploit these improvements in
ductility on a structural level? This examination addresses these questions in a holistic manner,
beginning with a micromechanical investigation, following with a material parameter study, and finishing with a structural analysis.
1.3.1 Research Objectives
To address the engineering science challenge, a comprehensive solution comprised of theory/modeling, experimental validation, and computer simulation is presented. This solution will explore HP2C ductility at the micromechanical level, the material level, and the structural level in order to manage three main research objectives:
Objective 1: Determine the sources of ductility at the micromechanical level
The sources of HP2C ductility can be traced to the micromechanical level, even the inter-action between a single reinforcing fiber and the matrix which encases it. To this end, a fiber pullout model is employed to identify the fundamental differences between normal FRCC mate-rials and HP2C which account for HP2C ductility. Next, the aggregate effect of the reinforcing fibers and cracks in the cementitious matrix are examined to quantify how micromechanical processes are manifested at the material level. Thus, the link between the micromechanical properties of HP2C components (i.e. reinforcing fibers, cementitious matrix, and cracks in the matrix) and the material behavior of HP2C is elucidated. In this way, one may ascertain the micromechanical input parameters which govern the ductile behavior of HP2C materials.
Objective 2: Develop a material model for HP2C-type materials
A constitutive model for HP2C is presented. This HP2C model is capable of reproducing the observed material behavior of HP2C in 1-D and 3-D. Although this is a macroscopic model, it is based on micromechanical processes. The model is particularly appropriate for capturing the ductile behavior of HP2C. Then, by using FRCC and HP2C experimental data, ductility at the material level is quantified. Furthermore, these mechanical models are implemented in computer applications which will serve as learning tools for students and engineers.
Micromechanical Structural Material Level Level Level >
Experimental
E
m
Verification
Determination
of the FEM
of Model Parameters
Micro-g Pullout to- 1-D 3-DTheory Material Model Model
Theory Finite Element -I Model
1-D
3-D
S e Simulation SimulationThe main purpose of the HP2C model, however, is its implementation in a finite element program. With this finite element program, one can simulate the behavior of HP2C struc-tures. Conversely, using the finite element program, one may deduce the material behavior of HP2C from structural experimental data. Finally, the structural simulation is used to exam-ining the effect of HP2C ductility on the structural behavior through a sensitivity analysis of ductility parameters. This provides insight into how HP2C ductility can be used for structural improvement.
In this way, a comprehensive micromechanical-material-structural solution for HP2C duc-tility modeling is shown. This comprehensive approach is diagrammed in Figure 1-5. Specific industrial and scientific benefits include guidelines for the efficient design of HP2C materials, an HP2C constitutive model for modeling the tensile behavior of HP2C, and computer simulations which will predict material and structural behavior and present possible improvements for the design of HP2C structures.
1.4
Outline of Thesis
This work is divided into nine chapters, examining HP2C ductility in a step-by-step process, starting with the micromechanical behavior, moving on to the material behavior, and finishing with structural simulation. Chapter 2 begins this examination at the micromechanical level. This chapter outlines previously developed models and theories on fiber pullout, especially considered at the point of pullout capacity. In this way, one can achieve greater insight into the mechanisms which promote ductility in these materials. Reexamination of these pullout model yields different length scales related to fiber-matrix interaction: an elastic embedment length, an anchorage length, a radial influence zone, an optimal fiber radius, and a frictional embedment length. These length scales offer general guidelines for the effective design of FRCC materials, particularly with regard to fiber content and fiber geometry.
Chapter 3 examines the link between the micromechanical behavior and the material behav-ior. In addition to examining previous work on this subject, this micromechanical-material link is studied for HP2C-specific behavior. In particular, the combined effect of the matrix cracking and fiber pullout on the material behavior is examined using different cracking schemes.
Chapter 4 presents a 1-D constitutive model for FRCC and HP2C. This model is a two-phase model based on the material composition with one-phase representing the matrix, the other the reinforcing fibers. In addition, the matrix-fiber interaction, as examined in the micromechanical study, is taken into account as internal cross-effects between the irreversible deformations of the composite constituents. The energy states and energy transformation is studied which ultimately leads to an elucidation and quantification of the improvement in ductility offered by HP2C. This model is applied to experimental data on HP2C and FRCC to demonstrate material improvements in HP2C over FRCC.
In Chapter 5, this 1-D constitutive model is then extended to 3-D by replacing the scalar quantities in the governing equations by their tensorial counterparts and replacing the 1-D loading criteria with 3-D yield criteria. The energy study of the previous chapter is expanded to examine HP2C ductility in 3-D. Next, a method for determining the 3-D model parameters is presented. In this way, experimental data can be used to calibrate a practical HP2C 3-D model. Chapter 6 applies the HP2C models i computer programs. First the 1-D and 3-D models are employed in load-point simulation programs coded in Java. These programs show how the material parameters affect the mechanical behavior of these materials. Next, the 3-D model is implemented in a finite element program. The program is then verified for consistency and stability with respect to the analytical models and mesh size to demonstrate the viability of this finite element implementation.
In Chapter 7, the finite element program is used for structural simulation. The effective-ness of the model and finite element program is validated with experimental data, including a bending test and a shear test. Size effects in HP2C material behavior are also investigated with small scale beam tests. The potential of the inverse analysis is also shown where material parameters are deduced from experimental structural data. Next, in Chapter 8, the effect of HP2C ductility on structural behavior is studied. The ductility enhancement, which is con-trolled at the micromechanical level and designed at the material level, manifests itself at the structural level. The potential structural uses of HP2C ductility are explored with a sensitivity analysis of ductility parameters.
Chapter 9 summarizes the results of this project, particularly the scientific findings. Finally, suggestions for further research are provided.
Part I
MICRO-TO-MACROSCOPIC
Chapter 2
Micromechanical Sources of
Ductility
This investigation into ductility begins at the micromechanical level, that is the scale of an individual fiber, the matrix which encases this fiber, and their interaction through the matrix-fiber interface. Ductility is rooted in a material's capacity to dissipate energy, particularly after energy dissipation has initiated, i.e. sustained energy dissipation. In terms of FRCC and HP2C materials, ductility is centered around the material's capacity to exploit its dissipative mechanisms after cracks begin to form in the matrix. This includes, fiber yielding, fiber pullout, multiple cracking in the matrix, etc. Using various fiber pullout models, these dissipative energy sources are explored in this chapter.
2.1
The Fiber Pullout Model
The loading and pullout behavior of a single fiber is usually modeled from known parameters, including the material behavior and geometries of the fiber, the matrix, and the matrix-fiber interface. These fiber pullout models often assume that through the elastic loading phase, the fiber and matrix are bonded by the interface, which transfers stresses from the fiber to the matrix. Assuming the fiber and matrix have not failed, an interfacial crack forms and propagates creating a debonding zone as the load increases. This is depicted in Figure 2-1. Shear stresses can also be transferred through the debonding zone through frictional stresses. When the fiber
Figure 2-1: Interface Failure at the Crack Face (Li et al. [59]).
becomes fully debonded, the fiber begins to slip as the imposed deflection increases. As slip increases, the fiber-matrix contact zone decreases. This causes the load transfer capability to decrease.
There are three distinct phases in the loading and pullout of the fiber: the elastic stage, fiber debonding and/or yielding, and the fiber slip stage (if any). The first two phases will be considered using dimensional analyses of various FRCC models. Two aspects in particular will be examined: transfer of elastic stresses along the fiber-matrix interface, and onset of FRCC yielding or failure. One of the most common micromechanical systems for fiber pullout studies is the three-body model introduced by Budiansky et al. [10], shown in Fig. 2-2. This fiber loading model assumes that the fibers are aligned and regularly distributed in the matrix. The free body is composed of a fiber (radius rf) and a matrix layer, separated by an interface layer of finite thickness e = R* - rf. Let P = -f Af be the normal stress resultant at the free end of
the fiber (or fiber force) over the fiber section Af = 7rrf, the average longitudinal fiber stress, and ro the shear stress at the fiber perimeter at r = rf. Elementary force equilibrium over a
fiber element of length dz gives:
duf 2-r
(2.1)
r
rf
R* = radius of matrix only carrying shear stresses rf= radius of fiber Interface MatrixFigure 2-2: Budiansky's Three-Body Matrix-Interface-Fiber System [10].
and the momentum balance in the matrix reduces to:
da, d(r,)
dz dr (2.2)
with um = az2 the longitudinal stress in the direction of the fiber alignment, and Tm = azr the shear stress. In the interface zone r E]rf, R*[, the longitudinal stress is assumed to be zero, which requires that the shear stress decreases with 1/r, i.e. from integration of the last term of (2.2), rm(r, z)/ro(z) = rf/r.
With Eqs. (2.1) and (2.2) in hand, the various fiber loading models differ only in the constitutive law applied for the three components of the three-body system. This scheme is
depicted in Fig. 2-3.
2.2
Length Scales of FRCC
In this section, fiber pullout models used by various researchers are reviewed and investigated using assorted mathematical schemes including dimensional analyses and variational methods.
-CmZ) Z
/z
m - Matrix f- Fiber m i f i -Interface z Crack LocationP
Figure 2-3: Three-Body Matrix-Interface-Fiber System (Lim et al. [63]).
These mathematical schemes provide length scales related to intrinsic material behavior. These length scales reveal the sources of HP2C ductility improvement over FRCC as well as suggest guidelines for the efficient design of FRCC and HP2C.
2.2.1 Elastic Embedment Length
The elastic load transfer from the fiber to the matrix requires a certain embedment length. It is generally assumed that the shear stress at the interface obeys an elastic interface constitutive relation of the form [4]:
ro(z)
-ks[[w]
= k8(wf(z) - wm(z)) (2.3)where [[w] = wf (z) - wm(z) is the displacement between the fiber (subscript
"f
") and the matrix (subscript "m"). The slip modulus, k, (of dimension [ks] = MT- 2L-2), is defined to bethe shear stress per unit of displacement between the fiber and matrix. An estimate of this slip behavior has been given by Budiansky et al. [10], by assuming a continuous elastic behavior of
the matrix constituting the interface zone:
Ow(r,
z) Tm(r, Z) _To(z) rfr Or 2rz - - - (2.4)
where pm Em/2(1 + vr) is the shear modulus of the matrix, -r is the shear strain in the interface zone, Em the Young's modulus of the matrix, and vm the Poisson's ratio of the matrix. Integration over r, with the boundary conditions w(r rf, z)wf(z) and w(r = R*, z) = wm(z)
yields the slip modulus:
ks = m (2.5)
rf in
To simplify the model, Budiansky equates the shear stresses generated in the matrix to an interfacial layer comprised purely of a shear stress equal to the maximum interfacial shear stress, TO. In this way, Budiansky et al. provide an estimate for the thickness of the interface zone [10]:
1n(R*I\f) = 2ln cf + cm(3 - cf) (26)
n(*/rf) 4c(
where cf and cm = 1 - cf respectively denote the volume fractions of fibers and matrix in
the composite. For FRCC and HP2C the maximum fiber volume ratio is often restricted to
cf = 1 - 5% in order to maintain reasonable workability. Applying this to (2.2) gives:
R*/rf =2.5 - 5 (2.7)
This shows that the thickness e of the interface zone in FRCC and HP2C is typically on the order of 2-4 times the fiber radius. The small values of the interface thickness, e is on the order of .5 mm, justify a posteriori the lumped interface behavior (2.3) for the purposes of modeling. This reduces the three-body system to a two-body system separated by a (fixed) surface of discontinuity, where the displacement is discontinuous, but the shear stress is continuous, i.e. Tm(r = rf) = To.
For this two-body elastic system, combining (2.1) and (2.3) yields:
d 2c-
2ks 2k (2.8)
where an elastic fiber behavior is assumed, Ocf = P/Af = EfOwf/Oz, with Ef denoting the elastic modulus of the fiber. e(z) =
(OWm/z)r,=,f
is the longitudinal strain on the matrix side of the interface, which is zero at the crack face, i.e. e(z = 0) = 0, and increases along z due to the fiber-matrix stress transfer over the common interface, until the strain in both matrix and fiber have the same value. Without solving Eqs. (2.8) and (2.2), by applying appropriate boundary conditions, it appears that the elastic stress transfer into the matrix is governed bya characteristic length:
Srf Ef Ef ln(R*/rf) (2.9)
eS 2k5 cxr
The illustration is straightforward by considering a linear transform of the spatial coordinate
z = (5z, where z =0 (1) -+ J = z/.f. Using (2.8) gives:
2 ,7f= U f - E f E (2 .1 0 )
Inspecting the previous equation for (2
>>
1 shows that the fiber strain far from the crack facereaches the same value as the matrix, indicating a perfect elastic slip-less behavior of composite:
62 >> 1 -+ z > a': = Ef E' *-+ E0 m _ &Wf (2.11)
As it is well known from homogenization theories of composite materials, this strain compati-bility represents a maximum elastic energy state, as both matrix and fibers deform in the same way, and can be considered as an optimized composite behavior.
Conversely, for 62
>
1, according to (2.1) and (2.10), the embedment length is too small to transfer stresses from the fiber into the matrix. In between these limit cases, the length f, given by (2.9) defines a minimum required embedment length for an elastic stress transfer offiber stresses bridging a crack, requiring a minimum fiber length Lf, typically:
Lf/2 > 4 - 5 X fe+_ 62 = 16 - 25 > 1 (2.12)
This is demonstrated in Figure 2-4 where the interfacial shear stresses induced by pullout approach zero at a distance 4 - 5 x f, from the crack face [10, 54]. For FRCC and HP2C, typical values of fiber and concrete material parameters, summarized in Table 2.1 (values from
1.2 0.8 0.6 0.4 0 z 0.2 0 0 1 2 3 4 5 6
Normalized Longitudinal Distance [1]
Figure 2-4: Normalized Interfacial Shear Stress (ro(z)/To(O)) vs. Normalized Distance from Crack Face (z/f,). Expression for Shear Stress Provided by Leung and Li [54].
Steel Fiber
Tensile Strength, o-fu 500 -1200 MPa
Tensile Modulus, Ej 200 GPa
Radius, rf 0.1 - 0.5 mm
Total Length, Lf 15 - 40 mm
Embedment Length, Lf /2 7 - 20 mm
Normal Strength Concrete Fiber Volume Content, Cf 1 -3%
Tensile Strength, m 2 - 5 MPa
Shear Strength, rm. 2 - 5 MPa
Interface Bond Strength, T 2 - 7 MPa
Interface Friction Strength, Ti 1 - 5 MPa
Tensile Modulus, Em 20 - 25 MPa
Shear Modulus, Am 10 - 15 MPa
Interface Fracture Energy, 1i 6 - 22 J/m2 High Strength Concrete
Fiber Volume Content, Cf 3 - 5%
Tensile Strength, am, 7 - 20 MPa
Shear Strength, Tmu 7 - 20 MPa
Interface Bond Strength, rm 7 - 15 MPa Interface Friction Strength, T. 1 - 10 MPa
Tensile Modulus, Em 40 -60 MPa
Shear Modulus, Am 20 - 25 MPa
Interface Fracture Energy, Li 25 - 100 J/m2
Table 2.1: Typical Values of Fiber and Concrete Material Parameters.
[40,44,51,63,74,77]), are cf = 1 - 5%, rf = 0.1 - 0.5 mm, Ef = 200 GPa, pm = 10 - 15 GPa for FRCC and pm = 20 - 25 GPa for HP2C; thus
s _ Ef ln(R*/rf) -2-4
22 - 4 (2.13)
Hence, a minimum fiber length to fiber radius ratio on the order of Lf /rf > 16 - 40 is required to ensure an optimized elastic stress transfer in cementitious composites. This is generally the case, given typical fiber lengths employed for FRCC and HP2C, for which Lf
/rf
- 30 - 150.In this section, the fiber length was optimized for strain compatibility. This, however, is only a consideration for pure elasticity. At pullout failure, the fiber should be designed with
Stress,&
0*0
Gfu
Fiber Stress
- /Interface Shear Stress
Fiber * P
Elastic Bonding a Free
Zone
End
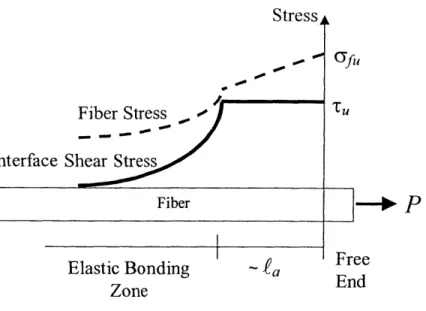
Figure 2-5: Possible Stress Profiles in the Fiber and the Interface at the Point of Fiber Yielding.
regard to yield or failure criteria. This is addressed in the subsequent sections.
2.2.2 Anchorage Length - Stress Criterion
The elastic stress transfer from the fiber to the matrix is restricted by the strengths of the composite components, fiber, matrix, and interface. As a first approach, consider only the strength of the fiber and interface, by introducing, in addition to the equilibrium condition (2.1), the following strength criteria:
af - Ocfu 0; To - Tu <
0
(2.14)where the subscript "u" denotes the yield capacity. For the sake of simplicity, assume a rigid-plastic behavior for the fiber, matrix, and interface in this and subsequent analyses in this chapter. This should be acceptable for this study which is concerned with orders of magnitude, not exact values.
This is roughly along the lines of assumptions that led Kelly [46], to the derivation of a critical embedment length fa:
To reveal its physical significance, it is useful to rederive Kelly's length scale from the first principles of dimensional analysis [8], by introducing the following linear transformations of all parameters and functions involved in (2.1) and (2.14):
z = Zz'; To = To';, rf = Rf ruf; Orfu = Efs'5; 0-f = f' 'U = TU'
where z', r', 0', a ', To'f, and T' are the dimensionless counterparts of parameters z, rf, O-f TO, Ufu,
and Tr of dimension Z, Rf, Ef, To, Efu, and T. Use of (2.16) in (2.1) and (2.14) yields:
Rf>
f
G-'f
2T'OZTo Oz' r'
Ef -' f-o-'g,<0; T'- ' <0 Dimensional homogeneity requires of these two equations:
Ef To Rf Ef
Efu TU ZT
and leads to the identification of the following parameters:
(2.17) (2.18) (2.19) r - -f - ; -fu Of u 7r2 - TU - - 7, ; (2.20) 7r3 -fz - 1 r~f f/ro
Since invariants can always be redefined as product and power functions of previously identified parameters 7r1, 7r2, and ir3, one may choose the following:
afu
TO
T - Z = r 1712r2- 1 3 =
-fa
where the gauge length normalizing the z-coordinate is Kelly's critical length scale,
fa,
given by (2.15). Proceeding as in the previous subsection, let 2z = Laz with 0 0(1) <-+ J = z/Lin (2.1) and (2.14):
j-1 0; T -1 < 0 (2.22)
(2.16)
(2.21)
The dimensionless forms in (2.22) indicate that the maximum stress transfer occurs for S = 1, for which the strength capacity of both fiber and interface can be activated. In turn, for
>
1, T = 0; this implies for long fibers Lf/2>
fa, that the composite behavior is dominated by fiber yielding, confining anchorage effects into small zones at the crack face over a lengthfa. This is shown in Figure 2-5, and is similar to steel bar reinforcement of reinforced concrete
structures, in which the anchorage length of the bar is short in comparison to the entire bar. Conversely, for 6 < 1, associated with short fiber lengths Lf /2
<
fa, the composite behavior is dominated by interface strength restrictions, with a negligible fiber stress gradient &o7f/az -+ 0.For normal strength FRCC (Table 2.1), Kelly's critical length is on the order of:
FRCC: La = 50 - 150 mm (2.23)
This indicates that the most common failure mode of FRCC with typical fiber lengths Lf < 40 mm
<
2fa, will be fiber slippage and pullout, not fiber rupture, as the critical anchoragelengths are rarely achieved. This implies that the strength of the fibers is underutilized, and fiber slippage occurs before a significant fraction of the fiber strength is activated. One way to address this problem is to use hooked fibers. Alternatively, one could employ lower strength fibers with strengths o-fu - 100 MPa to better suit the low bond strength of normal strength
concretes.
However, for HP2C (Table 2.1):
HP2C: La = 10 - 40 mm (2.24)
This is a better material match for typical fibers lengths employed in HP2C, as Lf /2fa ap-proaches unity. Therefore, the amount of energy in HP2C, which can be dissipated by both fiber slippage and fiber yielding, is larger than in FRCC, and contributes to the enhanced ductility property of HP2C. In the case of HP2C, hooked end fibers would not be necessary.
2.2.3 Radial Influence Zone
To this point, the restricted matrix strength domain has been disregarded. Supporting this assumption is the fact that the shear is maximum at the interface, and restricted through