3rd International Conference on Bio-Based Building Materials
June 26th - 28th 2019 Belfast, UK
ID_ UUU148
BIOCHAR-CONCRETE COMPOSITE: MANUFACTURING,
CHARACTERIZATION AND PERFORMANCE EVALUATION AT
ELEVATED TEMPERATURE
Souradeep Gupta1*, Harn Wei Kua1, Sze Dai Pang2 1 Department of Building, National University of Singapore2 Department of Civil and Environmental Engineering, National University of Singapore *Corresponding author; e-mail: [email protected]
Abstract
Filler additives in concrete influence its mechanical and permeability properties under normal and elevated temperature during serviceability stage of structure. However, there is limited investigation about influence of bio-based fillers material on strength and durability of structural concrete at elevated temperature. This study explores the mechanical and permeability performance of biochar-concrete composites under normal condition and after thermal damage at elevated temperature (300 ˚C and 550˚C). Biochar is prepared by pyrolysis of locally collected wood waste at 500˚C (BC500). The strength and permeability performance of BC 500 concrete are compared with plain concrete and concrete with silica fume (added at 10% replacement of cement) exposed to similar conditions. The findings show that addition of 0.50 %-1 % BC500 increase compressive strength at 7-day and 28-day age compared to control mix by 15-20% under normal condition. This is linked to densification effect of biochar through filler effect and reduction of effective water-cement ratio. Concrete with silica fume and 1-2 wt.% of BC 500 show similar improvement in water tightness (35-45%) compared to control concrete. At elevated temperature, addition of 1-2 wt.% BC 500 is found to minimize loss in weight and strength compared to control and concrete with silica fume. Investigations show that biochar addition leads to lower damage to microstructure of concrete during thermal treatment, leading to 22-25% higher residual strength and water tightness compared to control mix. The findings suggest that addition of biochar has the potential to improve serviceability performance of concrete structures, which is also an effective way to promote recycling of wood waste.
Keywords:
Biochar; Concrete; Permeability; Strength; Silica fume
1 INTRODUCTION
Concrete members at close proximity to furnace or reactors may be exposed to high temperature (Janotka and Nürnbergerová 2005; Sakr and El-Hakim 2005). Mechanical properties including strength and elastic modulus of concrete are affected during such exposures, which may lead to structural failures (Ali et al. 2004; Xiao and König 2004). Therefore, assessing mechanical and permeability properties of concrete after exposure to elevated temperature is important to estimate the suitability of its use under such conditions. Degradation of chemical composition and physical structure of concrete matrix takes place at several stages. Dehydration of calcium silicate hydrate gel (C-S-H) gel by release of chemically bound water is significant above 110˚C (Khoury et al. 2002; Serrano et al. 2016). At 300˚C, thermal expansion due to development of internal stresses in aggregates lead to development of internal micro-cracking. Calcium hydroxide, which is one of the major hydration products, disassociated between 400˚C - 550˚C (Borges et al.
2010; Rostami et al. 2012), leading to shrinkage cracks and increase in permeability of concrete. Therefore, at 500˚C and above, the microstructural changes occurring in concrete are irreversible, which results in significant deterioration of mechanical and durability performance.
Performance of concrete exposed to normal and elevated temperature is influenced by fillers and additives present in the matrix(Noumowe 2005; Uysal 2012). Uysal (Uysal 2012) reported that addition of limestone powder at 10% replacement level of cement led to loss in compressive strength by 13% compared to control concrete at 400˚C, while the residual compressive strength was lower by 33% compared to its counterpart exposed to normal temperature. Highly dense microstructure leads to build-up of internal pressure resulting in more severe internal damage and degradation of chemical structure of the matrix. Similar case is reported for silica fume – addition of silica fume to normal concrete results in more spalling at 300˚C due to highly densified pore structure and build-up of
internal pressure (Hertz 1992; Noumowe et al. 1996). Contradicting findings are reported Saad et al.(Saad et al. 1996) – addition of 10% silica fume by weight of cement leads to lower water absorption and higher compressive strength compared to control, exposed at temperature of 200-600˚C. The authors attributed this to lower calcium hydroxide in the matrix due to pozzolanic action of silica fume.
Filler materials for concrete are widely researched because of their potential to reduce cost and increase waste recycling. Earlier studies suggest that there is a lack of discernible findings on a suitable filler material, which would not significantly affect properties of concrete at both normal and elevated temperature. However, there is an indication that presence of discrete pores in the matrix without affecting original properties of concrete, may improve residual strength and permeability during exposure to high temperature. Biochar, produced by pyrolysis of waste biomass, may be a potential material to improve properties of concrete under normal and elevated temperature. Biochar contains pores of wide size range created due to escape of volatiles during pyrolysis. These pores absorb part of mixing water during concrete preparation resulting in reduction of free water in pores of matrix (Choi et al. 2012; Gupta and Kua 2018; Gupta and Kua 2018). It is hypothesized that these pores can also act as valves for pressure release of water vapour during exposure to elevated temperature.
Nevertheless, biochar has immense environmental benefit in the form of reduced landfilling and decay of organic wastes, and fixing of stable carbon sequestered in the structure of biochar during pyrolysis. Roberts et al.(Roberts et al. 2009) reported that biochar has the potential to reduce 870 kg CO2-e of greenhouse gases per ton of dry feedstock, which also means significant reduction in annual global anthropogenic emission about 12%)(Woolf et al. 2010).
The study aims to explore the effect of biochar addition on mechanical and permeability properties of concrete exposed to normal and elevated temperature. After wet-curing over 28 days, control and biochar added concrete were exposed to 300˚C and 550˚C. Performance of biochar added concrete is compared with concrete containing silica fume at 10% replacement of cement by weight.
2 MATERIALS AND METHODS
2.1 Cement, sand and silica fume used
Ordinary Portland cement 52.5 N Type 1 conforming to ASTM C150 is used for all the concrete mixes. In one of the concrete mixes, 10 wt.% of cement is replaced by undensified silica fume (Elkem 940 U). Locally available river sand was used. Fineness modulus and specific gravity of the sand are 2.54 and 2.65 respectively. Maximum size of sand used is 4 mm, and the gradation conforms to ASTM C33. Coarse aggregate with maximum size of 19 mm is used. The oven-dry unit weight and water absorption capacity of coarse aggregates are 1650 kg/m3 and 0.80% respectively. 2.2 Biochar preparation and characterization Biochar, used in this study. Is produced from locally collected mixed wood saw dust, which is a by-product
of the wood milling industry. Wood waste is used to produce biochar because significant fraction of waste (530,700 ton of wood waste in 2016) generated in Singapore comes from the local furniture and milling industry (NEA 2015). The collected mixed wood saw dust is dried at 80˚C for 16-18 hours before pyrolysis. The pyrolysis was carried out in a tightly sealed furnace at heating rate of 10˚C/min. Saw dust was pyrolyzed at 500˚C over 1 hour before it is allowed to cool down to room temperature.
Based on the results of previous study(Gupta and Kua 2018), biochar particles less than 200 µm size is used as additive to concrete mix. Size distribution estimated by laser diffraction method showed that the prepared biochar (BC500) has a wide size range – from 5µm to 200µm with d50 of 12 µm – while cement particles are in the range of 4µm to 50µm. About 45% of BC500 particles are finer than 10µm, which implies that there is significant percentage of biochar particles finer than coarser cement grains.
Elemental composition of biochar determined by electron dispersive spectroscopy (EDS) showed presence of 87% carbon along with trace amount of silicon (0.45%), aluminum (1.35%), magnesium (0.51%) and calcium (0.65%). Skeletal density of biochar, determined by gas pycnometry (Ultrapyc 1200e, Quantacrome) is 1.55.
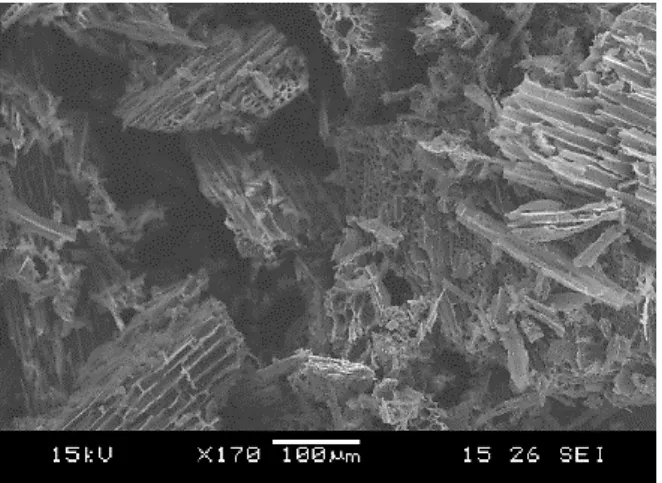
Fig. 1 shows scanning electron micrograph of particles and pores formed during pyrolysis in biochar prepared at 500˚C. One can observe that biochar prepared from saw dust has elongated shape and fibrillar structure irrespective of preparation temperature, which is typical of biochar prepared from softwood (Ghani et al. 2013). The surface of the biochar particle shows ridges and honeycomb pores, which are produced during pyrolysis or inherited from the woody and biological capillary structure of the feedstock (Ghani et al. 2013). These pores play important role in regulating water content in the cementitious mix and offering nucleation sites for cement hydration (Gupta et al.,2018).
Fig. 1. SEM micrograph of produced biochar (BC 500)
Specific surface area of biochar was determined by BET (Brunauer-Emmett-Teller) N2-adsorption on Micromeritics ASAP 2020 Plus instrument. 40-45 mg of sample was weighed and degassed for 4 hours at 105˚C. BET surface area of BC500 is 196.92 m2/g. Micro-pore area and Micro-pore volumes, estimated from N2 adsorption using Dubinin-Radushkevich (DR)
equation are 142.50 m2/g and 0.071 cm3/g respectively. Average size of macro-pores in biochar determined by mercury intrusion porosimetry (Autopore IV 9500) is 27 µm.
2.3 Mix design
A total of 5 concrete mixes including control mix (plain concrete with no additions, ‘PC (control)’) are prepared for this study. Water-binder ratio (w/b) is maintained at 0.40 for all the mixes. Based on the previous studies carried out in our laboratory (Gupta and Kua 2018), the
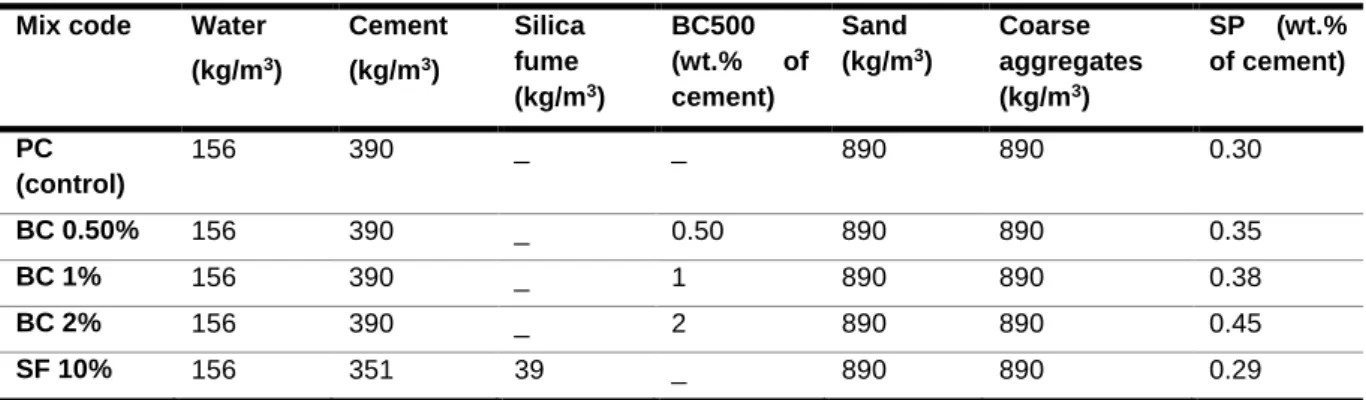
dosage of BC 500 was maintained at 0.50% (BC 0.50%), 1% (BC 1%) and 2% (BC 2%) of weight of cement. Silica fume is commonly used in the local construction industry as a micro-filler and pozzolanic material to achieve high strength concrete. Therefore, another concrete mix is designed with silica fume to replace 10 wt.% of cement (SF10%) to compare its performance with biochar added concrete. To maintain sufficient workability, polycarboxylate based superplasticizer (SP) (ADVA 181, W.R. Grace Asia) was used at 0.30-0.45% of cement weight. Detailed mix proportion is presented in Table 1.
Table 1. Detailed mix proportion for prepared concrete mixes
Mix code Water (kg/m3) Cement (kg/m3) Silica fume (kg/m3) BC500 (wt.% of cement) Sand (kg/m3) Coarse aggregates (kg/m3) SP (wt.% of cement) PC (control) 156 390 _ _ 890 890 0.30 BC 0.50% 156 390 _ 0.50 890 890 0.35 BC 1% 156 390 _ 1 890 890 0.38 BC 2% 156 390 _ 2 890 890 0.45 SF 10% 156 351 39 _ 890 890 0.29
2.4 Casting, curing and test methodology
Each concrete mix is cast in cylinder molds (100 mm (d) x 200 mm(h)) and steel prisms (300 mm(span) x 80 mm (depth) x 80mm (height)) to test for variation in compressive strength, permeability, and flexural strength. Fresh concrete was placed in three layers by placing the molds on vibration table for sufficient compaction. The cast specimens were covered by polythene sheets to minimize moisture loss by evaporation, and placed in a controlled environment of 25˚C and 70% relative humidity until demolding. Thereafter, hardened concrete samples were placed in fog room for curing at temperature 28±2 ˚C.
Compressive strength was measured at 7-day and 28-day age of concrete, while all other tests were carried out at 28-day age. The top surface of concrete cylinders were ground using a rotary grinder to ensure uniform distribution of load. Load-controlled strength test was carried out at 157 KN/min. Permeability of undamaged concrete and thermally damaged concrete were explored using capillary absorption and sorptivity test according to ASTM C1585. Samples of dimension 50 mm (h) x 100 mm (d) were wet cut from the middle of 200mm (h) x 100 mm (d) cylinders and conditioned according to standard (ASTM C1585) prior to testing. Water absorption was measured over a 10-day period. At 28th day, part of the samples from each mix were subjected to elevated temperature (300˚C and 550˚C) in an electrically heated kiln. Heating rate was maintained at 5˚C/minute. Samples were exposed to 300˚C or 550˚C for 2 hours. Thereafter, the kiln was turned off and the samples were allowed to cool inside to prevent thermal shock to the specimens. Mass of samples prior to heating and after heating were measured. Mechanical and permeability tests were conducted on the thermally treated samples within 24 hours of complete cooling to ambient temperature.
3 RESULTS AND DISCUSSION
3.1 Weight loss after exposure to elevated temperature
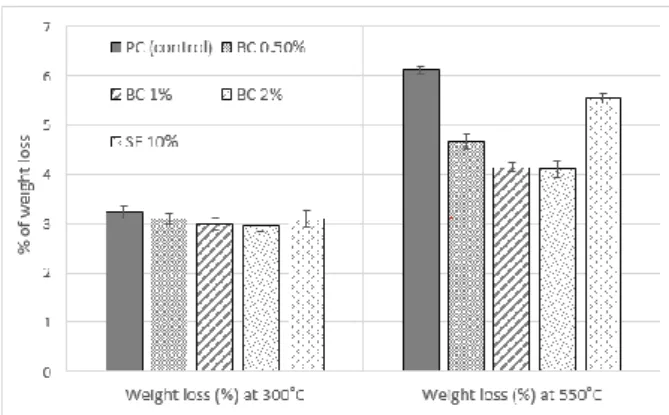
Effect of elevated temperature on weight loss of concrete mixes is shown in Fig. 2. As expected, the weight loss is higher at 550˚C compared to that at 300˚C. All the concrete mixes show similar weight loss when exposed to 300˚C; however, control concrete and SF 10% show steep rise in weight loss at 550˚C. Mixes with biochar show relatively lower weight loss compared to PC (control) and SF10%. Weight loss due to exposure to high temperature in concrete can be distinguished into two broad categories – weight loss between 200 - 400˚C and weight loss beyond 550˚C . Weight loss up to 300˚C can be attributed to moisture loss from the concrete core and surfaces to the surrounding environment, and some decomposition of calcium silicate hydrate (C-S-H) (Awal and Shehu 2015; Uysal 2012). At this temperature, mix with biochar experience similar weight loss as the control mixes which may be attributed to loss of moisture held by the pores of biochar besides decomposition of binder gel. As the temperature is increased to 550˚C, the degradation of concrete involves micro-cracking, some spalling and more severe decomposition of C-S-H and calcium hydroxide (CH) due to loss of chemically bound water (Awal and Shehu 2015). Concrete mix with silica fume contains more calcium silicate hydrate due to pozzolanic action, which explains drastic increase in weight loss of this mix at 550˚C. Similar trend is also reported by Saad et al.(Saad et al. 1996) that concrete with 10% silica fume showed significant weight loss at temperature of 500-600˚C.
Loss in mass is reduced in biochar-concrete as with increase in biochar dosage. As the dosage of biochar is increased, more discrete pores are introduced in the
matrix, that helps in release of built up internal pressure during exposure at high temperature. It leads to lesser internal damage, which is also supported by strength and permeability results and observation of micro-structure through SEM imaging.
Fig.2. Weight loss during exposure to 300˚C and 550˚C 3.2 Effect on compressive strength at elevated
temperature
Table 2 presents the 7-day and 28-day compressive strength of concrete mixes under normal condition. Addition of 0.50%, 1% and 2% BC500 resulted in increase in compressive strength by 18%, 13% and 10% respectively, which are significant at 95% confidence interval (p-value < p critical =0.05, Table 2). As expected, silica fume also resulted in significantly higher 7-day strength than PC (control), attributed to its filler and pozzolanic action that improves compactness and hydration of concrete matrix (Mindess et al. 2003). However, one can see that addition of 0.50% BC 500 produce concrete of similar 7-day strength as silica fume addition (p-value = 0.88 > 0.05). Similar effect on strength due to biochar addition is also reflected at 28-day age of concrete – BC 0.50%, BC 1% and BC 2% show strength improvement of 16%, 10% and 9% compared to PC (control). Although the scale of improvement is lower than that at 7-day, it is significant at 95% confidence interval (Table 2).
Table 2. 7-day and 28-day compressive strength of concrete mixes under normal temperature. Standard deviation presented in brackets. Statistical significance is checked using p-vale from t-test at5 95% confidence interval Mix name 7-day strength (MPa) 28-day strength (MPa) p-value at 7-day (pcritical =0.05) p-value at 28-day (pcritical =0.05) PC (control) 51.54 (0.40) 59.51 (1.71) _ _ BC 0.50% 60.66 (2.13) 68.93 (1.01) 0.018 0.004 BC 1% 58.11 (0.84) 65.39 (1.30) 0.007 0.018 BC 2% 56.82 (1.70) 64.94 (2.01) 0.035 0.037 SF 10% 60.96 (2.60) 69.80 (2.20) 0.047 0.008
Increase in strength due to addition of biochar is related to water absorption and retention capacity of biochar (Choi et al. 2012; Gupta and Kua 2018). During mixing of concrete, dry biochar particles absorb part of mixing water, which results in lower free water-cement ratio in the concrete matrix. Retention of water by biochar leads to densification of cement matrix by reducing the free water in pores of concrete during initial hardening. The absorbed water in biochar pores is later supplied internally for continuing hydration of cement, which also contributes to strength of cementitous matrix (Choi et al. 2012; Gupta and Kua 2018). Moreover, 40% of BC 500 is lower than 10 µm, meaning that a significant fraction of added biochar is finer than coarser cement grains and the interfacial transition zone between cementitous matrix and coarse aggregates, that typically varies between 20-40 µm. Therefore, the finer fraction of biochar induces filler effect, thereby reducing the voids and gaps between cement grains and aggregates. Fig. 3 shows the residual compressive strength and loss in strength of concrete mixes after exposure to 300˚C and 500˚C. At 300˚C, the loss in strength varied only between 3-5 % for the control mix and SF10% mix. BC 1% and BC 2% showed similar or slightly higher strength at 300˚C compared to 28-day strength under normal condition. It may be partially attributed to the strengthening of cement paste during evaporation of free moisture resulting in higher Van Der Waal’s force due to better packing of cement gel layers(Khoury 1992; Khoury et al. 2002). At 300˚C, some of the water from the interlayer of C-S-H and combined water in sulfoaluminate hydrate evaporates (Ahmed et al. 1992), although CH does not decompose below 350˚C. Therefore, the binding capacity of cement paste is not significantly compromised, which explains lower loss in strength at this temperature.
However, at 550˚C plain concrete and SF 10% show steep reduction in residual strength, which is lower by 17% and 22% respectively compared to their counterparts under normal condition. Among the biochar samples, highest strength loss is shown by BC 0.50% (about 13%), while BC 1% and BC 2% demonstrated strength loss between 8-10%. Temperature of 500- 600˚C triggers a series of chemical changes in cementitous matrix including partial destruction of C-S-H gel, desiccation of pore system and decomposition of CH, that induce internal and surface micro-cracking (Aydın and Baradan 2007). Decomposition of CH to lime and water vapour is not critical to strength loss although expansion of lime during cooling period may lead to significant internal damage (Lin et al. 1996). Although pozzolanic conversion of CH to C-S-H in 10% SF sample reduces the damaging effect due to CH decomposition and lime expansion, damage to binder gel structure and internal build-up of pressure resulted in severe micro-cracking (Fig 4(b)).
In case of biochar containing samples such severe cracking was not observed. Although capillary porosity is reduced due to biochar addition, discrete pores in biochar particles serve as release valves for water vapour at 550˚C. Secondly, lower water in pores mean reduced pressure on pore walls when the free water turns into vapour. Combination of these effects lead to reduced pressure build-up in concrete containing BC 500.
Fig. 3. Residual compressive strength and loss in strength in control and biochar-concrete composites
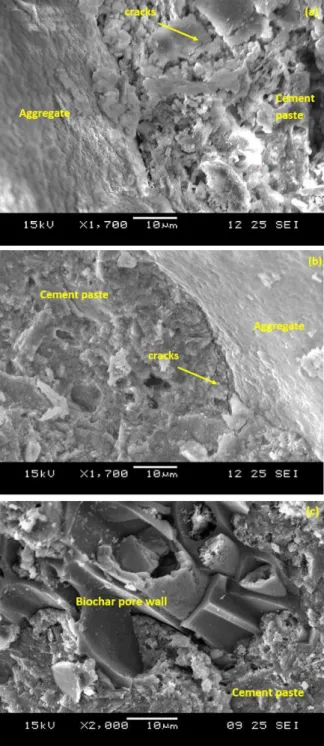
Fig. 4. Surface micro-cracking in (a) plain concrete (b) SF_10% concrete
Fig. 5(a) and (b) shows the ITZ in Plain concrete (control) and concrete with 1% BC 500 addition respectively. Plain concrete shows damage in the binder gel and numerous pores are created close to the aggregate-paste boundary. It may be due to decomposition of CH crystals, that generally occupy pore spaces in cementitous paste (Mindess et al. 2003). In case of BC 1% paste, the ITZ is relatively less damaged compared to plain concrete. Although cracking is observed at aggregate-paste boundary, pore formation and damage to binder gel is limited. However, in case of BC 1% the cement paste around biochar walls are relatively undamaged (Fig. 5(c)), which may be due to release of internal pressure through the porous structure of biochar. This explains higher loss in strength in plain concrete and concrete with silica fume because of reduced binding capacity of hydrated compounds at 550˚C compared to the mixes with BC500.
Fig. 5 (a) Interfacial zone near the aggregates after exposure at 550˚C in (a) Plain concrete and (b) BC 1%
(c) Micro-structure of BC 1%
3.3 Effect on sorptivity at normal and elevated temperature
Addition of 2 wt.% biochar reduced initial and secondary sorptivity by 41% value of 0.014< 0.05) and 36% (p-value =0.011<0.05) compared to control respectively (Table 3). It suggests that the rate of water absorption is significantly reduced due to addition of 2 wt.% biochar. Permeability of cementitous composites are influenced by the interfacial transition zone around coarse aggregates and the capillary porosity of the matrix (Mindess et al. 2003). Densification of paste by reduction of free water and filler action at the ITZ by finer fraction of biochar particles play an important part in limiting the rate of absorption. Gupta and Kua(Gupta and Kua 2018) reported that the water absorbed by biochar at early stage is desorbed to the surrounding
(b)
(a)
paste during hardening, which leads to better hydration and reduce permeability of mortar paste. It is also reflected in difference in apparent porosities, which are 11.85 ± 0.12 %, 10.23 ± 0.09 % and 9.91 ± 0.13% for PC (control), BC 0.5% and BC 1% respectively. Although it is not a direct measure of total porosity, one can see that 2 % addition of BC 500 has lowered the water accessible void content in concrete.
One can observe that despite the porous nature of biochar, sorptivity is significantly reduced at 2% dosage
of biochar (Table 3). Espinoza and Lopez (Espinoza-Hijazin and Lopez 2011) and Thomas(Thomas 2006) also reported similar findings that internal curing and water absorption characteristic of porous lightweight aggregates (LWA) has strong positive effect on reducing the permeability of cement paste. Reduction in permeability and water absorption are more dependent on the reduced porosity of paste rather than the porousness of the aggregate(Espinoza-Hijazin and Lopez 2011).
Table 3. Initial and secondary sorptivity under normal condition and exposure to 550˚C
Normal condition Exposure to 550 ˚C
Initial sorptivity (x 10 -3mm/√secon d) Secondary sorptivity (x 10-3 mm/√secon d) Initial sorptivity (x 10 -3mm/√secon d) Secondary sorptivity (x 10-3 mm/√secon d) Increase in initial sorptivity after exposure (%) Increase in secondary sorptivity after exposure (%) PC (control) 2.60 0.87 19.66 1.87 655.30 114.94 BC 0.50% 2.14 0.80 15.13 2.13 607.17 167.92 BC 1% 2.28 0.71 14.74 1.62 546.35 126.90 BC 2% 1.47 0.55 9.57 1.52 552.50 171.11 SF 10% 1.73 0.36 11.92 2.94 590.21 729.11
After exposure to elevated temperature, all the mixes show drastic rise in water absorption. Plain concrete shows highest increase in initial sorptivity ( about 655%, Table 3) which indicates maximum loss in impermeability, attributed to internal cracking and coarsening of pore structure at high temperature (Chan et al. 1999). Silica fume concrete also show relatively large increase in initial sorptivity. Although CH is consumed by pozzolanic reaction, C-S-H gel also decomposes considerably at 550˚C. Degradation of C-S-H gel) open pathway for moisture transport through the thermally damaged matrix. However, it is to be noted that the initial sorptivity of thermally damaged SF 10% are 50% and 40% lower than plain concrete respectively.
Mixes with biochar also suffered loss in impermeability; however, the increase in initial sorptivity and water penetration after thermal treatment was significantly lower than control concrete (Table 3). BC 1% and BC 2% showed about 550% and 300% increase in initial sorptivity and total absorption respectively, which is also slightly lower compared to silica fume mix. Fig. 5 showed that the microstructure of the bulk paste and at the interface in BC 1% is relatively less damaged compared to PC (control) and silica fume. Similar findings is reported by Noumowe (Noumowe 2005) - concrete with porous LWA showed significantly lower permeability ( about 95%) compared to plain concrete after thermal treatment at 600˚C. At high temperature (500-600˚C), concrete matrix suffers from paste shrinkage and swelling of aggregates due to build-up of heat and vapour pressure, leading to micro-cracking within the paste. Biochar particles, due to their low stiffness(Das et al. 2015) and porous nature, does not suffer from volume expansion or exert pressure on the cementitous paste at the interface. Heating of biochar particles create more pores due to decomposition of
cellulose and lignin, which consequently reduce the build-up of vapour pressure within the concrete. It is noteworthy that mixes with biochar showed higher increase in secondary sorptivity compared to plain concrete. Secondary absorption is contributed to slower uptake of water by air voids or larger pores in the matrix (Yang et al. 2006). At 550˚C, it is expected that the pores of biochar have are in unsaturated condition due to complete release of absorbed moisture. Therefore, the empty macro-pores create more sites for water absorption after thermal treatment. High temperature also leads to pore enlargement or creation of more pores in biochar particles (Brown et al. 2006; Ghani et al. 2013), that probably contributed to increase in secondary absorption. However, further studies are necessary to confirm this hypothesis.
4 SUMMARY
In this study, we demonstrated the role of biochar, prepared from wood waste, in improving mechanical properties and water tightness of concrete under normal condition and elevated temperature. Based on the experimental findings, concrete with 0.50% -1% biochar show about 18%-20% improvement in 7-day and 28-day strength compared to control under normal condition. Addition of 0.50% biochar is found to offer similar early strength as that of concrete with 10% silica fume as cement replacement. Exposure to 300 ˚C and 550 ˚C results in lower strength loss and higher residual compressive strength in concrete biochar compared to control and mix with silica fume. Lower degree of damage to microstructure including interfacial transition zone and concrete surface is observed in concrete with 1-2 wt.% biochar. Total water absorption and sorptivity at 28-day age of concrete is reduced by 30- 40% due to addition of 1-2 % biochar, which indicates higher water
tightness of biochar-concrete composite. Concrete with 2% biochar offers improved impermeability after exposure to 550˚C. Total water absorption and initial sorptivity after thermal treatment are 45% and 36% lower than control mix. In conclusion, the study suggests that biochar can be used as a sustainable admixture to improve durability of structural concrete, while promoting waste recycling and valorization.
5 REFERENCES
Ahmed, A., Al-Shaikh, A., and Arafat, T. (1992). "Residual compressive and bond strengths of limestone aggregate concrete subjected to elevated temperatures." Magazine of concrete research, 44(159), 117-125.
Ali, F., Nadjai, A., Silcock, G., and Abu-Tair, A. (2004). "Outcomes of a major research on fire resistance of concrete columns." Fire safety journal, 39(6), 433-445. Awal, A. A., and Shehu, I. (2015). "Performance evaluation of concrete containing high volume palm oil fuel ash exposed to elevated temperature." Construction and Building Materials, 76, 214-220. Aydın, S., and Baradan, B. (2007). "Effect of pumice and fly ash incorporation on high temperature resistance of cement based mortars." Cem. Concr. Res., 37(6), 988-995.
Borges, P. H., Costa, J. O., Milestone, N. B., Lynsdale, C. J., and Streatfield, R. E. (2010). "Carbonation of CH and C–S–H in composite cement pastes containing high amounts of BFS." Cem. Concr. Res., 40(2), 284-292. Brown, R. A., Kercher, A. K., Nguyen, T. H., Nagle, D. C., and Ball, W. P. (2006). "Production and characterization of synthetic wood chars for use as surrogates for natural sorbents." Org. Geochem., 37(3), 321-333.
Chan, Y., Peng, G., and Anson, M. (1999). "Residual strength and pore structure of high-strength concrete and normal strength concrete after exposure to high temperatures." Cem. Concr. Compos., 21(1), 23-27. Choi, W. C., Yun, H. D., and Lee, J. Y. (2012). "Mechanical Properties of Mortar Containing Bio-Char From Pyrolysis." Journal of the Korea institute for structural maintenance and inspection, 16(3), 67-74. Das, O., Sarmah, A. K., and Bhattacharyya, D. (2015). "Structure–mechanics property relationship of waste derived biochars." Sci. Total Environ., 538, 611-620. Espinoza-Hijazin, G., and Lopez, M. (2011). "Extending internal curing to concrete mixtures with W/C higher than 0.42." Construction and Building Materials, 25(3), 1236-1242.
Ghani, W. A. W. A. K., Mohd, A., da Silva, G., Bachmann, R. T., Taufiq-Yap, Y. H., Rashid, U., and Ala’a, H. (2013). "Biochar production from waste rubber-wood-sawdust and its potential use in C sequestration: Chemical and physical characterization." Industrial Crops and Products, 44, 18-24.
Gupta, S., and Kua, H. W. (2018). "Application of biochar from food and wood waste as green admixture for cement mortar." Sci. Total Environ., 619-620C, 419-435.
Gupta, S., and Kua, H. W. (2018). "Effect of water entrainment by pre-soaked biochar particles on strength and permeability of cement mortar." Construction and Building Materials, 159, 107-125.
Hertz, K. D. (1992). "Danish investigations on silica fume concretes at elevated temperatures." Materials Journal, 89(4), 345-347.
Janotka, I., and Nürnbergerová, T. (2005). "Effect of temperature on structural quality of the cement paste and high-strength concrete with silica fume." Nucl. Eng. Des., 235(17), 2019-2032.
Khoury, G. (1992). "Compressive strength of concrete at high temperatures: a reassessment." Magazine of concrete Research, 44(161), 291-309.
Khoury, G., Majorana, C., Pesavento, F., and Schrefler, B. (2002). "Modelling of heated concrete." Magazine of concrete research, 54(2), 77-101.
Lin, W.-M., Lin, T., and Powers-Couche, L. (1996). "Microstructures of fire-damaged concrete." Materials Journal, 93(3), 199-205.
Mindess, S., Young, J. F., and Darwin, D. (2003). Concrete, Prentice Hall, Upper Saddle River, NJ,U.S.A. NEA (2015). "Environmental Protection Division Annual Report, 2015/2016." Singapore National Environment Agency, 2015, Singapore.
Noumowe, A. (2005). "Mechanical properties and microstructure of high strength concrete containing polypropylene fibres exposed to temperatures up to 200 C." Cem. Concr. Res., 35(11), 2192-2198.
Noumowe, A., Clastres, P., Debicki, G., and Costaz, J.-L. (1996). "Transient heating effect on high strength concrete." Nucl. Eng. Des., 166(1), 99-108.
Roberts, K. G., Gloy, B. A., Joseph, S., Scott, N. R., and Lehmann, J. (2009). "Life cycle assessment of biochar systems: Estimating the energetic, economic, and climate change potential." Environmental science & technology, 44(2), 827-833.
Rostami, V., Shao, Y., Boyd, A. J., and He, Z. (2012). "Microstructure of cement paste subject to early carbonation curing." Cem. Concr. Res., 42(1), 186-193. Saad, M., Abo-El-Enein, S., Hanna, G., and Kotkata, M. (1996). "Effect of temperature on physical and mechanical properties of concrete containing silica fume." Cem. Concr. Res., 26(5), 669-675.
Sakr, K., and El-Hakim, E. (2005). "Effect of high temperature or fire on heavy weight concrete properties." Cem. Concr. Res., 35(3), 590-596. Serrano, R., Cobo, A., Prieto, M. I., and de las Nieves González, M. (2016). "Analysis of fire resistance of concrete with polypropylene or steel fibers." Construction and building materials, 122, 302-309. Thomas, M. (2006). "Chloride diffusion in high-performance lightweight aggregate concrete." Special Publication, 234, 797-812.
Uysal, M. (2012). "Self-compacting concrete incorporating filler additives: Performance at high temperatures." Construction and Building Materials, 26(1), 701-706.
Woolf, D., Amonette, J. E., Street-Perrott, F. A., Lehmann, J., and Joseph, S. (2010). "Sustainable biochar to mitigate global climate change." Nature communications, 1, 56.
Xiao, J., and König, G. (2004). "Study on concrete at high temperature in China—an overview." Fire safety journal, 39(1), 89-103.
Yang, Z., Weiss, W. J., and Olek, J. (2006). "Water transport in concrete damaged by tensile loading and freeze–thaw cycling." J. Mater. Civ. Eng., 18(3), 424-434.