by
William Aaron Gilchrist B.S.A.D., M.I.T. 1977 SUBMITTED TO THE ALFRED P. SLOAN
SCHOOL OF MANAGEMENT
IN PARTIAL FULFILLMENT OF THE REQUIREMENTS OF THE DEGREES OF
MASTER OF SCIENCE IN MANAGEMENT and
MASTER OF ARCHITECTURE at the
MASSACHUSETTS INSTITUTE CF TECHNOLOGY June 1982
@ William Aaron Gilchrist
The author hereby grants to MIT permission to reproduce and to distribute publicly copies of this thesis document in whole or in part.
Signature of Author
Signature redacted
V Certified b Accepted by
Archives
Accr, OF TECHNOLOGYAfyfd P. Sloan School of Management
May 14, 1982
Signature redacted
Carliss Y. Baldwin
Signature redacted
Thesis SupersorJeffrey A. Barks Director of Masters Programs
\V Shun
Kanda
LIBRARIES
Signature redacted
JUN 7 1982
Chairperson, Departmental Committee on Graduate StudentsTHE ECONOMIC EVALUATION OF ARCHITECTURAL TECHNIQUES IN COST MINIMIZATION FOR RURAL HEALTH CARE FACILITIES IN KENYA
by
William Aaron Gilchrist
Submitted to the Alfred P. Sloan School of Management on May 14, 1982 in partial fulfillment of the requirements for
the Degrees of Master of Science in Management and Master of Architecture
ABSTRACT
One basic need which has received universal attention throughout the devel-oping world is the improved level of health. Less Developed Countries confront a serious challenge in ameliorating adverse health conditions. A wide range of complimentary health programs are currently being used in many Less Developed Countries to close the lacuna between current health
conditions and societal health objectives. Budgetary constraints are still binding, and the policy planner is challenged with devising innovative
means towards attaining health goals. Bi-lateral and multi-lateral agen-cies alleviate some of the resource constraints. However, due to the usual stipulation that these funds be employed for defraying development (capital) and not for recurrent (operational) expenditures, it is often difficult to plan projects which recognize both capital and recurrent constraints. Initiating clinic-based health care constitutes a substantial commitment of capital resources. In some instances, the required level of financing
has been prohibitive. Such a case is the Capital Facilities Expansion
Program for rural health services in Kenya, whose project expenditures exceeded the level which a consortium of multi-lateral and bi-lateral agen-cies agreed to finance. The excessive capital costs were linked to the
high building standard used by the Ministry of Works in facility
construc-tion. In an attempt to remove this capital cost impediment, planners have entertained the use of indigenous building technologies which require a lower commitment of capital funds.
It is the contention of this study that capital costs alone are an insuf-ficient economic criterion upon which to select a means of a facility construction. Recurrent costs must also be included in an efficiency evaluation. Moreover, any evaluation should account for the opportunity
cost of funds in the public sector. This thesis projects an alternative
facility type which incorporates indigenous technology while accommodating
the functional requirements of a health facility. Through an efficiency evaluation which employs the social discount rate, the more cost effective option between the current facility used by the Kenyan Government and the Alternative developed in this thesis is determined over a range of
sensi-tivity analysis.
Thesis supervisor: Carliss Baldwin
My deepest and most sincere appreci.-tion goes to Dr. Calvin Sinette whose enthusiasm and encouragement was tae strongest influence in Geeing
the study through from a notion to a reality. This experience in the area of rural health delivery in Africa was my greatest resource in de-fining the scope of this project.
The Population Health and Nutrition divison of the World Bank was also also instrumental in directing my attention to the Capital Facilities
Expansion Program in Kenya and in suggesting the best means of securing information on rural health care facilities. Special thanks goes to Hugh Frankson and Hugo Diaz for their enthusiasm and pragmatic counsel.
My reception in Kenya was made all the more beautiful by the Francis family whose hospitality provided the comfortable surroundings needed to conduct research: "Asante sana, Mamana Nduga!"
Deepest thanks for a memorable summer.
The level of cooperation extended by the Planning and Implementa-tion Unit of the Ministry of Health exceeded all expectaImplementa-tions, and it is hoped that through their continued efforts that this thesis will prove useful in arriving at an optimal use of Kenya's resources in pro-viding necessary health care to the underserved rural population.
Thank you, Carliss Baldwin, and Donald Lessard for invaluable
help in structuring the economic discussion. Your patience and guicancl are much appreciated. A very special thanks to Tunney Lee, Max Bond, and Eric Dluhosch, whose combined experience in the architectural prac-tice of Less Developed Countries laid the context for developing a method testing building systems against minimal performance criteria.
My heartfelt gratitude to some special friends who lent their ex-traordinary talents to the production:
Yanna Colombotos Karen Duncan Joachim Glassel
Hans Joachim Schlereth, A.B.B. Marsha Orent
Yoshiko Ryu
Thanks to all who helped me through this time and a special thanks to Stan, Ioana, Charles and Lenny, my bridges over troubled water.
This thesis is dedicated to my strongest and most constant source of inspiration: my family.
TABLE OF CONTENTS Chapter 1. 1.1 Chapter 2 2.1 2.2 2.3 2.4 Chapter 3 3.1 3.2 3.3 3.4 3.5 3.6 Chapter 4 4.1 4.2 4.3 4.4 Chapter 5 5.1 5.2 5.3 INTRODUCTION. . .. . . .. . Statement of Problem. . . . . .
METHOD OF ECONOMIC ANALYSIS . .
Introduction. . . .. . . . . . Life Cycle Costing. . . . . . .
Use of the Social Discount Rate Conclusion . . . . . . . . . .
KENYA . . . . . . . . . . . . .
Introduction. . . . . . . . . .
Climate and Topology. . . . . .
Government. . . . . . . . . . .
Population Distribution . . . .
Ethnicity . . . . . . . . . . .
Kenyan Economy. . . . . . . . .
HEALTH FACILITY INFRASTRUCTURE. Introduction. . . . . . . . . .
The Ministry of Health... Ministry of Works . . . . . . .
Capital Expansion Program . . .
TYPE DESIGN . . . . . . . . . .
Introduction. . . . . . . . . .
The Type Design - History and I The Type Design - Critique. . .
. .* ...
6
.. . . . . . . . . . .. . . . a . . . . . . .. . . . . .. . . . .. . . . . . . . .. . . . . . . . . .. . .. . . . . . . . . . . . .n. .5.4 Project Cases: Nyahera, Got Agulu, Ogembo, and 5.5 Summary . . . . . . . . . . . . . . . . . . . . Rusinga . . . . . 7 .14 .15 .18 .22 .29 .31 .32 .32 .35 .36 .36 .39 .44 .47 .47 .57 .61 .66 .67 .67 .30 .93 101
Chapter 6 USE OF APPROPRIATE TECHNOLOGY. . . . . . .
6.1 Introduction . . . . . . . . . . . . . . .
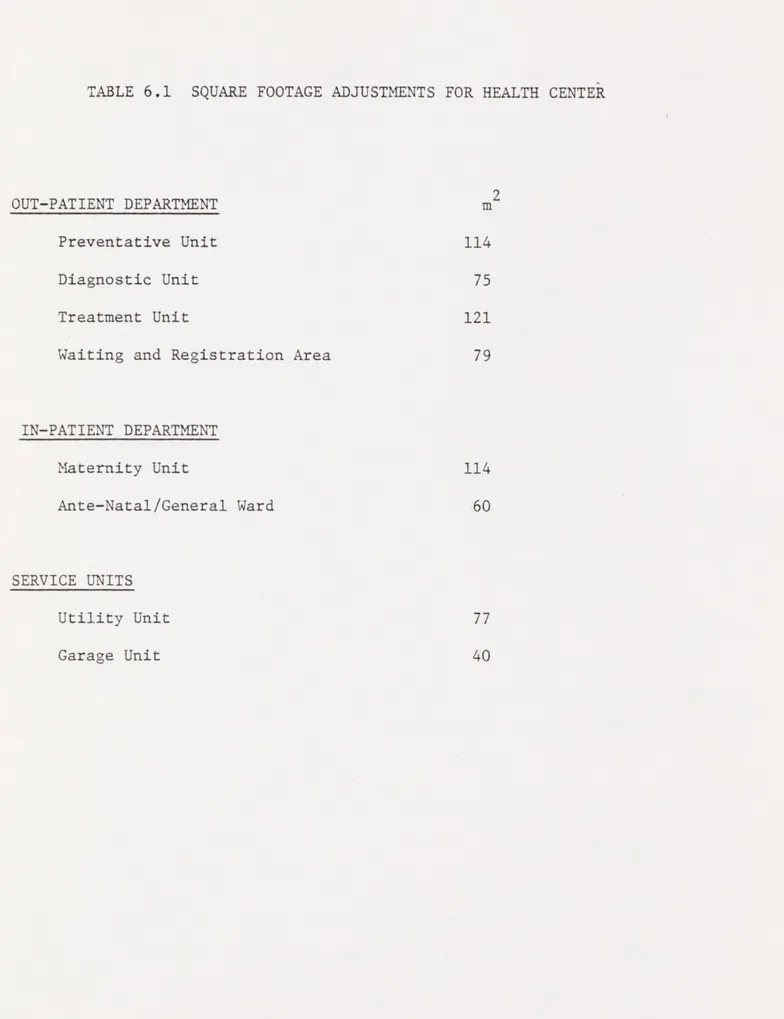
6.2 Phase A - Facility Program Square Footage. 6.3 Phase B - Standards of Construction. . . .
Chapter 7 EFFICIENCY EVALUATION. . . . . . . . . . .
7.1 Introduction . . . . . . . . . . . . . . .
7.2 Annuity Rental Charge on Capital . . . . .
7.3 Steady-State Maintenance Cost. . . . . . .
7.4 Other Considerations for Sensitivity . . .
7.5 Sensitivity Analysis . . . . . . . . . . .
7.6 Summary . . . . . . . . . . . a.. .. .. .
Chapter 8 CONCLUSIONS AND RECOMMENDATION . . . . . .
8.1 Introduction . . . . . . . . . . . . . . .
8.2 Evaluating Public Sector Expensitures by A Budgeting Envelopes . . . . . . . . . .. 8.3 Social Cost Differential in Capital and Re
Expenditures . . . . . . . . . . . . . . .
8.4 Strategic Suggestions. . . . . . . . . . .
8.5 Recommendations for Further Study... 8.6 Summary. . . . . . . ... Appendices Appendix 1 . . . . . . . . . . . . . . . . . . Appendix 2 . . . . . . . . . . . . . . . . . . Appendix 3 . . . . . . . . . . . . . . . . BIBLIOGRAPHY . . . . . . . . .. 103 .. 104 .. 106 .. 106 .. 122 .. 123 .. 123 .. 125 . ...127 .. 128 .. 147 . ...148 . ...149 ffinity -current . . .149 .. 150 .. 151 .. 152 .. 153
.
...155 . ...156 .. 157 .. 159Chapter
1
"The maximum return in human welfare must be obtained from the limited money and skill available:
"a) In estimating this return means must not be confused with ends.
"b) Medical care must be adapted to the needs of an intermediate technology."
- Third Maxim: King Medical Care in Developing Countries
1.1 Statement of Problem
Medical conditions in Less Developed Countries continue to be the focus of much attention from world governments, bi-lateral and multi-lateral organizations. Over the broad range of the Less Deve-loped Countries, there are myriad differences in climate, topologic and human settlement patterns which, in concurrance with regional pathologies create a varied and diverse health profile across
countries. Nonetheless, compelling reasons exist for grouping the Less Developed Countries within an affinity when discussing the problems of general health and the provision of medical services.
This affinity is broadly defined by the great disparity between the general health of the population in the Less Developed Countries and the more affluent nations. Several quantifiable indicators
reveal this discrepancy. One indicator is life expectancy. Appendix 1 shows the progression in average life expectancy for selected
countries from 1850 to 1977. While the general trend has been towards longer average life expectancy, substantial differentials are still in evidence.
Infant and child mortality rates account for the short average life expectancy among the developing countries.1 Half of all children
die within the first year in the most economically depressed regions of the world. For the entire continent of Africa, the average infant mortality rate is one-hundred deaths for every 1000 births. This contrasts sharply with a mortality rate of fifteen per 1000 births in the developed countries. For those children who do survive their first year, the outlook is still dismal. Citing Africa again as an example, most of the recorded deaths occur among children under five years of age.2 Even in Latin America where the average life expec-tancy is sixty-one years, the childhood mortality rate is quite high, particularly in the rural regions. Those who survive beyond the first five years of life throughout the developing world can, on average, expect to live up to fifty-three years, or seventeen years less than
the average life expectancy in the developed world.
Unfortunately, even this measure understates the health problems confronted by less developed countries. Other indicators such as malnutrition, the incidence of vector borne disease, environmental and sanitation pathologies, and health problems due to lack of family planning all attest to the fact the health outlook in the Less Deve-loped World remains an important challenge for the development of these regions and for the general improvement in the populations quality of life.
In meeting this challenge, developing countries must also confront severe constraints in economic and professional resources. The
adverse effect of these constraints is exacerbated by the fact that the majority of the population in Less Developed Countries are located in
the rural sector. Health services, however, have coalesced in the urban centers where the medical profession continues to work through
an infrastructure left by colonial powers, based on a European paradigm and targeted to an expatriate population. In Kenya, the national ratio of doctors to population is 1:10,000 whereas it is 1:50,000 in the rural regions. Either figure contrasts sharply with that for the United States; 1:700.
Post independence governments of Less Developed Countries have taken numerous steps towards tailoring health programs to suit their needs. The approach has varied across time, reflecting attitudes which saw health care expenditures either an increment towards
produc-tive investment or as a basic service promoting social welfare. The majority of government interventions were based on humanitarian goals.
Some countries, such as Kenya, the focus of this study, have imple-mented health programs on the basis of economic productivity during a number of stages in its development of health policy. In his work, Health Economics, Stan Sorkin notes:
"An important exception to this [humanitarian] policy has been Kenya, where the government has tended to concentrate anti-malarial and other public health measures in areas having high growth possibi-lities."3
As Chapter 4 of this study indicates Kenya has since redirected its health policy to encompass broader goals of social welfare and to address the needs of its burgeoning rural population. In redirect-ing this health perogative, the Kenyan Government has formulated a clinic-based health program which utilizes professionals, para-professionals, and a greater preventative health care component than during previous efforts. (Chapter 4). Economic constraints are still binding, and Kenya has had to go outside its domestic economy to
secure funds for implementing many of these programs.
The particular program of concern in this study is the facility construction which will house clinic based services. Kenya has
approached a group of multi-lateral and bi-lateral agencies to secure funds for facility development. As with most foreign aid agreements, these funds have been earmarked for development (capital) expenditures and excluded from defraying recurrent (operational) expenditures. In this particular case, the capital funds were originally scheduled to be deployed for a standardized facility prototype used throughout the country with slight modification depending on circumstances encountered in situ. An entire Health Center compound built to the specifications of this prototype is around KS7,120,000 ($800,000). A survey con-ducted by the World Bank and other lending agencies disclosed that when all the projects to be implemented through the Capital Facilities
Expansion Program were valued in aggregation, total capital expenditure were $255,000,000. This figure exceeded the commitment which donors were willing to make and the Government was requested to look at a means of reducing the cost of these facilities.
Towards achieving this reduction in capital costs, the Planning and Implementation Unit of the Ministry of Health has investigated the use of locally indigenous building methods in the construction of health care facilities. These investigations are germinal, yet they
promise a viable means of reducing capital costs. Experimental units such as the Appropriate Technology Village for Basic Services in Karen, Kenya demonstrate how local building methods may be adapted to increase their longevity and their fitness for use in particular building types.
implementing the Capital Facilities Expansion Program with locally indigenous technologies, this focus is too narrow a basis upon which to select one project or means of implementing that project from among several options: with each application of capital resources, a stream of operating resources is associated. For Less Developed Countries this linkage is particularly important since capital funds and recurrent funds are usually secured from different sources. As previously stated the capital expenditures for many Less Developed Countires is secured through foreign aid. Recurrent expenses, on the other hand, are defrayed through domestic sources. This differen-tiation in sourcing project funds demands even greater attention to the impact of capital funds commitments on the recurrent budget.
This study will perform an efficiency evaluation which captures the total differential in costs between implementing facility types in the Capital Facilities Expansion Program. In order to assess the economic consequence of selecting one means of building over another, a building which integrates multiple standards in construction shall be projected. Life cycle costing will then be performed to compare the cyclical costs of building and operating the Kenyan facility pro-totype with those of an Alternative which uses indigenous building methods. The facility to be examined will be a Health Center. While this facility constitutes only an eighth of total project costs, KS1,336,000 ( $150,000 ), it still provides a functional basis for inferring information for the policy planner who must make the final choice between alternatives.
The next chapter outlines the method of economic analysis which will form the basis of the efficiency evaluation performed in this
study. After this discussion, the specific context of the Capital Facilities Expansion Program is presented.
Chapter 1 Footnotes
lWorld Bank [1980] Health Sector Policy Paper. pp.10-14 .
21bid.
3
Chapter
$
2
t
METHOD OF ECONOMIC
ANALYSIS
2.1 Introduction
This chapter presents the analytical framework for evaluating capi-tal and recurrent expenditures of alternative building technologies in the Capital Facilities Expansion Program which will extend health ser-vices in Kenya's rural sector. The analysis will be structured by:
1) the specific projects being evaluated; i.e. buildings with life cycles and maintenance schedules; and
2) the context in which this project is implemented; through the public health sector of a Less Developed Country.
As Fig. 2.1 indicates, this level of investigation is very speci-fic. Nonetheless, it must be viewed within the broader considerations of public sector financing. From an economic perspective, this problem falls within the rubric of capital budgeting for the public health sec-tor. An efficiency evaluation will be used to select the least expen-sive means of implementing the Capital Facilities Expansion Program from two mutually exclusive alternatives:
1) the current means of constructing health facilities, using a standardized prototype; or
2) the proposed use of locally indigenous technologies in con-structing health facilities subject to functional constraints of minimum performance criteria.
The selection between alternatives should be based on a range of considerations. Under circumstances of limited financial resources, an efficiency evaluation of either alternative provides important informa-tion in this selecinforma-tion process. Since the implementation of either al-ternative will provide the same benefit, i.e. an infrastructure for iden-tical clinic-based health care in the rural sector, this evaluation
I
Government of Kenya1
- - - - -- -I- - - -~r
I
Ministry of Labor Curative Health Ministry of Works11
I
IMinistry
I
of Health Health Training StaffIJ
Capital Facilities Expansion
I
I
Steady Flows Capital StockEquipment
Rural Health Services
concerns itself exclusively with reducing the level of total expendi-tures required to provide this infrastructure. This type of evaluation is referred to as cost/minimization.
Since this efficiency evaluation is performed in the public sector, it falls within the broader scope of social cost/benefit analysis which assesses externalities and resource costs in public sector investment. As a social welfare project administered through the health sector, the
Capital Facilities Expansion Program sets its goal as the improved de-livery of health services (Chapter 4). In achieving the goal, budget-ary and economic constraints are binding, and the opportunity costs of displacing funds from use in other health sector programs for staff, equipment, mobile services, etc., figure prominently in an efficiency evaluation.
The following sections show how each of these considerations will be addressed in the economic analysis. Section 2.2 explains the use of Life Cycle Costing in evaluating expenditures for implementing either building technology. It also provides a brief explanation for structur-ing capital costs as an annuity rental charge on capital.
Finally, Section 2.3 tailors the evaluation to account for resource scarcity and opportunity costs in public sector projects by advancing
the use of a risk-adjusted social discount rate for capturing the time preference for funds which are sourced through the public sector.
It is hoped that through this discussion all of the relevant as-pects of an efficiency evaluation between facility alternatives will be presented for the policy planner.
2.2 Life Cycle Costing
Since this study entails the economic and technical comparison of mutually exclusive alternatives for facility construction, any efficien-cy evaluation must recognize buildings as assets with useful lives and incorporate this information into the assessment of each alternative. Life cycle costing supplies a method of establishing the relative time horizon for each alternative and of evaluating all relevant costs within these horizons. This approach typically separates asset costs into three phases over the life cycle:
1) engineering/design costs;
2) production/implementation costs; 3) operation/maintenance costs.
Figure 2.2 relates the occurrence of these phases (the amplitude and period of these costs are merely illustrative and do not represent a fixed relationship). In many asset valuations engineering/design costs and production/implementation costs are capitalized, while opera-tion/maintenance costs are expensed annually over the assets' life. This is done in order to compute an asset's periodic costs.
--- Engineering/Design Cost . ."."". . Production/Implementation Cost Operating/Maintenance Cost
:~
J * \ 'SFigure 2.2
-
--
---.~
*\Once an asset's useful life has been established, relevant cash flows are usually discounted to a present value. As with any discount-ing procedure, life cycle costdiscount-ing permits the comparison of assets whose relevant costs occur over different times, a particularly useful feature in applying this approach to the capital budgeting process.
In a discounted evaluation, capital and recurrent expenditures are recognized at the time when they occur. For efficiency evaluations of productive investments, this method of cash flows analysis is quite appropriate. In this study there are compelling reasons for scheduling capital outlays as an annuity rental charge on capital, where the annui-ty extends over the operational life of the health care faciliannui-ty.
Where capital funds from foreign aid for development are earmarked for use on specific projects, they usually are priced at a shadow cost which is lower than the cost of domestically sourced funds. This inex-pensive supply of capital funds has led policy planners in Less Developed Countries to make commitments to finance capital intensive projects (Hel-ler [1979]). If funds were fungible between capital and recurrent expen-ditures, then the opportunity costs of either use of these funds would be equal and planners could propose feasible strategies for committing a larger portion of project budgets to recurrent expenditures. This built-in bias towards capital intensive development strategies also ap-pears in the Capital Facilities Expansion Program. Table 2.1 presents
a breakdown of capital finance by donor. By contrast, the recurrent bud-get for maintenance is financed entirely through domestic sources.
The application of this foreign aid to capital expenditures, how-ever, does not come without costs. One such cost is the liquidity pre-mium subsumed' in committing one's capital to an asset with a protracted
TABLE 2.1: FOREIGN AID FOR CAPITAL FACILITIES CONSTRUCTION GOK SIDA NETHERLANDS IDA EEC DANDA FINLAND 150,000 600,000 200,000 10 100,000 450,000 10 1,500,020 337,078 1,348,314 449,438 22 224,719 1,011,236 22 3,370,831 10 40 13 6.7 x 10⁻⁶ 7 30 6.7 x 10⁻⁶ 100
life cycle, foregoing the opportunity to improve or replace it with a more appropriate technology. Another cost, particularly relevant in
this study is the recurrent cost associated with implementing a capital project. From a budgetary perspective, this recurrent cost must be an integral part of any economic comparison between options. In order to provide a complete picture of the annual resource commitment to a facil-ity type, the sum of the annufacil-ity rental charge on capital and steady-state maintenance costs permit a quick and cogent comparison. From the perspective of the budgetary planner, the objective function for cost minimization becomes:
c. = ssmc. + arcc.
J :1 1
where c. = total annual cost of implementing the facility
J
of building method;
ssmc. = total expenditures used for maintenance of a 1
arcc, = the annuity rental charge on capital for all facility expenditures in period i .
The annuity rental charge on capital can be derived by the standard annuity formula: r (. arcc =. (K.) 1 nj j 1 -1 + r
where n. = the life cycle of technology
j
;J
K = the capital expenditure associated with technology
j
; andr = the appropriate discount rate which captures opportunity cost of funds used to defray three capital
expen-ditures.
This economic comparison between the two technical building alter-natives reduces to assessing the annual costs of committing capital to a specific technology over the facility's operational life and the costs of maintaining the facility during this period. Any decrease in initial capital expenditures for constructing these facilities will be evaluated in conjunction with the corresponding increase in maintenance costs. If a less capital intensive technology results in a shorter facility life cycle, then the annuity rental charge of capital will be based on the shorter life, thus increasing the annual rental charge and perhaps off-setting any gains which were originally perceived through capital savings
in implementing less expensive building technologies. Capital and main-tenance expenditures need not offset each other in every instance,
although in most cases, there is strong reason to assume that they will, given the pricing strategies of building components which tend to capi-talize reduced costs for maintenance and service.
Although an annualized stream of funds represents the most cogent expression of project cost differentials to the policy planner, this study will also compare the cummulative absorbion of funds between alter-natives, taking the appropriate societal opportunity costs into account for construction and maintenance. This information will be communicated through graphs which essentially depict the accumulation of "capital stock" from actual capital expenditures and the capitalization of main-tenance expenditures associated with either alternative. This informa-tion shows differentiated patterns of capital stock accumulainforma-tion between alternatives which an annual comparison of steady-state expenditures misses.
2.3 Use of the Social Discount Rate
The cost minimization performed in this study must recognize the opportunity costs associated with funds applied in the public health sector. Even within the financing decisions for clinic-based health
care, there are choices which must be made among possible uses of funds. Figure 2.3 illustrates the division between capital and recurring ex-penditures of a rural health facility. The decision to commit a per-centage of funds to equipment certainly reduces the capital available for medical buildings and staff housing. Similarly, within the recur-ring budget, a decision to staff health facilities with a certain number of doctors and nurses limits budget allocations for drugs and supplies. In the context of this study, it is also important to recognize the
1. Capital Cost 2. Annual Budget 3. Staff Budget Hospital lldingAll buildings 83% Staf f housing 30% Ward equipment E Stores & dispensary stc Theatre equipment 3% Vehicle 2% Salaries Interest Tw 52% on capital 20 Drugs 90% Capital % dipreciatio 2ck 4% Sundries 20% o doctors % 15nurses 32 cleaners 15% 4 clerks 10% 11 ward-maids 5% 5 medical assistants 20% (j~
tradeoffs between allocating funds between capital and recurrent expen-ditures for societal projects.
Placing this cost minimization within the framework of social cost/ benefit analysis allows the efficiency evaluation to capture the oppor-tunity cost to society of allocating funds among programs which yield societal benefits within the health sector, and between capital and re-current expenditures.
In the broader area of economic development, social coat/benefit analysis has been readily applied to the evaluation of industrial proj-ects (Harberger [1972]), agricultural projproj-ects (Roemer [1975]) and in evaluation of financial incentives to achieve socially desirable increa-ses in employment (Baldwin, Lessard, and Mason [1981]). In each of these cases, the consequence of public sector intervention has had some marketable value, or some value to which a monetary numeraire could be
assigned.
In the case of health programs, quantification of benefits is dif-ficult, and often circuitous steps must be taken to assign a monetary value to health services. Therefore, across the range of societal proj-ects, it is difficult to compare health programs with other programs which promise increased levels of productivity or economic efficiency.
The decision to implement health projects from among society's entire set of alternatives is usually based on concerns for social welfare. Affinities can be established which group programs providing similar benefits, e.g. infrastructure, employment, health and basic services, etc., and thereby supply a comparative base for capital budgeting.2
Within the health sector, therefore, social cost/benefit analysis is a powerful tool for informing decisions in allocating resources
Figure 2.4
among projects (see Fig. 2.4). When limited by a certain level of fi-nancial support, whether this level is explicit or not, intelligent cap-ital budgeting is fundamental. For a Ministry of Health, the selection of programs may be among an innoculation project, a water treatment fa-cility, or an educational program for environmental health. Some econ-omic measure of committing resources to any of these alternatives is necessary in making a final selection.
Social cost/benefit analysis has been used in two modes within health sectors of developing countries. The first is to document the
change in regional productivity after the implementation of palliative programs. Such an approach links the costs of health programs to im-proved levels of productivity. This linkage permits some degree of health benefit quantification, and is referred to as cost/effectiveness.
Employers can look at disability days avoided and the corresponding TYPE OF MEASUREMENT IDENTIFICATION MEASUREMENT
EFFICIENCY OF EXPENDITURE OF PROJECT OF PROJECT EVALUATION IN ALTERNATIVES CONSEQUENCES CONSEQUENCES
Social Cost/ Dollars Single or Dollars Benefit Analysis multiple effects
not necessarily common to both alternatives, and common effects may be achieved to different degrees by the various alternatives
Social Cost/ Dollars Single effect Natural Units, Effectiveness of interest, e.g. life years Analysis common to' both gained,
alternatives disability days but achieved avoided, to different permanent handi-degrees by caps averted, alternatives etc.
Social Cost/ Dollars Identical in all None Minimization relavent respects
increase in worker output. Even increases in marginal revenuse from tourism have been linked incrementally to expenditures in the health sector. In such an instance, when the results of health care programs have a monetary value, a straightforward social cost/benefit analysis
can be used.
A more specialized use of social cost/benefit analysis in the health sector is in the comparison of alternative projects which pro-vide the same level of health benefit in their implementation yet which
incur different costs. The braodest comparison of this type occurs be-tween curative and preventative programs which address the same health need. The real savings in implementing a preventative innoculation or water treatment program over continued restorative and curative programs
can be quantified. Within a narrower focus, two alternatives for imple-menting the same program can also be compared. This study concerns such
a comparison where each alternative for facility construction operates within identical contexts of a rural health program and provides the
in-frastructure for the same level of services, i.e. cost/minimization. Since this study uses life cycle costing to assess maintenance and capital costs technologies with different patterns of expenditures over time, an efficiency evaluation in current terms is dependent on a dis-count rate which reflects society's time preference for money and on the risk associated in realizing the particular benefit from this project. This efficiency evaluation discounts the costs of the two different project alternatives by a social discount rate, w , which captures the opportunity cost to society of applying public sector funds to social projects. In a straightforward social cost/benefit analysis, the dis-count rate would be applied to cash flows which represent a project's
social benefits and costs. If the project yields a net social benefit, then the societal perogative to proceed with the program is clear. Since th's study's assessment occurs in the health sector between two projects yielding equivalent benefits for social welfare, the social discount rate shall be applied only in the evaluation of expenditures.
The social discount rate is differentiated from private market dis-count rates for several reasons. It is maintained that raising funds in capital markets of partially closed economies creates externalties which escape private sector evaluation (Lessard, Baldwin, Mason [1981]). Opportunity costs for displacing projects and changing perception of risk on the part of foreign investors and creditors account for these externalities which are not capitalized in the market. The degree to which an economy is open or closed will determine the magnitude of the divergence between the private and social discount rates.
As in many developing countries, Kenya enacts measures to maintain an artifically high exchange rate and has taken a strong protectionist stand against certain foreign imports. Kenya's economy is also quite small compared to the world capital markets. Although Kenya enjoys a low level of sovereign risk for a developing country,5 the economy is undoubtedly securing funds at rising marginal costs. When these factors are considered in unison, Kenya meets sufficient economic criteria to assume a wide divergence in social and private discount rates. As
in-creasing foreign claims and project displacement continued, the differ-ential between these rates is widened.
The social discount rate, w , contains two components which cap-ture the opportunity costs of foreign and domestic finance for public sector projects. A complete analytic derivation of the social discount
rate is beyond the scope of this paper, however a brief exposition is offered in Appendix 3 . For a rigorous derivation, the reader is re-ferred to Harberger (1975).6
Arguments have been advanced that the social discount rate should be applied as a universally risk-free rate in the evaluation of public sector projects (Arrow and Lind [1966]). This assertion is based upon an assumption that once a project is managed through a public sector, government, as society's proxy, can spread project risk across the en-tire population and that this allocation occurs at no added costs. This is correct as long as the yield of a new public sector project is not significantly correlated with fluctuations in national income.
Although idealized private markets make adjustments in expected return on the basis of unsystematic project risk, most proponents for the use of a riskless social discount rate maintain that the risk adjust-ing structure of capital markets is not analogous to that of the public sector. One fundamental difference between the two sectors cited in sup-port of this stand is that the stream of societal benefits, taken in ag-gregate, are much less risky than the aggregate incomes of private mar-kets (Arrow [1966]).
Despite these arguments, compelling reasons exist for recognizing differentiated levels of risk among social projects and for incorporat-ing these risks in the social discount rate. Reasons for considering risk in efficiency evaluations have been advanced by Bailey and Jensen
[1975] and Baldwin, Lessard, and Mason [1981]. Some of their central propositions can be developed in the context of evaluating the Capital Facilities Expansion Program for rural health care in Kenya. Inasmuch as Kenya's economy is highly specialized for agricultural export, it
seems implausible to assume that projects to expand income in this sec-tor do not contribute to the variability of national income. Indeed, Kenya's national income has a high correlation to the prices of its principal agricultural export, coffee. Although Kenya also exports pet-roleum products, these two principal exports hardly provide a sufficient-ly diversified economic base to consider all social projects as equalsufficient-ly risky. Thus, public sector investments which provide infrastructure for petroleum products, or principal agricultural exports should be evaluated differently than those which develop a broader economic base through encouraging diversification. This does not suggest that Kenya should abandon its policy of allowing market development in line with its comparative advantage, but rather that Government should recognize the risk associated with social interventions which increase dependence on revenues from principal sectors of the economy. An intrisic capacity for risk diversification in the public sector cannot be advanced as a
reason for prescribing use of a riskless discount rate. It would seem, however, that the recurrent project costs of the Capital Facilities Ex-pansion Program can be spread across many different sources and would
fall within Arrow Zinds prescription.
2.4 Conclusion
The efficiency evaluation conducted in Chapter 7 will utilize the methods described in this chapter under different project conditions,
in order to gauge the behavior of the cost differential between alter-natives. The next few chapters lay the context in which the specific efficiency evaluation occurs.
Chapter 2 Footnotes
1This term can be used interchangebly with cost effectiveness where effectiveness looks at same level of benefit.
2re: Budgetary Envelopes; Baldwin, C.Y. Baldwin, D.E. Lessard, S. Mason, "Control at Indirect Financial Subsidies in Canada's Budget:
Diagnosis and Recommendations", Working Paper, Alfred P. Sloan School of Management.
3Sorkin, Alan, [1975] Health Economics, Lexington Books, Chapter 6. 4
World Bank [1980] Health Sector Policy Paper, Chapter 2. 5
Bonner, J.
a
/
U ~
I
~
Chapter
3.1 Introduction
This chapter shall present a succinct geographic, political and econo-mic portrait of Kenya. Inasmuch as this thesis calls for an efficiency eva-luation of a project financed through Kenya's public sector, a basic under-standing of the country's economic situation is essential. For the reader who is unaware of Kenya's socio-political environment, this discussion should provide sufficient background.
3.2 Climate and Topology
Kenya is located in East Africa (see Fig. 3.1) and is bounded to the North by Ethiopia and Sudan; to the West by Uganda and Lake Victoria; to
the South by Tanzania; and to the East by Somalia and the Indian Ocean. The country has a total area of 224,960 sq. miles including 5,127 sq. miles of Lake Victoria, and Lake Turkana. Situated in Central Africa, a little more
than a third of the country is located south of the equator. (see Fig. 3.2). The topology and climate in Kenya exhibit extreme variation for a
country of such small geographic area. Kenya's equatorial location and the tumultous geological formations of the Rift Valley account for much of the topological and climatic diversity which is found within its borders. Con-current with the Rift Valley which runs along a North-South Axis throughout Central East Africa, are Kenya's three major mountain ranges and numerous plateaus climbing above sea level. These mountain ranges are Mount Kenya, the Abadare Range and the Mau Escarpement.
Mount Kenya, the country's largest peak, is approximately 17,000 feet above sea level and is snow capped perennially even though it is 2' south of the equator. The average altitude for the mountain ranges along the Rift Valley is 7,000 ft. above sea level, and they provide central Kenya
Figure
3.1
Figure
3.2
Sudan
Ethiopia
L. TURKANA
Uganda
0d~~4
4
INI4,
,;equator
* Mt. KenyaL. V TORT
A
- : Nairobi
Tanzania
.'
INDIAN
Mombasa
OCEAN
KENYA
Topography
with a moderate climate during the entire year. The mean yearly temperature is 65*F for South Central Kenya.
West of the Mau Escarpement, the Highlands continue and merge into the broad plateaus which border Lake Victoria. Both these Western and Central Plateaus constitute some of the most fertile agricultural land on the
African Continent, because of the plentiful rainfall, and intense sunlight. By comparison the Northern third of the country is an arid expanse of desert which contrasts drastically with the fecund regions in the South. Large areas of Northern Kenya receive less than 10 inches of rainfall per year and are agriculturally unproductive. This arid region is the largest homogeneous topologic and climatic zone in Kenya, and the annual tempera-tures average 851F.
The Kenyan Coast along the Indian Ocean is warm during most of the year, with temperatures around 80*F due to the moderating influence of the
sea.
3.3 Government
A former British colony, Kenya achieved independence in 1963, retain-ing affiliation with Great Britain as a member of the Commonwealth of Nations. Kenyan governmental structure is modelled after the British Parliamentary system. The Kenyan Parliament is a unicameral national assembly of elected representatives over whom the President presides. The Ministers of
Parliament number 158 and from the ranks this President appoints the Vice-President and the heads of the twenty-nine Ministries and Departments which
formulate, execute, and supervise national policy. These policies cross the range of national concern, e.g., Foreign Affairs, Agriculture, Defense, Health, Tourism and Wildlife, etc.
seven provinces which draft and execute local programs in their respective territories. (see Fig. 3.3). A provincial commissioner appointed by the President, and provincial officers appointed by this commissioner plan and administer policy at this level. They usually supervise projects and programs which affect several districts yet which are of insufficient scope to require direct national supervision.
Provinces are further apportioned into districts which are governed by commissioners whom the President appoints to represent his office in
local matters. Towns and local governments elect county councils to set municipal policy and to resolve disputes within the jurisdiction of
municipal law.
3.4 Population Distribution
The population of Kenya was 16,000,000 in 1980 with a projected annual growth rate of 3.5 per cent. A little more than 10 per cent of the popula-tion livesin the urban sector. Nairobi is the largest population center with 50 per cent of total urban inhabitants. Mombasa, the largest harbor
in East Africa, follows at 24 per cent. Each of the remaining centers contain less than 4 per cent of the urban population. The primary location of the rural population is in the South Central and Lake Regions which corresponds to the major areas of agricultural production.
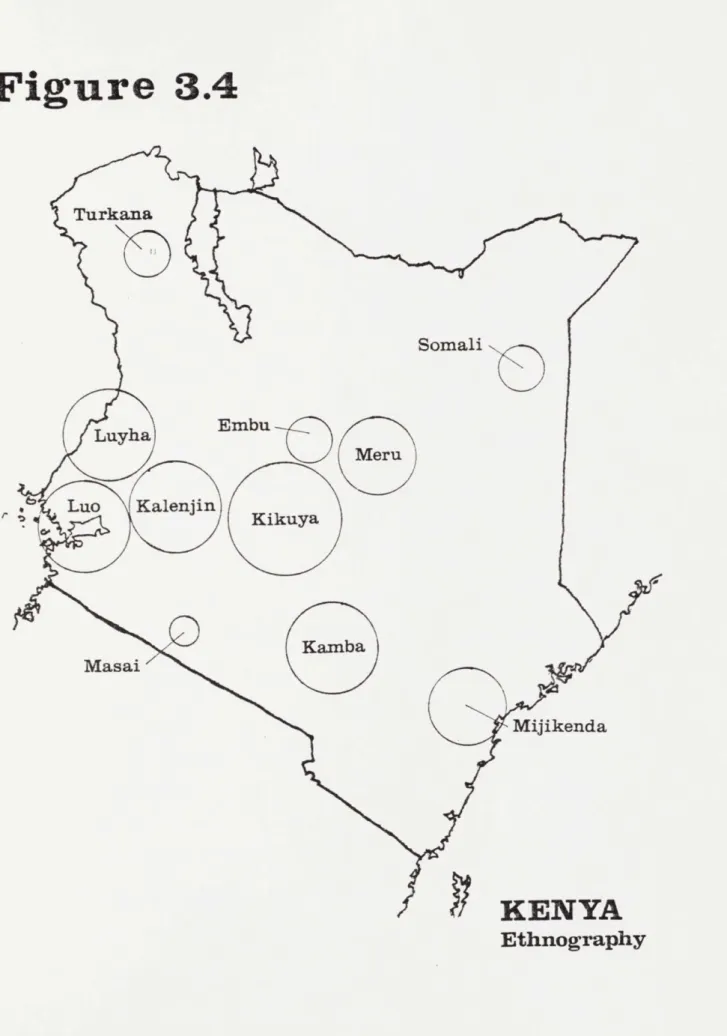
3.5 Ethnicity
The ethnic composition in Kenya is as diverse as the country's geo-graphy. More than thirteen tribes are indigenous to Kenya and fall within
three broad classifications: Bantu-speaking; Nilotic speaking farming tribes; and Nilo-Hamitic speaking pastoralists. Fig. 3.4 relates the location of the eleven largest tribes.
Figure 3.3
Eastern
North
Eastern
Western
Rift Valley
Central
ya
CoastKENYA
Provincial
Boundaries
Figure
3.4
Turkana
Somali
Luyha
Embu
Meru
Luo
Kalenjin
K
Masai
Mijikenda
KENYA
Ethnography
3.6 Kenyan Economy
The countries of Sub-Sharan Africa follow a broad range of economic paradigms. Most of these countries have highly specialized, export-based economies. The exported commodities vary greatly: some are agricultural providing the world market with such staples as coffee, cocoa, and tea; some countries are exporters of minerals used as inputs of manufacturing sectors of more developed economies; and some,primarily Nigeria and Gabon, are exporters of oil. Many African countries have encouraged socialist transformations, promoting the state as the producer and distributor of goods and services. Others have set about emulating the market economies of former colonial powers.
Kenya has taken the latter path and has developed as an agriculturally based, open market economy. The Government has combined a laissez-faire attitude towards capitalism with cautious intervention to provide basic services and the infrastructure necessary to encourage private investment, maintaining this posture since 1963. The first Five-Year-Development Plan published in 1966 outlined Kenya's long term goal of attaining "high and
growing rates of per capita incomes, equitably distributed, so that all are free from want, disease, and exploitation." Although the Government has engaged in fine tuning development efforts since independence, the basic laissez-faire relationship between Government and the private sector has remained unchanged over the last two decades.
According to the most visible measures of economic growth, Kenya's approach towards development appears to have largely succeeded. During the first decade since independence, the annual growth rate of Kenya's Gross Domestic Product was 6.0 per cent per annum ranking Kenya's growth rate among the ten highest in Sub-Saharan Africa. These levels of economic
growth exceeded Kenya's staggering birth rate of 3.5 per cent and led per capita G.D.P. to increase at an annual rate of 2.7 per cent. These laudible statistics attest to Kenya's achievement in one area of its economic program, a high rate of growth. Income distribution, however, has not advanced
pari passu with economic growth as measured by the G.D.P., and remains a challenge for future development.
The next two sections will present the Domestic and Foreign Sectors of the economy in more detail, providing the economic context in which the public sector expenditures for health must be evaluated.
3.6.a Domestic Sector
Agriculture is the largest producer of revenues in the private sector. In 1978 revenues from this sector were $1,125,000,000 contributing approxi-mately 35% of the Gross Domestic Product and, when services are excluded
from the formulation, agriculture provides 60% of the economy's revenues. In Kenya, agriculture operates entirely on market inputs. Fertilizer, seeds, chemicals, and farm equipment are purchased from private firms.
The importance of agricultural production in Kenya transcends its revenue generating capacity, since it is the largest payer of wages in the private sector. More than 20 per cent of domestic wages are paid through agricultural production. Agriculture is also the major source of income
for small business. The Government has taken special steps to encourage entrepreneurial involvement in agricultural procuction by opening up many Scheduled Settlement Areas for Agricultural use.
The Urban Formal Sector consists of the industrial production and manufacturing sectors in Kenya which contribute to the Gross Domestic
Product. Because of existing Pre-Independence infrastructure and subsequent development policy, the industrial sectors of the economy grew in or around
Kenya's urban centers. More than 50 per cent of total industrial production occurs in Nairobi itself. Although private industries dominate the Urban Formal Sector, Government intervention in this sector includes taxation, controls on imports and regulations on factor prices in production. The wage schedule in the Urban Formal Sector dominates compensation patterns in the economy. Labor legislation, unionization, and housing allowances have contributed to a higher wage rate and also to Kenya's high industrial capi-talization. In 1978, industrial production accounted for 16 percent of total output in the C.D.P. From 1974 to 1978, revenues from manufacturing increased by 12 percent per annum and paid out 13% of total wages in the Kenyan Economy in 1978.
The Urban Informal Sector constitutes those enterprises which provide goods and services, yet which have no license to operate and which have limited, differentiated markets. Examples range from the production of sandals to the construction of sub-standard squatter housing. The creation of the Urban Informal Sector is largely attributed to the rural-urban migra-tion and to the inability of the Urban Formal Sector to absorb the ingress of rural migrants into the labor force. Similar phenomena are found through-out the developing countries where urban migration has exhausted the Urban Formal Sector. However, the quantification of reveneus from this sector is difficult, making data such as net contribution to G.N.P. and sector growth rates impossible to derive.
Despite the growth and leadership of the Private Sector in the Kenyan economy, the Government has been a major contributor to the G.D.P. since
independence. Approximately 30 per cent of the G.D.P. has come out of the Public Sector over the last two decades where 18 per cent has been con-tributed by the National Government, and the remainder has been concon-tributed
by local governments and by Kenyan para-statal bodies. In 1978, the Government accounted for 25 per cent of capital formation in the Kenyan economy.
Although the Government has generated sizable revenues from its resourses, it employs only 6 per cent of the labor force. Nonetheless, Government pays out 43 per cent of the national wage. This wage schedule has exacerbated the inequity in income distribution, providing public servants with salaries and wages comparable to successful small scale entrepreneurs.
The Kenyan Government has influenced patterns of public saving, through-fiscal policies; and that of business and household savings through taxation. When the current Government assumed stewardship in 1963, it inherited a re-current budget deficit which it financed through foreign aid. Through its taxation on a burgeoning private sector, Government augmented its revenues from KL 50 million in 1963-64 to KL 144 million in 1972-73. Recurrent ex-penditures grew at a rate of 11 percent p.a., as the economy pursued its growth goal.
Because of the Government's achievement in increasing revenues, it was able to finance the recurrent budget and contribute 28 per cent to the overall development budget during the 1960's. The balance of development funds were sourced through domestic financial institutions or through con-cessional foreign loans. By 1970 the government was financing its total budget, recurrent and development, with 80 per cent recurrent revenues, 10 per cent net domestic borrowing and 10 per cent net foreign borrowing. The end of the 1970's saw a drop in recurrent revenues relative to recurrent costs, where 17 per cent of the development expenditures were financed
-through foreign aid. While the current 1979-1983 Development Plan has seen the level of foreign aid fall to 15 per cent, Kenya has had to rely
increasingly on Central Bank financing for its public sector expenditures. As the Central Bank became an integral part of public sector financing,
in-flation rose to 11.1 per cent p.a. during the 1970's, from a rate of 15 per cent p.a. during the previous decade. Exogenous shocks from oil price in-creases also fuel inflation, since Kenya imports all of her crude oil, but the Government is still seeking to reduce dependence on Central Bank loans for public sector expenditures over future periods.
3.6.b Foreign Sector
Within Kenya's foreign economy, agriculture is the largest export.
This sector accounts for 60 per cent of the total value of exports on average and has grown at a rate of 19 per cent per annum, from 1971-1978. Coffee, the principal export, accounts for 57 per cent of total agricultural exports and a third of the value of total exports.
The next largest export is tea, accounting for 17 per cent of total export revenues, followed by petroleum products from the refineries in Mombasa, which constitute 16 per cent of total export value. Petroleum
exports have risen in value over the last decade at an annual rate of 23 per cent. Europe is the principal market for Kenya's goods consuming 44 per cent of national exports. Other principal markets in descending order
of contributed revenues are Africa, North and South America, the Far East/ Australia, the Middle East, and Eastern Europe.
The value of exported commodities has fluctuated over the past decade. Since coffee dominates exports, there is a high correlation between export revenues and coffee prices. Despite a fairly inelastic demand for coffee, price changes have a volatile effect as witnessed by the drop in export value in 1978.
source of substantial losses of recent export volume. Politically destabi-lized Uganda, traditionally Kenya's largest African market for exports, has been an unreliable source of foreign revenues, as that country undergoes economic reconstruction, and the closing of the Tanzanian border in 1977 pared down exports to Kenya's second largest trading partner on the African continent.
Kenya's industrial sector relies heavily on imports. Machinery and transport equipment compose the greatest import expenditures at 40 per cent of total volume per annum. The largest single import is transporta-tion equipment, e.g. buses, trucks, etc. Kenya imports most of these commodities from Europe. The second largest import is petroleum at 15 per cent of total import value. Through this dependence, Kenya's balance
of trade has suffered, as world oil prices increase.
In 1978, aggregate exports and imports left Kenya with a negative trade balance of KL 265,413,000 = $605,422,471. The major source of this deficit occurred in European trade which showed a negative balance of KL 173,467,000 = $389,813,483. The constant erosion of Kenya's balance of trade position has led the Government to the most severe trade
restric-tions in the nation's history. For example, in 1981, a ban was placed on the importation of all consumer cars.
Other trade restrictions have been made through attempts at developing the manufacturing sector of the economy. Despite these attempts at
supporting local industry through protective tariffs, there has been minimal increaselcontribution to foreign exchange through these protected enter-prises, where industrial exports have increased at 8 per cent per annum,as
opposed to 19 per cent per annum for agriculture and 23 per cent per annum for fuels and lubricants.
The Kenya Shilling (KS) is the basic unit of currency and is equal to $0.11. There are twenty shilling to the Kenya Pound. In 1979 total
net Foreign Reserves of Kenya's central monitary authorities amounted to KL 225,545,000.
Chapter
4
I
MINISTRY OF WORKS MINISTRY OF HEALTHRural Health Ui
Capital Facilities Expansion Progr;ml
Type Design
HEALTH FACILITY
INFRASTRUCTURE
4.1 Introduction
Although this study examines the specific problem of reducing total project costs incurred in the construction of health care facilities, this problem must be placed in the broader context of improving the level of health in the rural sector. In order to clarify the motivations behind initiating the Capital Facilities Expansion Program, this chapter describes the development of Kenya's rural health policy and how the Ministry of Health and Ministry of Works interact in implementing capital facility projects for clinic-based rural health care. Finally a brief account of the Capital Facilities Expansion Program is presented, outlining the
proposed infrastructure which resulted from the collaboration between these two Ministries.
4.2 The Ministry of Health
The Ministry of Health is responsible for six major programs: 1. Curative Health
2. Preventative Health 3. Rural Health Services
4. Health Training
5. Medical Supplies Service 6. Medical Research
As Appendix4 indicates, the Ministry of Health operates with a relatively small budget allocation compared to other Ministries of Government. A total of KL 249,040,000 ($527,505,747) has been dispensed to the Ministry of Health over the Development Period 1978-1983. This amount constitutes over 7% of the total recurrent and development expenditures for the period. This figure is roughly congruent with that of other developing countries.
The Ministry of Health' Period 1978-1983 is:
Recurrent expenditure Development expenditure TOTAL EXPENDITURE
Estimated foreign aid Local finance
s budget for all services over the Development
IKf '000 1978/79 1979/80 1980/81 1981/82 1982/83 30,126 33,126 36,465 39,480 42,751 10,339 12,091 14,047 15,064 15,551 40,465 45,217 50,512 54,544 58,302 2,460 4,836 5,618 6,025 6,220 38,005 40,381 44,894 48,519 52,081
Of this national budget, the following is Rural Facilities Expansion Program:
Recurrent expenditure Development expenditure TOTAL EXPENDITURE
Estimated foreign aid Local finance 1978/79 2,903 1,435 4,338 465 3,873 1979/80 3,560 2,645 6,205 1,190 5,015
allocated for the Ministry's
1980/81 3,984 3,989 7,973 1,795 6,178
K
'000
1981/82 1982/83 4,322 4,688 4,407 4,707 8,729 9,395 1,983 2,118 6,746 7,277Through its responsibility for rural health services, the Ministry of Health is the principal actor in the programming of facilities and in projecting the needs for additional facilities in the rural sector. The Ministry's involvement in the delivery of health services in rural areas began in 1970, when it assumed responsibility for the administration of rural health services which had been the previous charge of local
authorities and Country Councils. This intervention was necessitated by the heightened expectations for health care by rural populations. As these expectations translated into greater expenditures, local governments found