HAL Id: hal-00318373
https://hal.archives-ouvertes.fr/hal-00318373
Submitted on 29 Aug 2007
HAL is a multi-disciplinary open access
archive for the deposit and dissemination of
sci-entific research documents, whether they are
pub-lished or not. The documents may come from
teaching and research institutions in France or
abroad, or from public or private research centers.
L’archive ouverte pluridisciplinaire HAL, est
destinée au dépôt et à la diffusion de documents
scientifiques de niveau recherche, publiés ou non,
émanant des établissements d’enseignement et de
recherche français ou étrangers, des laboratoires
publics ou privés.
Ion escape from the high latitude magnetopause:
analysis of oxygen and proton dynamics in the presence
of magnetic turbulence
A. Taktakishvili, G. Zimbardo, E. Amata, S. Savin, A. Greco, P. Veltri, R. E.
Lopez
To cite this version:
A. Taktakishvili, G. Zimbardo, E. Amata, S. Savin, A. Greco, et al.. Ion escape from the high
lati-tude magnetopause: analysis of oxygen and proton dynamics in the presence of magnetic turbulence.
Annales Geophysicae, European Geosciences Union, 2007, 25 (8), pp.1877-1885. �hal-00318373�
www.ann-geophys.net/25/1877/2007/ © European Geosciences Union 2007
Annales
Geophysicae
Ion escape from the high latitude magnetopause: analysis of oxygen
and proton dynamics in the presence of magnetic turbulence
A. Taktakishvili1,*, G. Zimbardo2, E. Amata3, S. Savin4, A. Greco2, P. Veltri2, and R. E. Lopez5 1Center for Plasma Astrophysics, Tbilisi, Georgia
2Universit´a della Calabria, Cosenza, Italy
3Istituto di Fisica dello Spazio Interplanetario, INAF, Roma, Italy 4Space Research Institute, Moscow, Russia
5Florida Institute of Technology, Melbourne, FL, USA *also at: Goddard Space Flight Center, Greenbelt, MD, USA
Received: 9 December 2006 – Revised: 30 May 2007 – Accepted: 13 July 2007 – Published: 29 August 2007
Abstract. Recent Cluster observations of the vicinity of the
high latitude magnetopause indicate the presence of beams of singly charged oxygen ions, which are of ionospheric ori-gin. In this paper we examine the role of magnetic turbu-lence combined with a dc electric field across the magne-topause in causing the cross field transport of protons and of singly charged oxygen ions, by means of a kinetic test parti-cle simulation. We find that the observed values of magne-tosheath turbulence and electric fields can produce a substan-tial escape of the oxygen ions relative to protons. By vary-ing the magnetic turbulence level in the simulation, we find that the number of O+crossing the magnetopause grows with
δB/B0, and that very few ions can cross the magnetopause
for δB/B0=0. The ion temperature also grows with δB/B0,
showing that magnetic turbulence is effective in thermaliz-ing the kinetic energy gain due to the cross-magnetopause potential drop. We suggest that this mechanism can help to explain Cluster observations of energetic oxygen ions during a high-latitude magnetopause crossing.
Keywords. Magnetospheric physics (Magnetopause, cusp,
and boundary layers) – Space plasma physics (Numerical simulation studies; Transport processes)
1 Introduction
It was suggested by Haerendel et al. (1978) that the magne-tospheric regions above the polar cusps would correspond to strong perturbations of the magnetic and velocity fields. In situ measurements by, among the others, the Prognoz 8, In-Correspondence to: G. Zimbardo
(zimbardo@fis.unical.it)
terball, Polar, and Cluster spacecraft have shown that this is indeed the case (Savin et al., 1998, 2002, 2005a; Nykyri et al., 2004, 2006; Sundkvist et al., 2005b). The strong turbu-lence observed could be due either to magnetic reconnection occurring at the high latitude magnetopause (Scudder et al., 2002), or to instabilities related to the shear flows in the mag-netosheath, or to kinetic instabilities at frequencies around the local proton gyrofrequency (Sahraoui, 2006; Nykyri et al., 2006; Zimbardo, 2006). Magnetic turbulence in the cusp region exhibits a power spectrum which often has a double slope, with spectral index around 1.2–1.7 below the proton gyrofrequency, and around 2.5–4 above the proton gyrofre-quency (Nykyri et al., 2006). Further, coherent structures like plasma bubbles and Alfvenic vortices are observed close to the cusp region (Sundkvist et al., 2005a; Savin et al., 2005a), with characteristic scales of the order of the proton gyrora-dius (drift-kinetic Alfven vortices) (Sundkvist et al., 2005a). Bicoherence analysis shows that nonlinear 3-wave interac-tions are going on in the magnetopause (Savin et al., 2005b). In addition, the polar cusps are often populated with high energy particles, with energies up to a few MeV (Chen et al., 1998); the origin of these particles is still a matter of debate: the possibility that they are accelerated locally indi-cates that the cusps are regions of intense energy conversion, and that they can be an ideal laboratory for nonlinear plasma processes (Blecki et al., 2005).
On the other hand, singly charged oxygen ions, of iono-spheric origin, are often observed in the magnetosphere (Shelley et al., 1972; Lockwood et al., 1985; Moore et al., 1986; Yau and Andre, 1997; Andre and Yau, 1997; Chappell et al., 2000; Peroomian et al., 2006). Recently, during sev-eral crossings of the high latitude magnetopause, Cluster ob-served O+beams with energies of 10–20 keV (Bogdanova et
1878 A. Taktakishvili et al.: Oxygen transport across magnetopause al., 2004; Nilsson et al., 2006). In particular, O+beams were
observed during the Cluster magnetopause crossing of 13 February 2001, at around 20:00 (Amata et al., 2006). For this event, close inspection of Cluster CODIF data (not shown herein) reveals that a population of singly charged oxygen ions with energies between 10–30 keV and temperatures cor-responding to about 10 keV were registered around the mag-netopause, with a corresponding cold (TO+∼600 eV) oxygen
flow (bulk velocity VO+≃140 km/s) at lower altitudes.
Of-ten, the temperature transverse to the magnetic field is larger than that parallel to the magnetic field. A quasi dc electric potential drop 1ϕ normal to the magnetopause, with 1ϕ of the order of 10 kV, and a substantial level of magnetic fluc-tuations with δB/B0∼0.4 with frequencies ν=0.01–1 Hz,
were observed throughout the magnetopause crossing, from 20:00 UT to 20:02 UT, see Fig. 1. Strong electric fluctua-tions were observed, too, but concentrated near the periods of strongest potential drop, 20:00 UT and 20:15 UT (with the magnetopause current layer observed at 20:00:58 UT).
The mechanisms by which the O+ions escape from the inner magnetosphere to higher altitudes and are energized are not well understood. The proposed energization mech-anisms range from magnetic reconnection either at low or at high latitudes, to resonant heating by electric field fluctua-tions (Andre and Yau, 1997; Bogdanova et al., 2004), to cen-trifugal acceleration of the outflowing ions (Nilsson et al., 2006). We point out that understanding the escape mecha-nism can be instrumental in recognizing the actual energiza-tion mechanism. For instance, if H+and O+ions cross the magnetopause locally, the energization mechanism could be local, too. On the other hand, ion energization can also occur at lower altitudes, thanks to a variety of mechanisms like ion resonance with perpendicular electric fields associated with broadband low-frequency waves, leading to ion conics, or field aligned ion acceleration due to the ponderomotive force (Andre and Yau, 1997).
In this paper we present the results of a numerical simula-tion of oxygen and proton dynamics in the turbulent mag-netopause configuration. We develop a simple model of the magnetosphere-magnetosheath transition which mimics some of the main features observed by spacecraft. The main idea is that magnetic turbulence provides ions with the mo-bility across the magnetopause. In this case they may be ac-celerated by the quasi-dc potential drop, as well as by other mechanisms. In the numerical simulation, H+and O+ions are injected at one boundary of the simulation box with ve-locities similar to those observed. A sheared magnetic field with components By, Bz represents the magnetopause and
an electric field Ex normal to the magnetic field accounts
for the observed quasi-dc potential drop. A numerical real-ization of 3-D magnetic fluctuations was superimposed on the average fields. We perform a parametric study of ion dynamics, changing the values of relevant parameters like the magnetic turbulence level δB/B0and the normal electric
field Ex. We find that oxygen transport and heating increase
with the increase of turbulence level. Due to different gyrora-dius, the two species of ions exhibit very different dynamics, with oxygen ions having more chance to penetrate through the magnetopause, be accelerated and gain bulk motion en-ergy effectively, while protons are hardly able to cross the magnetopause, being scattered by the magnetic fluctuations. In Sect. 2 we present the features of the numerical model. In Sect. 3 we give the numerical results, showing the differ-ences between proton and oxygen behaviour, the dependence of the results on the magnetic turbulence level, and the in-fluence of varying the cross-magnetopause electric field. In Sect. 4 we give the conclusions.
2 Numerical model
The numerical model is an upgraded version of the code used by Greco et al. (2003) to study proton transport across the magnetopause. Both protons and oxygen ions are in-jected into the simulation box, which extends for Lx≡L in
the x (normal to the magnetopause) direction, and is much larger in the y- and z-directions, Ly=Lz=30 L. The
aver-age magnetic field is given by Bz≃B0tanh(x/1), with 1
the current sheet half-thickness, and By=const the “shear”
magnetic field. We set 1=0.25 L (the profile of the mag-netic field reversal is slightly modified with respect to Harris sheet, in order to have Bz=B0 at the boundaries, see Veltri
et al., 1998), with the box boundaries at x=±0.5 Lx. In the
present runs, By=0.8B0, which gives a shear angle slightly
larger than 90◦. Physical values of the parameters can be ob-tained by setting L=2000 km and B0=50 nT. We note that
Amata et al. (2006) report a magnetopause velocity along the normal of 32 km/s. The region with enhanced turbulence extends for about 90 s around the magnetopause location, see Fig. 1, so that the thickness of the turbulent region can be estimated as ∼2880 km. A simulation box thickness of about 2000 km, centered around the magnetopause crossing, is therefore realistic. The normal electric field E=−V ×B is due to the plasma flow in the magnetosheath parallel to the magnetopause and corresponds in Cluster data to a potential drop of the order of 10 kV, with the electric field Ex≃6 mV/m
pointing away from the Earth (Amata et al., 2006). Indeed, the simulatenous presence of a quasi-dc electric field and of magnetic turbulence at the magnetopause is apparent in the considered magnetopause crossing. Therefore, proton and oxygen ions coming from the ionosphere could be acceler-ated if they could cross the magnetic field.
In the present runs, the electric field is modeled as Ex(x)=E0exp[−(x−x0)2/x02], with x0=0.25 L, that is the
electric field is centered on the outward side of the magne-topause transition, in agreement with the observations (Am-ata et al., 2006) and with the fact that the quasi dc Exis due
to V ×B in the magnetosheath. For most runs, the peak value is E0=22.57 mV/m, which corresponds to a potential energy
drop 1U =e1ϕ≃17 keV within the simulation box. Another
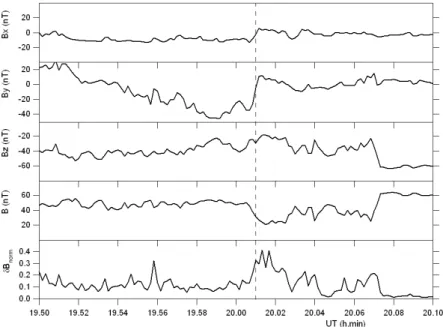
Fig. 1. Magnetic field components measured by the Cluster spacecraft during the 13 February 2001, magnetopause crossing, averaged over
10 s. From top to bottom, the three magnetic field components in the GSM system, the magnetic field magnitude, and the fluctuation level δB normalized to the local magnitude are shown. The simulation box of the numerical study corresponds approximately to the measurements going from 20:00:30 UT to 20:01:30 UT.
value, E0=6 mV/m, corresponding to the measuread
elec-tric field, was also used. These choices are due to the fact that to have a realistic potential drop with a realistic electric field would have required a simulation box larger (in x) than that used, with a corresponding increase in the computational time. The other two components of the electric field are taken equal to zero.
The magnetic fluctuations are modelled, following Greco et al. (2003), as a sum of plane waves
δB(r) =X
k,σ
δB(k)eσ(k) exp[i(k · r + φkσ)], (1)
where eσ(k) are the polarization unit vectors, and the random
phases φkσ are chosen so that the fluctuations sum up coher-ently for x = 0, so that they are stronger in the center of the simulation box (for more details, see Veltri et al., 1998, and Greco et al., 2003). The Fourier amplitudes δB(k) are given by
δB(k) = C
(kx2lx2+ky2ly2+kz2lz2+1)α/4+1/2
(2) where C is a normalization constant, which sets the value of the magnetic turbulence level. The wave vectors are chosen on a discrete 3-D grid, with ki=2π ni/ li, i=x, y, z,
where ni are the harmonic numbers and li the turbulence
correlation lengths. We set lx=0.05Lx and ly=lz=0.5Lx
(this also corresponds to the simulation box geometry). Also, kx min=2π/Lx, kx max=12kx min, and the spectral index
α=1.5 is in the range of those observed (Nykyri et al., 2006).
For all runs, 20 000 particles were injected at x=−0.5 L, which represents the magnetospheric side of the simulation box, with random position in the yz plane. The injection velocity corresponds to a thermal velocity of 600 eV and a bulk velocity 50–100 km/s, making an angle of about 40◦ with the average magnetic field direction at the x=−0.5 L boundary. Protons were injected with the same initial flow velocity and the same initial temperature. The trajectories of test particles are integrated by means of a 4th 5th order adap-tive step Runge-Kutta routine. A maximum integration step corresponding to the minimum between 0.1−i1and 1/10 of the time needed to cover the shortest wavelength of the turbu-lence model was chosen. Here, i is the ion gyrofrequency.
We checked the integration accuracy by requiring that the particle energy be conserved with a relative variation of at most 10−6, and typically much less. Distribution function moments like density n, bulk velocity V , and temperature T are computed on a 3-dimensional grid in space (Veltri et al., 1998; Greco et al., 2003).
It was shown by Taktakishvili et al. (2003) and by Greco et al. (2003), that this magnetic turbulence allows the flow of ions across the magnetopause, for magnetic fluctuations levels δB/B0≥0.3. Here, δB is the rms value of the
fluc-tuations; we note that in the cusp region values of δB/B0
of order of 0.5–1 are not uncommon. During the magne-topause crossing of 13 February 2001, upstream in the mag-netosheath and at the magnetopause δB/B0∼0.3–0.4, see
Fig. 1. The magnetic fluctuations were strong in the fre-quency range 10−2–1 Hz (Nykyri et al., 2006), and we note
1880 A. Taktakishvili et al.: Oxygen transport across magnetopause 6 8 10 12 14 16 18 20 22 24 26 28 30 -0.5 0.0 0.5 -0.5 0.0 0.5 -15-14-13-12-11-10 -9 -8 x/ L y/L x/ L z/L pentrated oxygen ion proton exited from y=-15L -0.5 0.0 0.5 x/ L
Ions exited from Z=30L
proton oxygen -0.5 0.0 0.5 x/ L Reflected Ions proton oxygen
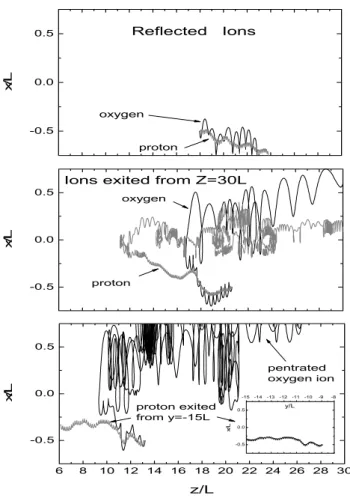
Fig. 2. Sample trajectories of proton and oxygen ions in the
sim-ulation box, for δB/B0=0.6. All the particles are injected at
x=−0.5 L. Black lines: oxygen. Grey lines: protons. Upper panel:
particles exiting from the injection side (“reflected”). Middle panel: particles exiting from the side boundaries. Lower panel: oxygen ex-iting from the magnetosheath side, proton from the side boundaries.
that the O+gyrofrequency in the 50 nT magnetic field at the magnetopause is ν=4.7×10⁻²Hz. This resonant interaction corresponds in the simulation to the fact that the oxygen Lar-mor radius (∼300 km) falls within the range of the turbu-lence wave lengths in the x-direction (160 km<λ<2000 km). Clearly, the proton behaviour can be different because of the smaller Larmor radius.
3 Simulation results
In this section we present the results of the simulation, com-pare oxygen and proton trajectories and present the cross-magnetopause profiles (along the x-direction) of their num-ber density, bulk motion velocity, and kinetic temperature. Then we investigate in more detail the influence of the mag-netic turbulence level and of the electric field value on the oxygen transport.
3.1 Proton vs. oxygen comparison
In Fig. 2 the xz projections of sample oxygen and proton trajectories are presented. In this figure, oxygen is repre-sented by black solid lines and protons by lighter gray lines. For each of the panels both ion species were launched with the same initial position, i.e., the same randomly chosen y and z coordinates at the magnetospheric border of the simu-lation box, x=−0.5 L (bottom section of each panel). The upper part of each panel, x≥0.5 L, represents the magne-tosheath part of the simulation box. The upper panel of Fig. 2 shows reflected ions, that is, ions which exit the simulation box from the same side as the injection one. The middle panel shows particles that exit from the flank of the simula-tion box: both proton and oxygen exit from the z border at z=30 L. Note that since the initial temperatures of the parti-cles are equal, the proton gyroradius is 4 (square root of mass ratio) times smaller than the oxygen gyroradius. For both ion species, the magnetic turbulence causes a strong devia-tion from the idealized helical trajectories in simple magnetic field geometries. The protons have a smaller gyroradius and thus are tied more strongly to the magnetic field structure, so that they exhibit a much more stochastic trajectory. In-deed, it can be shown that for large Larmor radii, part of the magnetic fluctuations are averaged along the gyroorbit (Zim-bardo, 2005; Pommois et al., 2007). On the other hand, the O+acceleration by the electric field from the middle (x∼0) of the simulation box is rather obvious. Both ion species spend most of the time in the central part of the box x∼0 before exiting, exhibiting a rather prominent average electric drift motion (E×B)zin the positive z-direction in the upper
section (x>0), which is the reason of their exit from the sim-ulation box at z=30 L. The bottom panel of Fig. 2 shows a different behavior of the oxygen and proton ions. The oxy-gen is strongly accelerated in the initial phase in the cross magnetopause direction by the electric field, and after bounc-ing close to the region of the strong border magnetic field x=0.5 L, finally penetrates into the magnetosheath. On the contrary, proton remains all the time close to magnetosphere boundary and finally exits from the simulation box border in the y-direction, y=15 L (see the inset in this panel, showing the projection of the proton trajectory on the xy plane). Note that Ex is exponentially small for x<0, so that the (E×B)
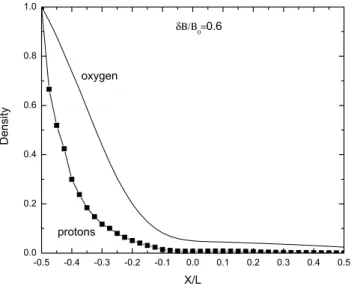
velocity is negligible. These trajectories are most interest-ing, since they demonstrate the fact that oxygen ions, having larger gyroradius, have more chances to cross the magne-topause and be accelerated by the electric field than protons. This behaviour is confirmed by Fig. 3, which shows the density, normalized to the injection value at x=−0.5 L, as a function of x for the level of fluctuations δB/B0=0.6. In
this and the following figures, the plotted quantities are aver-aged over the y- and z-directions. It can be seen that a larger number of oxygen ions are able to cross the magnetopause, while proton density drops dramatically for the rightmost, magnetosheath side of the simulation box, x>0. In spite of
-0.5 -0.4 -0.3 -0.2 -0.1 0.0 0.1 0.2 0.3 0.4 0.5 0.0 0.2 0.4 0.6 0.8 1.0 D e n si ty X/L δΒ/Β 0=0.6 oxygen protons
Fig. 3. Density profiles in the simulation box for proton and oxygen
ions. Dimensionless units.
the substantial level of magnetic turbulence, very few protons are able to cross the magnetopause.
Figure 4 shows the z-component Vbzof oxygen and
pro-ton bulk motion, for the level of fluctuations δB/B0=0.6.
The bulk velocity Vbzis increasing with x, because of the
ac-celeration due to Exfor both species. Protons appear to be
faster, but oxygen ions gain bulk energy more efficiently, due to their larger mass. The behaviour of bulk energy can be inferred from Fig. 4, where it is seen that the oxygen velocity is about one half of the proton velocity, at the right bound-ary of the simulation box. Due to the mass ratio, this implies that the oxygen bulk energy is about 4 times the proton bulk energy (a minor contribution comes from Vby, not shown).
This means that in the presence of turbulence ions can cross the magnetopause, but those ions which have larger gyrora-dius cross quickly and easily, so that they gain an increase of bulk kinetic energy.
Figure 5 shows the temperature growth with x for both particles, normalized to the potential energy drop 1U . One can see that magnetic fluctuations are an active thermalizing agent. These profiles show more efficient proton heating due to the fact that the fluctuations scatter protons more strongly, causing them a wider spread in particle velocity, which corre-sponds to an increase in temperature. Conversely, for oxygen ions a larger share of energy goes into bulk kinetic energy rather than thermal energy.
These results show that the turbulent magnetopause ex-hibits a selective permeability for ions with different masses, allowing heavier oxygen ions to exit from the magnetosphere to the magnetosheath, and be accelerated and heated by the electric field. For protons, on the contrary, the magnetopause appears to be a much more impermeable obstacle, since their smaller gyroradius does not allow them to move across the turbulent magnetopause efficiently.
-0.5 -0.4 -0.3 -0.2 -0.1 0.0 0.1 0.2 0.3 0.4 0.5 0 100 200 300 400 500 Vb z (km/ s) X/L δΒ/Β 0=0.6 protons oxygen
Fig. 4. Bulk velocity along z in the simulation box for proton and
oxygen ions. -0.5 -0.4 -0.3 -0.2 -0.1 0.0 0.1 0.2 0.3 0.4 0.5 0.0 0.1 0.2 0.3 0.4 0.5 T e mp e ra tu re / ∆ U X /L δΒ/Β 0=0.6 protons oxygen
Fig. 5. Temperature profiles for proton and oxygen ions.
Dimen-sionless units.
3.2 Influence of the turbulence level δB/B0
We made a number of runs with oxygen ions only, in order to assess the influence of δB/B0and of E0on the transport
properties. Figure 6 shows the density profile for O+, for
turbulence levels varying from δB/B0=0 to 0.3, 0.6, and 1.0,
i.e., in the range of those observed at the high latitude magne-topause. While the left side (the injection side) of the density profiles reflects the ion penetration due to the initial Larmor radii (which have an approximately Gaussian distribution), the right side depends on the turbulence level, which is the basic ingredient which allows cross field transport. It can be seen that the height of the density profile increases with the
1882 A. Taktakishvili et al.: Oxygen transport across magnetopause -0.5 -0.4 -0.3 -0.2 -0.1 0.0 0.1 0.2 0.3 0.4 0.5 0.0 0.2 0.4 0.6 0.8 1.0 δB/B0=0 0.6 1.0 0.3 D e n si ty x/L
Fig. 6. Oxygen density profile for different turbulence levels (as
indicated). Dimensionless units.
-0.5 -0.4 -0.3 -0.2 -0.1 0.0 0.1 0.2 0.3 0.4 0.5 0 2 4 6 8 10 δB/B 0=0 1.0 0.6 0.3 Vb x
(
km/ s)
x/LFig. 7. Oxygen bulk velocity along x for different turbulence levels
(as indicated).
turbulence level, in agreement with the results of Greco et al. (2003). Also note that, in practice, almost no oxygen ion is able to cross the current layer for δB/B0=0.
Figure 7 shows the behaviour of the x component of bulk velocity, Vbx. Such a velocity increases with δB/B0, and
corresponds to the flux of ions from the injection (magne-tospheric) side at x=−0.5 L to the magnetosheath side at x=0.5 L, with the asymmetry from the negative to positive values of x due to the fact that the electric field is centered at x0=0.25 L. We point out that the values of the velocity
are very small, a few km/s, which is much smaller than the particle velocities. This means that, in spite of the large gy-roradius, O+motion occurs in a diffusive way.
-0.5 -0.4 -0.3 -0.2 -0.1 0.0 0.1 0.2 0.3 0.4 0.5 0 100 200 300 400 Vb z
(
km/ s)
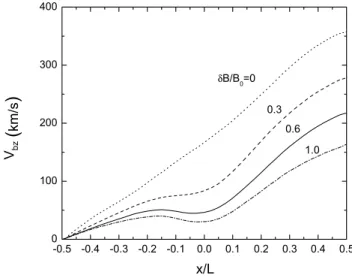
x/L δB/B0=0 1.0 0.3 0.6Fig. 8. Oxygen bulk velocity along z for different turbulence levels
(as indicated). -0.5 -0.4 -0.3 -0.2 -0.1 0.0 0.1 0.2 0.3 0.4 0.5 0.0 0.1 0.2 0.3 0.4 0.5 δB/B 0=0 1.0 0.3 T e mp e ra tu re / ∆ U x/L 0.6
Fig. 9. Oxygen temperature profiles for different turbulence levels.
Dimensionless units.
Figure 8 shows the z component of bulk velocity, Vbz. It
can be seen that it grows from negative to positive values of x, and that Vbz is the larger, the smaller δB/B0. For small
δB/B0, values of Vbz of the order of 300–400 km/s are
ob-tained; these large values are due to the z-component of the E×Bdrift, given by VEz=ExBy/B2. Since By=const, the
value of the drift velocity depends mostly on Ex, which is
strongest in the magnetosheath side, and with some modula-tion by B2. We also notice that the obtained values of Vbz
are larger than those observed because, in the present runs, Exis larger than that observed, too. On the other hand, when
the turbulence level is increased, the particle trajectories are
-0.5 -0.4 -0.3 -0.2 -0.1 0.0 0.1 0.2 0.3 0.4 0.5 0.0 0.2 0.4 0.6 0.8 1.0 E0=6mV/m D e n si ty X/L δΒ/Β=0.6 E0=0 E0=22mV/m
Fig. 10. Oxygen density profiles for different values of the electric
field (as indicated). Dimensionless units.
disturbed, and important deflections are caused by δB, see Fig. 2, so that the E×B motion is progressively blurred out, and Vbz decreases. A somewhat similar behaviour is found
for Vby (not shown). Note that for large δB/B0, a smaller
fraction of the potential energy due to Exis converted to bulk
motion.
Figure 9 shows the corresponding temperature profiles. It can be seen that the temperature increases from the mag-netospheric to the magnetosheath sides, and that the larger δB/B0, the larger the temperature. For the kinetic energy
of bulk motion, the opposite trend with δB/B0is found (not
shown). This confirms that magnetic turbulence plays an im-portant role in thermalizing the kinetic energy obtained by crossing the electric potential drop. As shown by Fig. 5, such a thermalization is more effective for H+than for O+. 3.3 Influence of the electric field strength E0
We explored the influence of the steady electric field intensity on the transport and energization properties of O+, chang-ing the value of the peak electric field from E0=0 to 6 mV/m
and to 22 mV/m, while keeping the magnetic turbulence level to δB/B0=0.6. Figure 10 shows the oxygen density profile
for different electric fields: it can be seen that the density decreases with the increase of E0, contrary to naive
expec-tations. We consider that this is due to the influence of the E×Bdrift, which grows with E0and which causes the ions
to move fast in the y- and z-directions. Indeed, in a stationary one dimensional configuration, the continuity equation re-quires the flux to be constant, so that the larger the velocity, the smaller the density. Accordingly, the density at around x=0 is maximum for E0=0, as there is no electric drift and
ions lazily spend time in the center of the simulation box,
-0.5 -0.4 -0.3 -0.2 -0.1 0.0 0.1 0.2 0.3 0.4 0.5 0 50 100 150 200 250 300 Vb z (km/ s) X/L E0=6mV/m
δΒ/Β
0=0.6
E0=22mV/m E0=0Fig. 11. Oxygen bulk velocity along z for different values of the
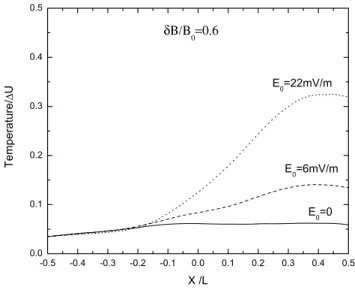
electric field. -0.5 -0.4 -0.3 -0.2 -0.1 0.0 0.1 0.2 0.3 0.4 0.5 0.0 0.1 0.2 0.3 0.4 0.5 E0=6mV/m E0=0 E0=22mV/m T e mp e ra tu re / ∆ U X /L δΒ/Β 0=0.6
Fig. 12. Oxygen temperature profiles for different values of the
electric field. Dimensionless units.
finding their stochastic pathway through the distorted mag-netic field. The influence of E0is clearly shown in Fig. 11,
where the bulk velocity Vbzis reported, and it is seen that
Vbz steadily increases with E0, in spite of the relevant
tur-bulence level δB/B0=0.6. Finally, in Fig. 12 we show the
temperature profile for different values of E0. All
tempera-tures are normalized to the largest potential energy drop 1U corresponding to E0=22 mV/m. As expected, the stronger
E0, the larger the temperature increase due to the crossing of
the potential drop. For E=0, there is no temperature growth, apart from a very small increase which can be related to ve-locity filtration.
1884 A. Taktakishvili et al.: Oxygen transport across magnetopause
4 Conclusions
We propose that the magnetic fluctuations can be effective in allowing particles to migrate across the magnetopause cur-rent layer. We performed a comparative numerical analy-sis of oxygen and proton ion dynamics in the Earth’s mag-netopause in the presence of magnetic turbulence and cross magnetopause electric field. The fluctuations and the finite Larmor radius effect allow ions to jump from one magnetic surface to another, gradually being displaced in the cross layer (x) direction. The simulation clearly demonstrates how the mass (Larmor radius) difference between the two species results in a substantial dissimilarity in particle dynamics and, consequently, in difference of the cross-magnetopause pro-files of the distribution function moments, such as density, bulk velocity, and temperature. It appears that heavier oxy-gen ions are more likely to exit from the magnetosphere to the magnetosheath and be orderly accelerated by the electric field. Protons, due to their smaller gyro radius, are hardly able to cross the magnetopause, being effectively scattered by the magnetic fluctuations and heated. The reported results of a selective permeability of the turbulent magnetopause could be used to explain the Cluster observation of energetic oxygen ions on 13 February 2001, and show that oxygen ions can escape locally from the magnetopause. Analysis of Cluster data in the magnetotail, too, shows that the proton and singly charged oxygen dynamics can be very different (Kistler et al., 2005), with the O+ions exhibiting a
nonadia-batic behaviour.
By varying the magnetic turbulence level in the simula-tion, we have shown that the number of O+ crossing the magnetopause grows with δB/B0, and that very few ions can
cross the magnetopause for δB/B0=0. The ion temperature
also grows with δB/B0, showing that magnetic turbulence is
effective in thermalizing the kinetic energy gain due to the cross-magnetopause potential drop. It appears that this po-tential drop may give a contribution to the oxygen energiza-tion, although additional mechanisms have to be considered in order to reach the 10–20 keV of the observed O+beams (e.g., Andre and Yau, 1997; Yau and Andre, 1997; Chappell et al., 2000; Bogdanova et al., 2004; Nilsson et al., 2006). On the other hand, populations of very energetic ions with energies from 10 keV up to a few MeV are often observed in the cusp regions as well (Chen et al., 1998; Chen and Fritz, 2001; Fritz et al., 2003). The acceleration mechanisms for these particles are not yet clear (Chen al al., 1998; Fritz et al., 2000), although electromagnetic turbulence is likely to play an important role. This issue will be considered in a future paper.
Acknowledgements. This research was partially supported by
grants INTAS-03-50-4872, INTAS 05-100008-8050, RFFR 06-02-17256, and INTAS 06-1000017-8943. Further support was given by the Italian Istituto Nazionale di Astrofisica (INAF), and by the Agenzia Spaziale Italiana (ASI).
Topical Editor I. A. Daglis thanks D. Sundqvist and another anonymous referee for their help in evaluating this paper.
References
Amata, E., Savin, S., Andre, M., et al.: Experimental study of non-linear interaction of plasma flow with charged thin current sheets: 1. Boundary structure and motion, Nonlin. Processes Geophys., 13, 1–12, 2006,
http://www.nonlin-processes-geophys.net/13/1/2006/.
Andre, M. and Yau, A.: Theories and observations of ion energiza-tion and outflow in the high latitude magnetosphere, Space Sci. Rev., 80, 27–48, 1997.
Blecki, J., Wronovski, R., Savin, S., et al.: Low-frequency plasma waves in the outer polar cusp: A review of observations from PROGNOZ 8, INTERBALL 1, MAGION 4, and CLUSTER, Surv. Geophys., 26, 177–191, 2005.
Bogdanova, Y. V., Klecker, B., Paschmann, G., Kistler, L. M., et al.: Investigation of the source region of ionospheric oxygen out-flow in the cleft/cusp using multi-spacecraft observations by CIS onboard Cluster, Adv. Space Res., 34, 2459–2464, 2004. Chappell, C. R., Giles, B. L., Moore, T. E., Delcourt, D. C., Craven,
P. D., and Chandler, M. O.: The adequacy of the ionospheric source in supplying magnetospheric plasma, J. Atmos. Sol. Terr. Phys., 62, 421–436, 2000.
Chen, J. and Fritz, T. A.: Correlation of cusp MeV helium with turbulent ULF power spectra and its implications, Geophys. Res. Lett., 25, 4113–4116, 1998.
Chen, J. and Fritz, T. A.: Energetic oxygen ions of ionospheric ori-gin observed in the cusp, Geophys. Res. Lett., 28, 1459–1462, 2001.
Chen, J., Fritz, T. A., Sheldon, R. B., et al.: A new, temporarily confined population in polar cap during the August 27, 1996 ge-omagnetic field distortion period, Geophys. Res. Lett., 24, 1447– 1450, 1997.
Chen, J., Fritz, T. A., Sheldon, R. B., et al.: Cusp energetic par-ticle events: Implications for a major acceleration region of the magnetosphere, J. Geophys. Res., 103, 69–78, 1998.
Fritz, T. A.: The role of the cusp as a source for magnetospheric particles: A new paradigm, in: ESA Special Publication of the Proceedings of the Cluster II Workshop on Multiscale/Multipoint Plasma Measurements held at Imperial College, London, 22–24 September 1999, ESA SP-499, 2000.
Fritz, T. A., Chen, J. and Siscoe, G.: Energetic ions, large diamag-netic cavities, and Chapman-Ferraro cusp, J. Geophys. Res., 108, 1028, doi:10.1029/2002JA009476, 2003.
Greco, A., Taktakishvili, A. L., Zimbardo, G., et al.: Ion trans-port and Levy random walk across the magnetopause in the presence of magnetic turbulence, J. Geophys. Res., 108, 1395, doi:10.1029/2003JA010087, 2003.
Haerendel, G., Paschmann, G., Sckopke, N., and Rosenbauer, H.: The frontside boundary layer of the magnetosphere and the prob-lem of reconnection, J. Geophys. Res., 83, 3195–3216, 1978. Kistler, L. M., Mouikis, C., M¨obius, E., et al.: Contribution
of nonadiabatic ions to the cross-tail current in an O+ dom-inated thin current sheet, J. Geophys. Res., 110, A06213, doi:10.1029/2004JA010653, 2005.
Lockwood, M., Waite Jr., J. H., Moore, T. E., Johnson, J. F. E., and Chappell, R.: A new source of suprathermal O+ ions near the
dayside polar cap boundary, J. Geophys. Res., 90, 4099–4116, 1985.
Moore, T. E., Lockwood, M., Chandler, M. O., Waite Jr., J. H., Chappell, C. R., et al.: Upwelling O+ ion source characteristics, J. Geophys. Res., 91, 7019–7031, 1986.
Nilsson, H., Waara, M., Arvelius, S., Marghitu, O., et al.: Char-acteristics of high altitude oxygen ion energization and outflow as observed by Cluster: a statistical study, Ann. Geophys., 24, 1099–1112, 2006,
http://www.ann-geophys.net/24/1099/2006/.
Nykyri, K., Cargill, P. J., Lucek, E., Horbury, T. S., et al.: Cluster observations of magnetic field fluctuations in the high-latitude cusp, Ann. Geophys., 22, 2413–2418, 2004,
http://www.ann-geophys.net/22/2413/2004/.
Nykyri, K., Grison, B., Cargill, P. J., Lavraud, B., Lucek, E., et al.: Origin of the turbulent spectra in the high-latitude cusp: Cluster spacecraft observations, Ann. Geophys., 24, 1057–1075, 2006, http://www.ann-geophys.net/24/1057/2006/.
Peroomian, V., El-Alaoui, M., Abdalla,, M. A., and Zelenyi, L. M.: Dynamics of ionospheric O+ions in the magnetosphere during the 24–25 September 1998 magnetic storm, J. Geophys. Res., 111, A12203, doi:10.1029/2006JA011790, 2006.
Pommois, P., Zimbardo, G., and Veltri, P.: Anomalous, non Gaussian transport of charged particles in anisotropic magnetic turbulence, Phys. Plasmas, 14, 012311–012322, doi:10.1063/1.2434795, 2007.
Sahraoui, F., Belmont, G., Rezeau, L., Cornilleau-Wehrlin, N., Pin-con, J. L., and Balogh, A.: Anisotropic turbulent spectra in the terrestrial magnetosheath as seen by the Cluster spacecraft, Phys. Rev. Lett. 96, 075002, 2006.
Savin, S. P., Romanov, S. A., Fedorov, A. O., Zelenyi, L. M., Klimov, S. I., et al.: The cusp/magnetosheath interface on May 29, 1996: Interball-1 and Polar observations, Geophys. Res. Lett., 25, 2963–2966, 1998.
Savin, S. P., Zelenyi, L. M., Maynard, N. C., Sandhal, I., et al.: Multi-spacecraft tracing of turbulent boundary layer, Adv. Space Res., 30, 2821–2830, doi:10.1016/S0273-1177(02)80422-7, 2002.
Savin, S., Zelenyi, L. M., Amata, E., et al.: Dynamical interaction of plasma flow with the hot boundary layer of Geomagnetic trap, JETP Letters., 79, 368–371, 2004.
Savin, S., Skalsky, A., Zelenyi, L. M., et al.: Magnetosheath inter-action with the high latitude magnetopause, Surv. Geophys. 26, 95–133, 2005a.
Savin, S., Zelenyi, L., Amata, E., Buechner, J., Blecki, J., Greco, A., Klimov, S., Lopez, R. E., Nikutowski, B., Panov, E., Pickett, J., Rauch, J. L., Romanov, S., Song, P., Skalsky, A., Smirnov, V., Taktakishvili, A., Veltri, P., and Zimbardo, G.: Magne-tosheath interaction with high latitude magnetopause: Dynamic flow chaotization, Planet. Space Sci., 53, 133–140, 2005b.
Scudder, J. D., Mozer, F. S., Maynard, N. C., and Russell, C. T.: Fingerprints of collisionless reconnection at the separa-tor, I, Ambipolar-Hall signatures, J. Geophys. Res., 107, 1294, doi:10.1029/2001JA000126, 2002.
Shelley, E. G., Sharp, R. D., and Johnson, R. G.: Satellite obser-vations of energetic heavy ions during a geomagnetic storm, J. Geophys. Res., 77, 6104–6112, 1972.
Sundkvist, D., Krasnoselskikh, V., Shukla, P. K., et al.: In situ multi-satellite detection of coherent vortices as a manifestation of Alfvenic turbulence, Nature, 436, 825, doi:10.1038/nature03931, 2005a.
Sundkvist, D., Vaivads, A., Andr´e, M., et al.: Multi-spacecraft determination of wave characteristics near the proton gyrofre-quency in high-altitude cusp, Ann. Geophys., 23, 983–995, 2005b.
Taktakishvili, A., Greco, A., Zimbardo, G., Veltri, P., and Zelenyi, L.: Ion penetration into the magnetosphere through the turbulent magnetopause, Adv. Space Res., 31, 1437–1442, 2003. Veltri, P., Zimbardo, G., Taktakishvili, A. L., and Zelenyi, L. M.:
Effect of magnetic turbulence on the ion dynamics in the distant magnetotail, J. Geophys. Res., 103, 14 897–14 916, 1998. Yau, A. and Andre, M.: Sources of ion outflow in the high latitude
ionosphere, Space Sci. Rev., 80, 1–25, 1997.
Zimbardo, G.: Anomalous particle diffusion and Levy ran-dom walk of magnetic field lines in three-dimensional so-lar wind turbulence, Plasma Phys. Control. Fusion, 47, B755, doi:10.1088/0741-3335/47/12B/S57, 2005.
Zimbardo, G.: Magnetic turbulence in space plasmas: in and around the Earth’s magnetosphere, Plasma Phys. Control. Fusion, 48, B295, doi:10.1088/0741-3335/48/12B/S28, 2006.
Zimbardo, G., Veltri, P., Basile, G., and Principato, S.: Anomalous diffusion and L´evy random walk of magnetic field lines in three dimensional turbulence, Phys. Plasmas, 2, 2653–2663, 1995. Zimbardo, G., Greco, A., Veltri, P., Taktakishvili, A. L., Milovanov,
A. V., and Zelenyi, L. M.: Ion dynamics in the pre-substorm phase: influence of magnetic turbulence and of the normal com-ponent of the magnetic field, in: Proceedings of the Fifth Inter-national Conference on Substorms, St. Petersburg, 16–20 May, ESA SP-443, 225–228, 2000a.
Zimbardo, G., Veltri, P., and Pommois, P.: Anomalous, quasilinear, and percolative regimes for magnetic-field-line transport in axi-ally symmetric turbulence, Phys. Rev. E, 61, 1940–1948, 2000b.