Rheological characterisation of kaolinite clay:
experimental study
Hongwei WANG
1, Rachid ZENTAR
2, Dongxing WANG
31Department of Civil Engineering and Environmental IMT Lille Douai, EA 4515 - LGCgE, University of Lille, F-59000 Lille, France, [email protected]
2Department of Civil Engineering and Environmental IMT Lille Douai, EA 4515 - LGCgE, University of Lille, F-59000 Lille, France
3Key Laboratory of Geotechnical and Structural Engineering Safety of Hubei Province, School of Civil Engineering, Wuhan University, Wuhan, People’s Republic of China
ABSTRACT. The objective of this paper is to investigate the rheological behavior of kaolinite clay. A series of laboratory tests were conducted by using MCR 102 rheometer to investigate the rheological properties of the kaolinite clay flow at different shear strain rates. The relevance of the shear strength and apparent viscosity with the W/S ratios are analyzed according to the experimental results. To predict the data of shear stress and shear rate, different rheological models were used. The results indicate that the best rheological models to predict the data is the Improved Bingham model. The yield stress and plastic viscosity of Kaolinite clay are influenced by the W/S ratios. The results from this research could contribute to improve the 3D printing of such material.
RÉSUMÉ. L'objectif de cet article est d'étudier le comportement rhéologique de la kaolinite. Une série d'essais rhéologiques de
laboratoire a été réalisée à l'aide d'un rhéomètre de type MCR 102 à différentes vitesses de cisaillement. La pertinence de la résistance au cisaillement et de la viscosité apparente avec les rapports W/S est analysée en fonction des résultats expérimentaux. Pour prédire les données de contraintes de cisaillements et de vitesses de cisaillements différents modèles rhéologiques ont été utilisés. Les résultats indiquent que, le meilleur modèle rhéologique pour prédire les données est le modèle de Bingham modifié. Le seuil d’écoulement et la viscosité plastique de la kaolinite sont influencés par les rapports W/S. Les résultats de cette recherche peuvent contribuer à améliorer l'impression 3D de ce type de Matériel.
KEY WORDS: Clays, Kaolinite, Rheological model, Yield stress, Viscosity.
MOTS-CLÉS: Argiles, Kaolinite, Modèle rhéologique, seuil d’écoulement, Viscosité.
1. Introduction
Clay is a kind of traditional and basic material used by human. It is the most widely used material in existence for building, civil engineering construction and infrastructure[1]. Clay is typically a mixture of hydrated
aluminosilicates with ratios of SiO2/A12O3 ranging from 2.0/1.0 to (4.0–5.0)/1.0[2]. One of the most abundant and
widely used clay minerals in industry is kaolinite clay[3]. It is estimated that the world's kaolinite production is 25
million tons per year. This is one of the main reasons that we choose it for this study. Moreover with the development of new technologies in building construction as 3D printing, this method could constitutes a reference material to rely the rheological properties with the constraints of such technology.
The main objective of this research is to evaluate the change in rheological properties of kaolinite clays with shear Rate and Water to Solid ratios (W/S). The influence of the water to solid ratios (W/S) on the yield stress and plastic viscosity of kaolinite clays under different rheological models is discussed.
2. Experimental materials and methods 2.1. Materials
The Physical characteristics of the Kaolinite clay that used in this study (in the form of manufactured powder) are reported in Table 1. The initial water content is 0.74%. The result of XRD indicated that the main mineralogical composition of the kaolinite clay is Kaolinite with a little amount of Muscovite. The results for particle size distribution of the raw Kaolinite clay shown that most of the powder particles are bigger than 1 μm, and that 10%, 50% and 90% of the particles are below 1.15 μm, 5.72 μm and 15.52 μm respectively. The liquid limit is about 48.96% and the plastic limit is about 30.31%.
Table 1. The Physical characteristics of the Kaolinite clay.
Sample Water content (%) % < 1.15 μm (%) % < 5.72 μm (%) % < 15.52 μm (%) Liquid limit (%) Plastic limit (%) Kaolinite clay 0.74 10 50 90 48.96 30.31 2.2. Rheological Measurements
The rheological characterisation was performed using an Anton Paar MCR 102 rheometer with parallel plates. The rheometer is characterized by high precision and accuracy, and the Controlled Shear Rate (CSR) test using the parallel disk rheometer to obtain the flow curves of shear stress versus shear rate. The shear rate is decreased from 20 s-1 to 1 s-1 at a controlled temperature of 20 ± 0.1℃.
The preparation of slurries was conducted by mechanically mixing the kaolinite clay powder with water at different water to solid ratios (W/S) between 0.90 and 1.20 (0.90, 0.95, 1.00, 1.05, 1.10, 1.15, and 1.20). In this study, the kaolinite samples were prepared and tested with tap water. And the same clay was used for all slurries and only the amount of water was varied from formulation to formulation. Therefore, the composition was expected to have no effect on the final results.
The test procedure include two stages: the first stage consists in pre-shearing the sample with a high shear strain rate to homogenize the sample and to remove any build up structure of the clay. After this first pre-shearing the shear rate strain was decreased gradually to draw the flow curve for the material. The same protocol was followed for all the presented tests.
3. Results and discussions
3.1. The rheological properties of Kaolinite clay
Fig. 1(a) presents the shear stress with shear rate curve of Kaolinite clay. It can be found that, the presence of yield stress of Kaolinite clay is evident. However, it can cause flow as the shear stress is more than yield stress, and as the shear rate increases, the shear stress nonlinearly increases as well. The results indicate that the Kaolinite clay is non-Newtonian viscous fluid. Besides, the W/S ratios decrease induce the shear stress increases, the possible reason is that because of the lack of water, the formulation with a lower water content requires a higher yield stress to induce flow compared to the other formulations.
The apparent viscosity is the ratio of the shear stress to the corresponding shear rate. The flow curve of apparent viscosity with shear rate of Kaolinite clay is shown in Fig. 1(b). It can be seen that the apparent viscosity decrease as the shear rate increases. Especially, the apparent viscosity shows a rapid decrease at low shear rate range (1-10 s-1), and then a slow decrease at higher shear rate (10-20 s-1) within the measured interval. The W/S ratios of 1.20
and 0.90 presented the lowest and the highest apparent viscosity of all samples, indicating that the Kaolinite clay
samples with a lower water content are deformed more slowly under the same shear rate than samples with a higher water content. The results indicate that the difference of the apparent viscosity at the same shear rate of Kaolinite clay is highly dependent on the W/S ratios.
Figure 1. (a) Shear stress – shear rate curves of different samples (b) Apparent viscosity - shear rate curves
of different samples.
3.2. The rheological models of Kaolinite clay
A lot of rheological models can be used to describe the flow curve [4,5]. From the analysis of part 3.1, the
Kaolinite clay paste exhibits a yield stress with a change in viscosity with shear rate, therefore, Improved Bingham model, Herschel–Bulkley model and Casson model are chosen to fit the measured rheological data, as shown in Table 2. In these models, τ is the shear stress (Pa); ߛሶ is the shear rate (1/s); τ0is the yield stress (Pa); ηpis the
plastic viscosity (Paವs); c is a constant; K is the consistency index (Paವs); n is the flow behavior index and η∞is
the infinite viscosity (Paವs). For comparison Bingham model is also used in this study.
Table 2. The conventional rheological models.
Model Eqs Model Eqs
Bingham model τ=τ0+ ηpߛሶ Herschel-Bulkley model τ=τ0+ Kߛሶn
Improved Bingham model τ=τ0+ ηpߛሶ + cߛሶ2 Casson model τ1/2=τ01/2+ (η∞ߛሶ)1/2
The application of these models to fit the test data of shear stress verssus shear rate are performed by using a software. In Fig. 2(a), the yield stress of Kaolinite clay calculated by the different models is shown. According to Fig. 2(a), the yield stress value predicted by Bingham model is the largest, the Casson model predicts the lowest yield stress, and the improved Bingham model and Herschel-Bulkley model predict intermediate values.
0.90 0.95 1.00 1.05 1.10 1.15 1.20 0 20 40 60 80 100 120 Y ie ld stress (Pa ) W/S Bingham model Improved Bingham model Hereshel-Bulkley model Casson model 0.90 0.95 1.00 1.05 1.10 1.15 1.20 30 40 50 60 70 80 90 100 110 120 110.655 94.378 73.742 59.582 54.328 46.586 36.19 Yield stress(Pa) W/S reduce
Figure 2. (a)Yield stress fitted by the different models (b)Yield stress with different W/S by Improved Bingham
model
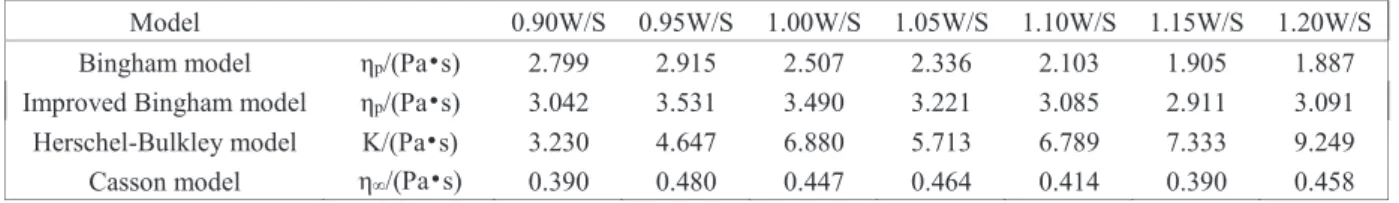
It can be seen from Table 3 that the plastic viscosity value of Improved Bingham model is slightly higher than that of Bingham model. The consistency coefficient of all samples predicted by the Herschel-Bulkley model are large. All the infinite viscosity obtained by the Casson model are small.
Table 3. plastic viscosity(ηp), consistency index(K), infinite viscosity(η∞) values of the different models.
Model 0.90W/S 0.95W/S 1.00W/S 1.05W/S 1.10W/S 1.15W/S 1.20W/S Bingham model ηp/(PaЬs) 2.799 2.915 2.507 2.336 2.103 1.905 1.887
Improved Bingham model ηp/(PaЬs) 3.042 3.531 3.490 3.221 3.085 2.911 3.091
Herschel-Bulkley model K/(PaЬs) 3.230 4.647 6.880 5.713 6.789 7.333 9.249 Casson model η∞/(PaЬs) 0.390 0.480 0.447 0.464 0.414 0.390 0.458
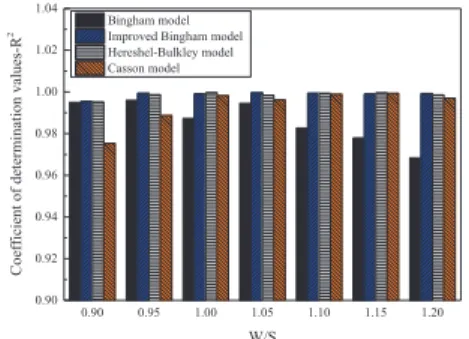
R2 refers to the coefficient of determination of the equation, are usually used to evaluate whether the
mathematic equations are suitable for measured data, ranging from 0 to 1, and the value is the closer to 1, the
0 40 80 120 160 200 0 2 4 6 8 10 12 14 16 18 20 τ/P a /s-1 W/S=0.90 W/S=0.95 W/S=1.00 W/S=1.05 W/S=1.10 W/S=1.15 W/S=1.20 0 20 40 60 80 100 120 0 2 4 6 8 10 12 14 16 18 20 η/P a /s-1 W/S=0.90 W/S=0.95 W/S=1.00 W/S=1.05 W/S=1.10 W/S=1.15 W/S=1.20
higher the fit of the rheological models. As shown in Fig. 3, considering the R2, the four rheological models have
high goodness of fit, which indicates that the four models give the appropriate fitting results. However, if compare the four rheological models, the Bingham model and Casson model have low goodness of fit (some of R2 < 0.99).
The Improved Bingham model and Herschel–Bulkley model are similar, both have high R2 (all R2 > 0.99),
regardless of W/S ratios. And the Improved Bingham model has higher R2 than Herschel–Bulkley model. This
means that the Improved Bingham model is more suitable than Herschel-Bulkley model to fit the flow curves of Kaolinite clay. 0.90 0.95 1.00 1.05 1.10 1.15 1.20 0.90 0.92 0.94 0.96 0.98 1.00 1.02 1.04
Coefficient of determination values-R
2
W/S
Bingham model Improved Bingham model Hereshel-Bulkley model Casson model
Figure 3. R2 values for the different models
3.3. Effect of the W/S ratios on the rheological properties of Kaolinite clay
The rheological shear stress – shear rate curves of Kaolinite clay fitted by the Improved Bingham model, the rheological parameters of yield stress and plastic viscosity with various W/S ratios are shown in Fig. 2(b) and Table 3. It can be seen from Fig. 2(b) that the yield stress of Kaolinite clay decrease with W/S ratios increase, there is one inflection point (W/S = 1.05) of the curve, the yield stress decreases rapidly as W/S <1.05; the yield stress decrease slowly at which W/S > 1.05. And the plastic viscosity of Kaolinite clay in Table 3 also shown decrease with W/S ratios increase from 0.95 to 1.15. It is proved that the rheological parameters of Kaolinite clay are seriously affected by the W/S ratios.
4. Conclusion
A series of experiments and analyses have been conducted to see which rheological model could be suitable for predicting the rheological behavior of Kaolinite clay. By comparing the coefficient of determination, standard deviation and the predicted rheological parameters of Bingham model, Improved Bingham model, Herschel– Bulkley model and Casson model, it was found that the Improved Bingham model was the best one to character the rheological behavior of Kaolinite clay. The yield stress and plastic viscosity of Kaolinite clay are influenced by the W/S ratios.
Acknowledgements
This research was undertaken with the financial support of CSC (China Scholarship Council) and the support of IMT Lille Douai.
References
[1] Moropoulou A, Bakolas A, Anagnostopoulou S.« Composite materials in ancient structures », Cement and Concrete Composites, vol. 27, n° 2, 2005, p. 295-300.
[2] Ríos, Carlos A., Craig D. Williams, and Michael A. Fullen. « Hydrothermal synthesis of hydrogarnet and tobermorite at 175 ć from kaolinite and metakaolinite in the CaO–Al2O3–SiO2–H2O system: A comparative study», Applied Clay Science,
vol. 43, n° 2, 2009, p. 228-237.
[3] Saikia, Bhaskar J., and Gopalakrishnarao P. « Fourier transform infrared spectroscopic characterization of kaolinite from Assam and Meghalaya, Northeastern India », Journal of Modern Physics, n° 1, 2010, p. 206-210.
[4] Feys D, Verhoeven R, De Schutter G. « Fresh self compacting concrete, a shear thickening material », Cement and Concrete Research, vol. 38, n° 7, 2008, p. 920-929.
[5] Peng J, Deng D, Liu Z, et al. « Rheological models for fresh cement asphalt paste », Construction and Building Materials, vol. 71, 2014, p. 254-262.