HAL Id: insu-01798739
https://hal-insu.archives-ouvertes.fr/insu-01798739
Submitted on 3 Sep 2020
HAL is a multi-disciplinary open access
archive for the deposit and dissemination of
sci-entific research documents, whether they are
pub-lished or not. The documents may come from
teaching and research institutions in France or
abroad, or from public or private research centers.
L’archive ouverte pluridisciplinaire HAL, est
destinée au dépôt et à la diffusion de documents
scientifiques de niveau recherche, publiés ou non,
émanant des établissements d’enseignement et de
recherche français ou étrangers, des laboratoires
publics ou privés.
Hydrogen from Mars
Majd Mayyasi, Dolon Bhattacharyya, John Clarke, Amy Catalano, Mehdi
Benna, Paul Mahaffy, Edward Thiemann, Christina Lee, Justin Deighan,
Sonal Jain, et al.
To cite this version:
Majd Mayyasi, Dolon Bhattacharyya, John Clarke, Amy Catalano, Mehdi Benna, et al.. Significant
Space Weather Impact on the Escape of Hydrogen from Mars. Geophysical Research Letters, American
Geophysical Union, 2018, 45 (17), pp.8844-8852. �10.1029/2018GL077727�. �insu-01798739�
Signi
ficant Space Weather Impact on the Escape
of Hydrogen From Mars
Majd Mayyasi1 , Dolon Bhattacharyya1 , John Clarke1 , Amy Catalano1 , Mehdi Benna2 , Paul Mahaffy2 , Edward Thiemann3 , Christina O. Lee4 , Justin Deighan3, Sonal Jain3 , Michael Chaffin3 , Matteo Crismani3 , William McClintock3 , Ian Stewart3, Greg Holsclaw3 , Arnaud Stiepen5 , Franck Montmessin6 , Nick Schneider3 , and Bruce Jakosky3
1
Center for Space Physics, Boston University, Boston, MA, USA,2NASA Goddard Space Flight Center, Greenbelt, MD, USA,
3Laboratory for Atmospheric and Space Physics, Boulder, CO, USA,4Space Sciences Laboratory, University of California,
Berkeley, CA, USA,5Laboratory for Planetary and Atmospheric Physics, University of Liège, Liège, Belgium,6LATMOS/IPSL, Guyancourt, France
Abstract
In September 2017, an active region of the Sun produced a series of strongflares and a coronal mass ejection that swept past Mars producing enhanced ionization and heating in the upper atmosphere. Emissions from atmospheric hydrogen Lyman-α were also enhanced at Mars. Temperatures derived from neutral species scale heights were used in conjunction with the H Lyman-α observations to simulate the effects of this space weather event on Martian hydrogen properties in the exosphere. It was found that hydrogen abundance in the upper atmosphere decreased by ~25% and that the H escape rate increased by a factor of 5, mainly through an increase in upper atmospheric temperature. This significant escape rate variation is comparable to seasonally observed trends but occurred at much shorter timescales. Such solar events would statistically impact extrapolation of Martian water loss over time.Plain Language Summary
The upper atmosphere of Mars is the region where its atmosphere can escape to outer space. Atmospheric escape has been linked to seasonal changes as Mars’ distance to the Sun varies along its orbit. A strong solar storm impacted Mars in September 2017. During that time, the upper atmosphere of the planet was heated on short timescales. Observations and analysis have shown that atmospheric escape of hydrogen, a key element in water, during the solar storm was comparable to the seasonal escape over a Martian year. This impacts understanding of primordial water content on Mars when extrapolating back in time.1. Introduction
The Sun has strong effects on the Earth’s environment (e.g., Gray et al., 2010). Investigating the consequences of solar cycle variability and the atmospheric response to solar weather is presently a high priority topic of interest (National Academies of Sciences, Engineering, and Medicine, 2017). The impact of solar events on other planets can be used for comparative studies with terrestrial effects to provide valuable insights into the general principles.
During September 2017, an active region of the Sun was facing Mars that projected several medium (M) and extreme (X) classflares and a coronal mass ejection (CME). Enhanced solar irradiance and solar energetic charged particles (SEPs) were measured throughout the time of the planet’s alignment with the active region (Chamberlin et al., 2018; Lee et al., 2018; Thiemann et al., 2018). Effects of this strong space weather event were observed by instruments on orbiting spacecraft such as Mars Express and the Mars Atmosphere and Volatile EvolutioN (MAVEN) mission as well as on the surface by the Mars Science Laboratory (e.g., Ehresmann et al., 2018; Lee et al., 2018).
Effects of solar weather events at Mars have been previously reported. For example, ionospheric plasma enhancements were observed and simulated using radio occultation observations (Fallows et al., 2015; Lollo et al., 2012; Mendillo et al., 2006). Atmospheric temperature enhancements followed enhanced solar UV emissions from M- and X-classflares within hours of their reaching the Martian atmosphere (Thiemann et al., 2015). A strong CME event can increase the loss rate of heavy ions from the planet (Futaana et al., 2008; Jakosky et al., 2015). In this report, the effects of the September 2017 solar weather event on the
RESEARCH LETTER
10.1029/2018GL077727
Special Section:
Impact of the Sept. 10, 2017, solar event on Mars
Key Points:
• September 2017 solar activity at Mars produced enhanced heating of the upper atmosphere on the dayside as well as the nightside
• Simulated dayside H densities decreased but Jeans escapeflux increased byfivefold due to the heating associated with this solar event
• Martian H density profiles above the homopause can be inferred using NGIMS and IUVS observations coupled to atmospheric and RT models
Supporting Information: • Supporting Information S1 Correspondence to: M. Mayyasi, majdm@bu.edu Citation:
Mayyasi, M., Bhattacharyya, D., Clarke, J., Catalano, A., Benna, M., Mahaffy, P., et al. (2018). Significant space weather impact on the escape of hydrogen from Mars. Geophysical Research Letters, 45, 8844–8852. https://doi.org/10.1029/ 2018GL077727
Received 28 FEB 2018 Accepted 1 MAY 2018
Accepted article online 9 MAY 2018 Published online 4 SEP 2018
©2018. American Geophysical Union. All Rights Reserved.
properties of hydrogen in the Martian upper atmosphere are examined, including changes in the escape of hydrogen into space with implications for the escape of water.
The solar storm occurred at a time when Mars was near aphelion, and when H Lyman-α emissions are expected to be at a seasonal minimum (Bhattacharyya et al., 2015; Chaffin et al., 2014; Clarke et al., 2014). During the September 2017 events, MAVEN observations of H Lyman-α were found to show atypical measurements closely correlated with the arrival of the CME and of increased UVflux. The MAVEN echelle detector recorded a threefold enhancement in background signal due to the impact of solar energetic particles from the CME. Coincident within these enhancements, the H brightness was seen to increase com-pared with neighboring periods. Interpreting these measurements involved data from multiple MAVEN instruments, and models for both the radiative transfer (RT) of H Lyman-α and for the upper atmospheric structure and composition.
2. Observations
2.1. Neutral Gas and Ion Mass Spectrometer
MAVEN Neutral Gas and Ion Mass Spectrometer (NGIMS) instrument measures neutral and ion composition in situ (Mahaffy et al., 2014). The neutral measurements made during the 2017 solar storm span 1 to 14 September. At the time of the observations, Mars was near aphelion (~58° Ls). MAVEN is in an orbit with
75° inclination; therefore, aside from variations in nadir longitudes as Mars rotates beneath the spacecraft, observational conditions such as altitude range, solar zenith angle (SZA), latitude, solar longitude (Ls), and local times do not vary significantly from orbit to orbit on timescales of a few days. For the outbound orbital segment, the SZA ranged between 66° and 69° and latitude ranged between 6° and 47° north. For the inbound segment of the NGIMS orbits, the SZA ranged between 69° and 85° and latitude ranged between 47° and 73° north. The altitude of the spacecraft reached ~155 km at periapse.
For consistency with the observing geometry of other instrument measurements used in this work, and to minimize the effects of measurement contamination intrinsic to outbound NGIMS observations, only the inbound orbit measurements from this instrument were used. The NGIMS CO2and Ar density profiles with
altitude were used to derive a scale height, Hs, defined as the altitude over which the number density of a species, s, decreases by 1/e. Hsis defined as kbTn/msg where kbis the Boltzmann constant, Tnis the neutral
temperature, msis the mass of the neutral species, and g is the gravitational acceleration at the altitude of the calculation. Determining Hsfrom the slope of the measurements and equating it to this formulation
pro-duces a value for neutral temperature at the altitude of the measurement, which is applicable to the upper atmospheric regions where other instruments also measure atomic H.
2.2. Imaging Ultraviolet Spectrograph
MAVEN Imaging Ultraviolet Spectrograph (IUVS) makes remote sensing measurements of species such as hydrogen (H) 121.567 nm, deuterium (D) 121.533 nm, and oxygen triplet 130.4 and 135.6 nm emissions (McClintock et al., 2015). The instrument operates in a high-resolution echelle mode, resolving H and D Lyman-α emission lines, and is calibrated at those wavelengths (Mayyasi et al., 2017). Echelle measurements with consistent observing geometry were used to study the effects of the September 2017 solar events on the Martian upper atmosphere. These observations were made between 27 August and 15 September. The inbound and outbound segments of the orbits spanning the storm event scanned different regions of the planet’s upper atmosphere. Only disk observations are used here to eliminate any contribution from interplanetary hydrogen emissions that appear when scanning the Martian limb or corona.
The echelle observations spanned various longitudes on Mars. Inbound segment observations were made on the dayside where the SZAs ranged between 88° ± 3° and 88° ± 7°, and latitude ranged between 60° and 70° south. The outbound segment observations were made on the nightside where the SZA ranged between 98° ± 2° and 113° ± 5°, and latitude between ~10° south and 30° north. Not enough same-hemisphere cover-age by all instruments was available, so the subsets of NGIMS and IUVS data with a similar range of dayside SZAs are directly used to interpret the observations while the nightside observations are shown for compar-ison only. Potential variations due to different hemispherical regions of the observations are discussed later. The echelle disk observations made during September 2017 include 20 images per orbit with spectra coadded to produce one emission line brightness. The IUVS observations were consistently reduced to
determine the H Lyman-α emission (Mayyasi et al., 2017). The image reduction process accounts for the enhanced background and noise levels that impacted the detector during a few orbits in these observations due to SEP events on the IUVS detector. The reduced data shown in this work reflect the effects of the solar storm on the H Lyman-α emission only, with the detector noise effects apparent in the uncertainty. Individual spectra were examined to confirm the legitimacy of the signal enhancement, separate from the detector noise (see the supporting information).
3. Models
3.1. Atmospheric Model
A neutral atmosphere, between 80 and 400 km altitude, is generated using a Mars Ionosphere Model (Matta, 2013). The simulated atmosphere assumes a bulk neutral density and volume mixing ratio of seven species at the lower boundary where the number density of each species is calculated and then propagated upward using diffusion (Krasnopolsky, 2002). The free parameters in the model are bulk density, mixing ratios at 80 km, and the neutral temperature at MAVEN periapse altitude.
The volume mixing ratios were determined from the Mars Climate Database and Viking Lander observa-tions for CO2, O, N2, CO, Ar, and H2 (e.g., Montmessin et al., 2004, and references therein; Matta et al., 2013). The bulk atmospheric density was modified to get the best fit between the simulated atmosphere and NGIMS observed neutral densities for all orbits and wasfixed at 1.1 × 10 12kg/cm3at the homopause (80 km). At the exobase altitude (~200 km), the temperature was derived from the NGIMS scale heights. The H mixing ratio was bestfit to match the exobase density at 200 km provided by the RT model for the temperatures derived from NGIMS for the H Lyman- α emission observed by IUVS, as discussed in the next sections.
During the 2017 solar event, NGIMS observations were made in the northern hemisphere while the IUVS line of sight (LOS) was pointed at the southern hemisphere. The volume mixing ratios are not expected to change with latitude; however, the bulk atmospheric density and thermospheric temperatures may be lower in the cooler southern hemisphere, which is approaching winter solstice than in the northern hemisphere, which is approaching summer solstice. Since no temporally overlapping geometries exist between the in situ and remote sensing observations, we assume that the temperatures and densities across the planet are latitude independent.
3.2. Radiative Transfer Model
The column of atmosphere observed in the exosphere of Mars is optically thick in H Lyman-α (Anderson, 1974). This means that the solar Lyman-α photons along the instrument LOS undergo multiple scattering within the Martian H exosphere. An RT model that accounts for these multiple scattering effects is required to model observations of the Martian H Lyman-α emissions.
The RT model used for this work simulates the H atmosphere between 80 and 50,000 km. The simulation assumes that (1) the exobase isfixed at an altitude of 200 km, (2) the H exosphere is isothermal and spherically symmetric, (3) H atoms have a Maxwell-Boltzmann velocity distribution, (4) scattering processes conform to complete frequency redistribution, and (5) a narrow Gaussian-Dopplerian emission line is used, allowing for constant solar Lyman-α flux (at line center) for the entire width of the Martian line (Bhattacharyya et al., 2017). The solar Lyman-α flux at Mars is determined from observations of line integrated flux values at Earth recorded in the Solar Radiation and Climate Experiment (SORCE) database (Rottman et al., 2006), rotationally corrected for Mars’ location, and converted to line center flux using the empirical relation-ship derived by Emerich et al. (2005). Thesefluxes are consistent with Extreme Ultraviolet Monitor (EUVM) fluxes observed during the solar event to within 2% (Eparvier et al., 2015; Thiemann et al., 2018).
The two free parameters in the RT model are the exobase temperature and the exobase number density of H. In general, different combinations of these two parameters can be used to derive observed intensities along a particular LOS. Modeling constraints, uncertainties, and nonuniqueness of solutions have been discussed in detail in Bhattacharyya et al. (2017). In this paper, the exobase temperature of H is determined from the scale heights obtained from NGIMS observations of the neutral atmosphere, allowing for unique solutions of H exobase densities and thereby escapeflux.
4. Results
The NGIMS-derived temperature was similar for CO2and Ar, and their
average was used to represent neutral atmospheric temperature for each orbit. Observations from quiet time, postactive region preflare, and postflare affected orbits showed neutral temperatures of 206, 233, and 282 K, respectively. This is consistent with NGIMSfindings from ana-lyzing broader altitude regions during the solar event (Elrod et al., 2018). IUVS midultraviolet observations additionally observed similar tempera-ture enhancements consistent with this timeline (Jain et al., 2018). Since IUVS echelle, midultraviolet, and NGIMS observations are made for dif-ferent regions at Mars, and consistently report temperature enhance-ments, we adopt the following temperatures to further analyze IUVS echelle observations: 200 K for preactive-region (quiet) conditions, 230 K for postactive region and preflare (moderate) conditions, and 280 K for postflare (active) conditions.
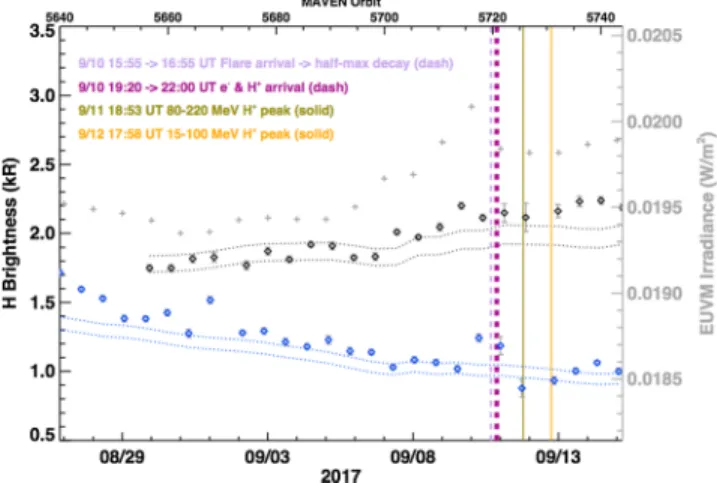
The observed H Lyman-α brightness along the disk of Mars during the time of the solar event is shown in Figure 1 along with the timeline of arrival and peak times of theflare and SEPs. Since H Lyman-α is pro-duced by solar resonant scattering, the integrated brightness of this emission line is expected to decrease, albeit nonlinearly, with increasing SZA as the LOS from the instrument to the atmosphere of Mars gets pro-gressively less illuminated by solar photons. For the observed ranges of SZA, the H Lyman-α brightness trend for inbound observations is expected to vary minimally, as indicated by the black and blue dotted lines in Figure 1. The black dotted lines show the simulated brightness for H Lyman-α solely from changes in the inbound orbit segment obser-vational geometry assuming a prestorm temperature of 200 K, a single thermal population of H atoms, spherical symmetry, and a solar Lyman-α flux consistent with SORCE and EUVM data. The blue dotted lines show similar modeled values for the outbound segment and indi-cate a trend of steadily decreasing brightness with time. The upper and lower dotted lines for each orbital segment are the upper and lower lim-its of the RT model estimates. This suggests that if the atmosphere of Mars did not undergo any intrinsic changes due to the solarflare event, the observed H Lyman-α emission for the inbound and outbound segments should then follow similar trends to the blue and black dotted lines, respectively. A bright outbound emission on 3 September is observed that is not associated with an EUVM recordedflare or energetic particle influx. This observation occurs on the nightside where the column of H along the LOS is only partially illuminated. It may be that this sunlit portion of the atmosphere experienced heating from the active region or that there was a remoteflare impact that was not detected by the in situ instrument on board the spacecraft.
Separate echelle observations at different times of the H Lyman-α brightness made during quiet Sun condi-tions along the disk of Mars show similar trends with SZA as the model prediccondi-tions. The H Lyman-α emissions during and poststorm event of September 2017 are brighter than the expected trends. It is clear that the active solar region and CME of September 2017 affected H Lyman-α emission brightness. The enhanced Lyman-α brightness, seen by IUVS at different regions of the planet, along with the simultaneous enhanced temperatures observed by NGIMS, shows consistent and global evidence of an upper atmospheric response to the solar storm event.
The dayside observation brightness (inbound, black diamonds) is generally constant with a mean of ~1.8 kR before orbit 5700, and then increases steadily,fluctuating about ~2.2 kR after orbit 5714. On the nightside (outbound observations), the H Lyman-α brightness decreases steadily until orbit 5718, where a spike in brightness lasting through orbit 5722 is seen, followed by an increasing then decreasing trend in brightness, identical to that of the inbound observations for similar orbits. No additional echelle observations of the disk were made within several weeks of the last orbit (5744) shown in Figure 1.
Figure 1. IUVS echelle observations of hydrogen Lyman-α along the inbound disk segment (black diamonds) and outbound disk segment (blue diamonds) with measurement uncertainties (grey vertical error bars) span-ning late August through mid-September, 2017. These data points reference the y axis on the left. Timing and duration of solar events of interest to this period are shown in vertical lines for reference. The 10 Septemberflare event onset, peak, and half-max decay occur at the violet dashed line. The onset of solar energetic electrons, 15–100 MeV protons, and 80–220 MeV protons is indicated with a thick purple dashed line. The peak of high energy solar protons is shown in green. The peak of low energy solar protons is shown in yellow. The dotted pairs of black (blue) lines represent model estimates of brightness for the geometric conditions of the echelle observations made along the inbound(outbound) lines of sight, assuming a presolar storm exobase temperature of 200 K, a thermal only population of H atoms, and a spherically symmetric atmosphere with variable solar Lyman-α flux. The lower and upper dotted lines show the limits of the uncertainty in the model results. The uncertainty due to the noise level on the detector increases during orbits 5722 and 5726, following the arrival of SEPs. The H brightness trends are consistent with trends in solar irradiance. Daily averaged solar irradiance values from EUVM-based observations are shown for this time period as grey crosses and follow the scale on the right y axis. These are integrated over ionizing wavelengths, thereby providing a metric for upper atmospheric heating.
EUVM-based daily-averaged solar irradiance, integrated between 0 and 190 nm, are shown in Figure 1 for comparison. The trends in increasing irradiance, due to the solar active region rotating toward Mars, followed by theflare and CME, are consistent with the trends of increasing dayside (inbound) H brightness. The H Lyman-α emis-sions observed on the nightside (outbound) between orbits 5640 and 5668 are, on average, brighter than expected model trends. This variability in brightness may be attributed to the higher solar ionizing radiation received at the upper most altitudes of the Martian atmo-sphere, along the instrument LOS, while the atmosphere at lower alti-tudes was not sunlit.
The dayside observations show an enhanced brightness of the inbound disk observations beginning at orbit 5714 that are absent from the night-side outbound observations, likely due to enhanced EUV ioniza-tion from the solar active region facing Mars. Enhanced ionizaioniza-tion causes subsequent dayside atmospheric heating that directly increases the brightness of H Lyman-α. The X-class flare peak did not overlap with any echelle observations but was closest to outbound orbit 5718. The spike in brightness observed for that orbit may be due to residual ing from the near terminator atmosphere, or due to the enhanced heat-ing from approachheat-ing solar wind particles that impacted the planet at various local times. There are no nightside NGIMS observations during this time period that can be used to constrain the temperature enhance-ments in the outbound echelle observations.
The solar Lyman-α flux during the solar events was enhanced by ~6% (Thiemann et al., 2018). The brightness of Martian Lyman-α observed in both inbound and outbound segments of orbit 5722 was enhanced above the modeled trend. Subsequent inbound observations remained brighter than preactive-region observations. This is also likely due to the enhanced temperature of the neutral atmosphere as well as the additional energy deposited by solar wind energetic particles into the upper atmosphere. NGIMS observations showed dayside tempera-ture enhancements throughout the time that Mars saw the solar active region (230 K) as well as after theflare (280 K). Echelle observations of orbits 5722 and 5726 showed larger uncertainties attributed to the SEPs that impacted the echelle detector, elevating the background sig-nal and the detector noise.
The brightness of H Lyman-α will increase when the number of H atoms along the LOS increases and/or the temperature of the H atoms increases thus broadening the spectral line. In the narrow timeframe (days) of the solar event observations, no mechanism is expected to enhance the flux of H atoms from lower altitudes, especially since Mars is close to aphelion with little dust storm activity (Chaffin et al., 2017; Heavens et al., 2018). The neutral temperature enhancement followingflares has a much shorter timescale (hours) (Thiemann et al., 2015) and is therefore the most plau-sible driver of the observed brightness enhancement. In any event, this assumption can be tested in the MAVEN data.
The atmospheric model was used to generate a neutral atmosphere by constraining the temperature in the upper atmosphere as well as the CO2and Ar densities to NGIMS-derived values. The resulting atmospheres are shown in Figure 2 for the low and high neutral temperature cases of 200 and 280 K. We note that H den-sity profiles were adjusted after iteration with the RT model results obtained from IUVS observations for the solar quiet case (preactive region, at 200 K exobase temperature).
Figure 2. Modeled neutral atmosphere derived using neutral temperature from NGIMS scale heights and constrained to NGIMS densities of CO2and
Ar. The densities as a function of altitude are generated for the following species: O (red), CO2(green), N2(blue), CO (grey), H2(purple), H (light blue)
after coupling to the RT model, and Ar (pink). The neutral temperature profile, Tn, is shown in black with a scale on the top x axis. The black circles
show 2 km averaged NGIMS-observed CO2and Ar measurements for
comparison. A black bar near the H density profile at 200 km indicates the range of H density values at the exobase generated by the RT model for the two cases shown here for (top) active region atmosphere and (bottom) post flare atmosphere.
The resulting atmosphere (excluding H) was coupled to the RT model to simulate the H densities that would produce the echelle-observed brightness values along the instrument lines of sight. The H density derived by the RT model for the 200 K neutral atmosphere case was then used to constrain the H mixing ratio in the atmospheric model (that remainedfixed for the other two temperature scenarios) and produced consistent exobase densities with simulated values for the postactive-region preflare (230 K) and postflare (280 K) temperature scenarios. H densities at the exobase are shown in Table 1 and discussed in the next section. These results support the assumption of relatively little change in exobase H density, but a large change in temperature, to explain the H Lyman-α emission changes.
5. Discussion
Solar activity marked by enhanced solar irradiance,flares, and a CME impacted Mars during the first two weeks of September 2017 produced enhanced H Lyman-α emission brightness over the expected trend from observing geometry. Remote sensing and in situ measurements were used to interpret the observed trends in H brightness using coupled atmospheric and RT models. The latitudinal variation in the echelle observa-tions is ~10°, and the timescale of the solar event is days. Therefore, variaobserva-tions due to spherical asymmetry in the exosphere of Mars are assumed to be minimal (e.g., Clarke et al., 2014; Holmström, 2006).
The SZA ranges considered here for the individual orbits vary by less than 15°, and the closest possible SZA overlap between NGIMS and IUVS observations has been used in the analysis. The main expected tempera-ture variations are due to changing SZA. Temperatempera-ture values from NGIMS data at similar SZA were consistent with those observed by IUVS scale height measurements from lower latitude observations (Jain et al., 2018), and with NGIMS measurements at higher altitudes (Elrod et al., 2018). Both works showed higher than expected variations in upper atmospheric temperature due to the solar event.
At the spacecraft altitude for the echelle observations (between ~2,000 and 2,800 km above the planet), the H atoms emitting along the instrument LOS are a combination of thermal and fractional suprathermal popula-tions (Bhattacharyya et al., 2017). Disambiguating each population’s contribution to the observed H bright-ness enhancements by simulation requires constraining three of four unknown quantities (the exobase temperature and densities for each population). There is not enough observational information available for this period to make this separation. We assume a thermal only population that can be characterized by one temperature above the exobase, since this is the dominant population at lower altitudes; thus, the ther-mal population exobase density can be simulated and used to derive the escape rate of hydrogen. When the neutral temperature increases, heavy species (with masses greater than ~4 atomic mass units) in an atmosphere inflate. At some reference altitude above the homopause, the number density will increase with increasing temperature. Lighter species, such as H, will become less abundant with increasing temperatures. This is due to the frequent collisions they encounter with the more abundant heavier species that restrict their vertical diffusion (e.g., Krasnopolsky, 2002). The density of H at the exobase is therefore expected to decrease with increasing temperature. The atmospheric model indicated a 25% decrease in H density at the exobase due to enhanced temperatures from the solar event. The RT model yielded consistent and inde-pendent results for the decrease in H density with enhanced temperature, as shown in Table 1.
Using the derived H densities at the exobase, and the NGIMS-constrained temperatures, the Jeans escape rate for these observational conditions was derived, as listed in Table 1. The temperature derived for quiet conditions (200 K) was used to calculate the dayside H escape rate using the echelle inbound (dayside) obser-vations representative of quiet solar conditions. The temperature derived for active-region enhanced ioniza-tion condiioniza-tions (230 K) before theflare and CME arrival was used to calculate the dayside H escape rate using the echelle observations between quiet conditions and before the solar storm. The temperature derived from postflare/SEP arrival (280 K) was used to calculate the dayside H escape rate using the echelle observations after the storm onset.
The escape rate of H from Mars increased by nearly a factor of 5 from ~4 × 10⁷to 20 × 107atoms · cm 2· s 1. Hubble Space Telescope observations have shown the Martian H escapeflux to vary seasonally due to the
Table 1
Variability of Dayside H Escape Flux During the September 2017 Solar Storm
Date in 2017 Tn(K) at exobase H density (cm 3) at exobase H escapeflux (atoms · cm 2· s 1) 31 August 200 1.2 ± 0.1 × 10⁵ 3.9 ± 0.4 × 10⁷ 8 September 230 1.1 ± 0.1 × 10⁵ 8.2 ± 0.7 × 10⁷ 10 September 280 0.9 ± 0.2 × 10⁵ 20 ± 4.0 × 10⁷
cyclical enhancement of H densities and temperatures throughout Mars’ orbit (Bhattacharyya et al., 2015). The seasonal enhancement of escapeflux was estimated to reach, on average, a factor of 5 between the aphelion and perihelion extrema of seasonal loss. The dayside H escape rate due to the September 2017 solar storm at Mars, while short-lasting, increased by amounts comparable to the seasonal escape rate over a full Martian year. This increase was short-lived, on the order of days. On longer timescales the escapeflux of H would be expected to decrease, even in the presence of continuing elevated temperatures, since the longer-term escape rate is limited by theflux of H atoms from the lower atmosphere needed to replace the escaping ones. This conclusion is supported by the small decrease in H density during the period of enhanced temperatures.
No echelle observations of the disk were made until two weeks after the end of the timeline in Figure 1, mak-ing a timescale for the solar-weather enhancedflux difficult to constrain. On 13 September, the NGIMS-derived neutral temperature at the exobase was still in its solar active-region range of 230 K, and the EUVM instrument integrated daily-averagedflux was similar to postactive-region preflare conditions. For these conditions, the 13 September simulated H exobase density was 1.5 ± 0.2 × 105cm 3, resulting in a Jeans escape rate of 12 ± 1.4 × 10⁷atoms · cm 2· s 1.
The dayside H exobase density uncertainties were≤20%. Nightside echelle observations were not supported by simultaneous nightside NGIMS observations of neutral atmosphere. The nonuniqueness of model solu-tions for these nightside condisolu-tions becomes restrictive. If we assume a nightside temperature spike from 180 to 200 K at the exobase for preflare and postflare conditions, respectively, as well as a similar bulk atmo-spheric density at the homopause and mixing ratios as the dayside, then resulting H exobase density increases from 2.93 ± 0.43 × 105 cm 3 to 3.44 ± 1.13 × 105 cm 3. The resulting escape rate is 4.4 × 10⁷atoms · cm 2· s 1and 11.1 × 10⁷atoms · cm 2· s 1, respectively. However, with the large model uncertainties in H exobase densities (up to ~60%), and with no constraints on the nightside temperature dur-ing the storm, we refrain from interpretdur-ing these estimated night-side escapefluxes.
The MAVEN mission was designed to investigate atmospheric escape from Mars (Jakosky, 2015). Since the arrival of MAVEN at Mars, three prior major solar storms had been recorded. These occurred during December 2014, March 2015, and July 2017. Insufficient echelle observations were available during those times. The September 2017 event offered thefirst opportunity where IUVS echelle observations were avail-able with simultaneous NGIMS, EUV,M and Solar Energetic Particle (Larson et al., 2015) instrument measure-ments that coincided with a major Martian solar storm. The significant enhancement in H escape flux was observed for thefirst time at Mars on such a relatively short timescale (few days).
The NGIMS in situ and echelle remote sensing measurements were made over different hemispherical regions and local times at Mars, but at a similar range of SZAs. NGIMS outbound observations were made in the northern hemisphere (6° to 47° latitude), echelle inbound observations were made in the southern hemisphere ( 60° to 70° latitude), and echelle outbound observations were made in the northern equator-ial region (10° to 30° latitude) at different local times. The data sets from these three observations each indi-cated an enhancement in upper atmospheric properties that were triggered by the solar storm event of September 2017, indicating that the upper atmosphere of Mars exhibited a global response to this series of solar events.
6. Conclusions
The solar event of September 2017 impacted the planet on a global scale through heating deposition of enhanced UVflux and heating from the solar active region as well as energetic particles on both the dayside and nightside of Mars. The timescale for the recorded effects on H Lyman-α brightness enhancements was consistent with that of the active region-enhanced solarflux and SEP arrival.
The in situ observations of neutral density profiles, measured during the solar storm, indicated that tempera-tures above spacecraft periapse increased by nearly 75 K at peak atmospheric perturbation. The remotely sensed Lyman-α emission observations consistently showed unexpected variations in the properties of the upper atmosphere of Mars. The measurements show a 20% enhancement in brightness during this time and a modeled 25% decrease in H density at the exobase. Subsequent simulations using the NGIMS-measured temperature enhancements validated the increase in H Lyman-α brightness due to temperature
enhancements in the atmosphere of Mars, with little change in H density. As a result of the solar storm, the H escapeflux was enhanced and quantified on the dayside to increase by fivefold that may be from thermal and/or suprathermal hydrogen atoms. This enhancement is comparable to the longer duration seasonal var-iation in H escapeflux from Mars, although much shorter lasting.
The statistical likelihood of strong solar events impacting Mars ought to be factored in with the seasonal variability of H escape to more accurately calculate the escape rate of a key hydrogenated species. This improvement will be crucial for derivations of water content on primordial Mars.
References
Anderson, D. E. (1974). Mariner 6, 7 and 9 ultraviolet spectrometer experiment: Analysis of hydrogen Lyman alpha data. Journal of Geophysical Research, 79(10), 1513–1518. https://doi.org/10.1029/JA079i010p01513
Bhattacharyya, D., Clarke, J., Bertaux, J.-L., Chaufray, J.-Y., & Mayyasi, M. (2017). Analysis and modeling of remote observations of the Martian hydrogen exosphere. Icarus, 281, 264–280. https://doi.org/10.1016/j.icarus.2016.08.034
Bhattacharyya, D., Clarke, J. T., Bertaux, J.-L., Chaufray, J.-Y., & Mayyasi, M. (2015). A strong seasonal dependence in the Martian hydrogen exosphere. Geophysical Research Letters, 42, 8678–8685. https://doi.org/10.1002/2015GL065804
Chaffin, M., Chaufray, J.-Y., Stewart, I., Montmessin, F., Schneider, N. M., & Bertaux, J.-L. (2014). Unexpected variability of Martian hydrogen escape. Geophysical Research Letters, 41, 314–320. https://doi.org/10.1002/2013GL058578
Chaffin, M., Deighan, J., Schneider, N., & Stewart, I. (2017). Elevated atmospheric escape of atomic hydrogen from Mars induced by high-altitude water. Nature Geoscience, 10(3), 174–178. https://doi.org/10.1038/NGEO2887
Chamberlin, P., Woods, T., Didkovsky, L., Eparvier, F., Jones, A., Mason, J., et al. (2018). Solar ultraviolet irradiance observations of the solar flares during the intense September 2017 strom period. Space Weather, 16. https://doi.org/10.1029/2018SW001866
Clarke, J. T., Bertaux, J.-L., Chaufray, J.-Y., Gladstone, G. R., Quemerais, E., Wilson, J. K., & Bhattacharyya, D. (2014). A rapid decrease of the hydrogen corona of Mars. Geophysical Research Letters, 41, 8013–8020. https://doi.org/10.1002/2014GL061803
Ehresmann, B., Hassler, D. M., Zeitlin, C., Guo, J., Wimmer-Schweingruber, R. F., Matthiä, D., et al. (2018). Energetic Particle Radiation Environment Observed by RAD on the Surface of Mars during the September 2017 Event. Geophysical Research Letters, 45. https://doi.org/ 10.1029/2018GL077801
Elrod, M., Curry, S., Thiemann, E., & Jain, S. (2018). September 2017 solarflare event: Rapid heating of the Martian neutral thermosphere from the X-classflare as observed by MAVEN, Geophysical Research Letters, https://doi.org/10.1029/2018GL077729
Emerich, C., Lemaire, P., Vial, J.-C., Curdt, W., Schühle, U., & Wilhelm, K. (2005). A new relation between the central spectral solar H I Lymanα irradiance and the line irradiance measured by SUMER/SOHO during the cycle 23. Icarus, 178(2), 429–433. https://doi.org/10.1016/ j.icarus.2005.05.002
Eparvier, F., Chamberlin, P., Woods, T., & Thiemann, E. (2015). The solar extreme ultraviolet monitor for MAVEN. Space Science Reviews, 195(1–4), 293–301. https://doi.org/10.1007/s11214-015-0195-2
Fallows, K., Withers, P., & Gonzalez, G. (2015). Response of the Mars ionosphere to solarflares: Analysis of MGS radio occultation data. Journal of Geophysical Research: Space Physics, 120, 9805–9825. https://doi.org/10.1002/2015JA021108
Futaana, Y., Barabash, S., Yamauchi, M., McKenna-Lawlor, S., Lundin, R., Luhmann, J. G., et al. (2008). Mars Express and Venus Express multi-point observations of geoeffective solarflare events in December 2006. Planetary and Space Science, 56(6), 873–880. https://doi.org/ 10.1016/j.pss.007310.014
Gray, L. J., Beer, J., Geller, M., Haigh, J. D., Lockwood, M., Matthes, K., et al. (2010). Solar influences on climate. Reviews of Geophysics, 48, RG4001. https://doi.org/10.1029/2009RG000282
Heavens, N., Kleinböhl, A., Chaffin, M., Halekas, J., Kass, D., Hayne, P., et al. (2018). Hydrogen escape from Mars enhanced by deep convection in dust storms. Nature Astronomy, 2(2), 126–132. https://doi.org/10.1038/s41550-017-0353-4
Holmström, M. (2006). Asymmetries in Mars’ exosphere. Space Science Reviews, 126(1–4), 435–445. https://doi.org/10.1007/s11214-006-9036-7 Jain, S., Deighan, J., Schneider, N. M., Stewart, A. I. F., Evans, J. S., Thiemann, E. M. B., et al. (2018). Martian thermospheric response to an X8.2 solar flare on 10 September 2017 as seen by MAVEN/IUVS, Geophysical Research Letters, 45, 7312–7319, https://doi.org/10.1029/2017GL077731 Jakosky, B. (2015). MAVEN explores the Martian upper atmosphere. Science, 350(6261), 643. https://doi.org/10.1126/
science.aad3443
Jakosky, B. M., Grebowsky, J. M., Luhmann, J. G., Connerney, J., Eparvier, F., Ergun, R., et al. (2015). MAVEN observations of the response of Mars to an interplanetary coronal mass ejection. Science, 350(6261), aad0210. https://doi.org/10.1126/science.aad0210
Krasnopolsky, V. A. (2002). Mars’ upper atmosphere and ionosphere at low, medium, and high solar activities: Implications for evolution of water. Journal of Geophysical Research, 107(E12), 5128. https://doi.org/10.1029/2001JE001809
Larson, D., Lillis, R., Lee, C., Dunn, P., Hatch, K., Robinson, M., et al. (2015). The MAVEN solar energetic particle investigation. Space Science Reviews, 195(1–4), 153–172. https://doi.org/10.1007/s11214-015-0218-z
Lee, C. O., Jakosky, B. M., Luhmann, J. G., Brain, D. A., Mays, M. L., Hassler, D. M., et al. (2018). Observations and impacts of the 10 September 2017 solar events at Mars: An overview and synthesis of the initial results. Geophysical Research Letters, https://doi.org/10.1029/2018GL079162 Lollo, A., Withers, P., Fallows, K., Girazian, Z., Matta, M., & Chamberlin, P. C. (2012). Numerical simulations of the ionosphere of Mars during a
solarflare. Journal of Geophysical Research, 117, A05314. https://doi.org/10.1029/2011JA017399
Mahaffy, P. R., Benna, M., King, T., Harpold, D. N., Arvey, R., Barciniak, M., et al. (2014). The neutral gas and ion mass spectrometer on the Mars atmosphere and volatile evolution mission. Space Science Reviews, 195(1-4), 49–73. https://doi.org/10.1007/s11214-014-0091-1 Matta, M. (2013). Modeling the Martian Ionosphere, (PhD). Boston University, Boston, MA.
Matta, M., Withers, P., & Mendillo, M. (2013). The composition of Mars’ topside ionosphere: Effects of hydrogen. Journal of Geophysical Research: Space Physics, 118, 2681–2693. https://doi.org/10.1002/jgra.50104
Mayyasi, M., Clarke, J., Quémerais, E., Katushkina, O., Bhattacharyya, D., Chaufray, J. Y., et al. (2017). IUVS echelle-mode observations of interplanetary hydrogen: Standard for calibration and reference for cavity variations between Earth and Mars during MAVEN cruise. Journal of Geophysical Research: Space Physics, 122, 2089–2105. https://doi.org/10.1002/2016JA023466
McClintock, W., Schneider, N. M., Holsclaw, G. M., Clarke, J. T., Hoskins, A. C., Stewart, I., et al. (2015). The Imaging Ultraviolet Spectrograph (IUVS) for the MAVEN mission. Space Science Reviews, 195(1–4), 75–124. https://doi.org/10.1007/s11214-014-0098-7
Acknowledgments
M. M. would like to thank the reviewers for their helpful comments and sug-gestions. This work was supported, in part, by NASA grant 80NSSC18K0266 and NASA contract 1000320450 from the University of Colorado to Boston University. MAVEN data are available on the NASA Planetary Data System at http://atmos.nmsu.edu/data_and_ser-vices/atmospheres_data/MAVEN/calib. html. The methodology required to reproduce the atmospheric model results is described in Matta (2013).
Mendillo, M., Withers, P., Hinson, D., Rishbeth, H., & Reinisch, B. (2006). Effects of solarflares on the ionosphere of Mars. Science, 311(5764), 1135–1138. https://doi.org/10.1126/science.1122099
Montmessin, F., Forget, F., Rannou, P., Cabane, M., & Haberle, R. M. (2004). Origin and role of water ice clouds in the Martian water cycle as inferred from a general circulation model. Journal of Geophysical Research, 109, E10004. https://doi.org/10.1029/2004JE002284 National Academies of Sciences, Engineering, and Medicine (2017). Report series: Committee on solar and space physics: Heliophysics Science
Centers. Washington, DC: The National Academies Press. https://doi.org/10.17226/24803
Rottman, G. J., Thomas, N. W., & McClintock, W. (2006). SORCE solar UV irradiance results. Advances in Space Science, 37(2), 201–208. https:// doi.org/10.1016/j.asr.2005.02.072
Thiemann, E. M. B., Andersson, L., Lillis, R., Withers, P., Xu, S., Elrod, M., et al. (2018). The Mars Topside Ionosphere Response to the X8.2 Solar Flare of 10 September 2017. Geophysical Research Letters, 45. https://doi.org/10.1029/2018GL077730
Thiemann, E. M. B., Eparvier, F. G., Andersson, L. A., Fowler, C. M., Peterson, W. K., Mahaffy, P. R., et al. (2015). Neutral density response to solar flares at Mars. Geophysical Research Letters, 42, 8986–8992. https://doi.org/10.1002/2015GL066334