Domestic Migration Networks in the United States
by
Robert Allen Manduca
B.A., Swarthmore College (2010)
Submitted to the Department of Urban Studies and Planning
in partial fulfillment of the requirements for the degree of
Master in City Planning
at the
\ASSACHUSETTS
INSTITUTE OF TECHNOLOGY
June 2014
A:A() HUSEZTTS INSTITUTE
ihc."*4OLOGY
JUN 19 2014
IBRARIES
@
Robert Allen Manduca. MMXIV. All rights reserved.
The author hereby grants to MIT permission to reproduce and to
distribute publicly paper and electronic copies of this thesis document
in whole or in part in any medium now known or hereafter created.
Author .
Signature redacted
Department of Urban Studies and Planning
May
22. 2014
C
ySignature
redacted
Accepted by ...
Albert Saiz
Associate Professor
Ahesis SupervisorSignature redacted
-P. Viristopher Zegras
Associate Professor
Chair, MCP Committee
~\a 201Domestic Migration Networks in the United States
by
Robert Allen M
kanduca
Submitted to the Department of Urbain Studies and Planning
on May 22, 2014, in partial fulfillment of the requirenents for the degree of
Master in City Planning
Abstract
In recent years, there has been substantial interest in understanding urban systems at the national and global scales: what are the economic and social ties that link cities together, and what is the netw o)rk structure formed by such ties? At the saime time, human capital accumulation is increasingly seen as a, primary driver of regional ec()nomic growth. Doimnestic migration patterns have the potential to illuminate the social and economlic connections among cities, while also highlighting economi( ally significant fows of111 human capital.
In this thesis I examine the US city system through the lens of gross migrat ion flows, taking advantage of unusually complete data on county-to-county migration cornpiled annually by the IRS. I compare the observed flows to those predicted] by the raliation model. finling most notably that there are far more lo ng-distance migrants than would be predicted based on the spatial (listribution of population alone. I then use reciprocal migration patterns to construct a migration network connecting metro areas in the United States. I utilize current-flow centrality measures to identifv the most prolinent nodes in this wvveighted network. Additionally, I use repeated applications of the Louvain community detection algoritmin to identify reasonably robust communities within the migration network. These exhibit a striking degree of
spatial contiguity.
Thesis Supervisor: Albert Saiz Title: Associate Professor
Acknowledgments
The seeds of tis thesis wvere planted more than flour Years ago, when I first encoin-tered the bloggings of Aaro )n Renn. At the t ime, the idea of st udying these 4opics in
earnest -at MIT no less--seeied fanciful.
After two years here, all I can say is that iny experience has exceeded all possible expect at ions. A number of people have contributed to making that the case. Foremost among these are my classmates: I wouldn't have thought it possible to feel so close
to so many people I find so impressive.
'A" advisor, Albert Saiz, has been a consistent source of guidance on everything from the specifics of this thesis to what I should do with mv life. He was invaluable in helping roe to craft a curriculum in quaintitative social science at D SP.
Mv thesis reader, Mart a Gonzalez, has been a tremendous source of enthusiasm
and met hodological insight 4throughout this process. I am grateful to her for being so willing to embra(ce a stlludent from urban planning.
Xavier de Souza Briggs and Joe Ferreira have hoth been foundationail to my expe-rience at DUSI and (onversat ions with them have criticallv informed my academic
and c'areer trajector .
A number of pr)fessors across the Inst itute--Am Glasmeier, PIhil Clay. Phil
Thompson, Karl Seidman, Cesar Hidalgo, Fiona Murrav. and Eran Ben-Joseph,
among others--have opened my mind and profoundly shaped my worldview. I was
expecting MIT professors to be brilliant, but I was not expecting them to be such outstanding teachers.
A big shout out to all of the staff at DUSP. Ezra Glenn has enriched my experi-ence immensely thbrough his boundless creativity, energ, and wisdon. Kirsten Greco
kept me on track to graduate by\ cheerfully answering countless inquiries about d1-partmental minutiae, and Janine Marchese was admirably sanguine about processing a similar number of reimbursement request s.
My part ner Roseanna cont inues to challenge me it ellectuailv, guide me ethically, and support me emotionally. This probably wouldn't have beenl possible without her.
Finally, my family. ly sister Katie remains a ('onstant source of cheer in my life,
and a model of' how to face difficult situations witi courage and good humor. As for my mot her and father: the further I go in life the more I realize Just how much they
Contents
1 Introduction 9 2 Motivating Literature 11 2.1 Investigations of Migration . . . . 11 2.1 i )eterminants of Migration . . . . 11 2.1.2 (f Migrat fosequenees . . . . . . . . 132.2 HIu-liran Capita, So( ial Networks, aid E-onomi-ifl Development . . . . 1-4 2.2.1 Human C( pital and Econom (Groth . . . . 14
2.2.2 The lim)por1taCUE e of Social Networks in Cross-Regional Eeoiiomi A v it . . . . 14
2.8 Mapping and Analy zin tin Ur ban Sysem . . . .15
2.4 Themes and i)ireetion.... . . . .. . . . .. 16
3 Data Source and Preparation 17 3.1 Data Soure.. ... ... 17
3.2 D ata Prepar ion'r . . . .. 19
3.2.1 M etropolitan Areas . . . . 19
8.8 Net, Gross, and Reciproeal ligratin . . . . 19
4 Observed and Modeled Migration Patterns 23 1.1 Metropolitan Migration Rates . . . . 23
4.2 Inidividual Migrat ion Flows . . . . . . . . . . . . 26
4.3 The Radialiori Model . . . .. 27
1.3.1 Impleientation of the Radialion Model . . . . 29
4.4 Radiation Model Results . . . . 30
4.5 Patterns of Resi(ials . . . . 33
5 Centrality Analaysis of the Migration Network 37 5.1 Degree Centrality . . . . 37
5.2 Closeness Centrality . . . . 39
5.3 Betweenness Ceritiality . . . . 12
6 Detecting Communities in the Migration Network 45 6.1 Approach to Cormunity )eteetion . . . . 45
6.1.2 The Louvairi Algorithm . . . . 46
6.1.3 Initial Partitions . . . . 46
6.1.4 Repeated Louvain Runs . . . . 48
6.2 Community Roles of In(livi(lual Metro Areas . . . . 51
6.2.1 Extra-Community Degree . . . . 51
6.2.2 Cornmunity Diversity . . . . 52
6.2.3 Within-Community Role . . . . 55
7 Discussion, Limitations, and Further Research 59 7.1 Limitations of the Current Research . . . . 59
7.2 Further Research . . . . 60
Chapter 1
Introduction
The i 11ted States has long been l)articularly mobile society. Overwhelmingly de-scended from immigrants, Americarns don't seem to stay rooted to their place of birth
at the saime rate as residents of most other countries. On multiple occasions through-out the nation's history-the era of west ward expansion, the Great MiIigration, the rise
of the sun belt literally millions of Americans have uprooted their lives and moved
west, north, or south in search of i(h(es, opportunit. or simply better weather. Al-though internal migration has decreased in recent years. the US still has one of the highest rates of domestic migration in the world (Frey, 2009; Molloy, Smith, k Voz-niak, 2011). Moving across the country for college, a job, or just a change of scenery
is not iinnsua.
This propensity to migrate is of particular interest now because of the rising ((C011011 importance of human capital. Increasingly, the knowledge spillovers created by having iarge numbers of workers in the same industry chistered together are seen as a imaor driver of long-term econormic growth. If a significant fraction of that talent pool decides one day to leave, that may cast a shadow on the economic future of their region. Alternateiv, if a region can increase its share of the migration take it riay be able to improve its economic xellbeing. 1nder these cireunstances, understanding how people move around the country and what drives that movement becomes more than just a matter of intellectual curiousity. The economic vitality of cities and states
nav depend on it.
At the same time. in these days of ideological polarization and cultura1 fracturing,
migration flows offer a glimpse of the social lies that knit different parts of the coun-try together. People are most likely to move to places they are familiar with, and when they move they do not abandon all ties to their former home. A large exchange of migrants between two regions therefore is both an indicator of existing social con-nection between them and a harbinger of stronger linkages to come. Examining the
full set of migration ties offers the possibility of identifying relatively self-contained regions of the countries and the connecting cities that link them together.
This thesis explores domestic inigraiton in the United States with an eye toward
these two topics: human capital accumulation and social distance. Ut ilizing a large
and unusually complete dataset on county to county migration patterns from the IRS, I look at the migration flows around the US and the cities they connect. I
begin by simply observing the patterns of migration, and coiparing them to a model of what patterns might occur if there were no economic or cultural differentiation among cities. Finding that such a, model cannot explain the observed patterns, I
shift to examining the connections that they illuminate among cities. I find that
certain cities occupy particularly central poistions in the migration network, serving as hubs that connect otherwise separated parts of the country. Finally I investigate more formally the boundaries of these regions, using the data to articulate migration
regions within the country and investigating the roles played by different cities within
those regions.
The following section situates this analysis by providing an overview of previous
studies of migration, as well as research on the importance of human capital and social networks to economic growth. Chapter 3 discusses the data source used and the process of preparation. The ensuing three chapters describe my investigations in
detail, outlining the methods used for each and the results found. I conclude with a discussion of my findings, their limiations, and possibilities for further research.
Chapter 2
Motivating Literature
2.1
Investigations of Migration
N1odern study of (omestic migration is generally acknowledged to have begun wvith
Ravenstein's study( of nigration patterns in nineteenth century Britain (Ravenstein.
1885). He formulated seven laws of migration, among- them that most igibrants tend
to move relatively short distances, that a flow of iglrants in one direction produces a countervailing fhw ill the other direction, and that loiig-distace nigrniIants tend to
mnove to major cities.
Since then. scholarship on domestic migration has proliferated in a diverse array of
approaches, theories, and methods. The majority of work has attemripted to determine
the determinants of migration, at both the individual and aggregate levels. What kinds of people inigrate, and why do they go where they do? A second, smnaller branch
of research has mattempted to address the consequences of migration for niigrants and
the places they encounter.
2.1.1
Determinants of Migration
At the ind1ividual level, migration has been widely conceptualized as a human capital investment. This was first proposed by Sjaastad (Sjaastad, 1962) and is widely used t(day. A person is hypothesized to migrate if the expected benefits to doing so, in terms of increased wages or improved access to amenities, exceed the costs of the move. The imrportance of wage increases has figured most, prominently in the literature (Yezer k Thurston, 1976; Kennan & Walker, 2011), although there does appear to be an initial period of wage decline folkowing a move (Grant K. Vanderkamp, 1980; Borjas, Bronars, & Trejo, 1992). Some evidence has suggested that factors other than employment prospects may in fact be dominant in the majority of cases (Morrison & Clark, 2011)., or that the relative importance of employment and amenity factors may vary over the lifecycle (Chen k& Rosenthal, 2008). Scholarship on demographic
characteristics ailn migration has found that the propensity to migrate tends to peak in the 20s and 30s. and that the overall national migration rate has risen and fallen
on the hacks of generations (Plane &T Rogerson, 1991; Plane, 1993). Migration rates
2001), and specifically, educated workers have been shown to be more likely to move long distances to areas with better employment prospects (Wozniak, 2010).
Early economic analyses of migration at the regional level viewed it largely as a means by which regional differences in wages and unemployment were equilibrated (Courchene, 1970; Vanderkamp, 1971). If wages in one part of the country were especially high, more people would migrate there until the labor supply increased enough to bring wages down.
In the 1980s, an alterative view was proposed that argued that wage differentials across regions are not evidence of a lack of equilibrium, but rather are compensating for differences in amenities between locations, most notably due to climate (Graves,
1980; Graves & Knapp, 1988). In this view interregional migration is not a response
to disequilibrium in labor markets but rather reflects changing preferences for the various consumption baskets offered by different cities. It is worth noting that the equilibrium and disequilibrium approaches are not entirely contradictory-both almost certainly operate at different points in time. Rather, the question is whether regions are mostly in a state of equilibrium or one of disequilibrium. The equilibrium approach also emphasizes the need to control for amenities in the destination region in addition to economic variables, since high wages can be considered compensation for a less appealing set of amenities (Hunt, 1993). However, both frameworks are called into question by recent work by Kemeny and Storper that documents sustained regional
disparities in both wages and amenities (Kemeny & Storper, 2012).
Models of migration at the regional level in both the disequilibrium and the equi-librium framework generally model gross or net flows between regions as a function of distance and of conditions at the origin and destination regions. Common explana-tory variables include per capita income, unemployment rates, tax levels, measures of government expenditures, and climatological variables (Schachter &T Althaus, 1989; Treyz, Rickman, Hunt, &- Greenwood, 1993).
One possibility that has not received extensive amounts of study is that there may be a role for path-dependency in domestic migration. In international migration, the phenomenon of "chain migration" is frequently observed: the first few migrants to a new country will settle in a given city essentially at random-sometimes almost literally, as the government decides where to settle refugees. However, once a few migrants are established there is a great tendency for further migrants from that country to settle in the same place. The original settlers can assist newcomers in adjusting to the new country, and can provide information about opportunities in their new surroundings to acquaintances back home (Elsner, Narciso, & Thijssen,
2013; Massey, 1988).
Although the cultural differences in internal migration tend not to be as stark as those involved in international migration, there is still room for information spread through social networks to make a substantial difference in the decisions of migrants. One attempt to model internal migration flows found that migration patterns in
1970 were a better predictor of migration in 2000 than both gravity models and
models based on other forms of connectivity such as air traffic (Andris, Halverson, & Hardisty, 2011). Unfortunately this study was unable to conduct a. comparison with a fully specified econometric model including all of the variables described above.
2.1.2 Consequences of Migration
Research on the regional impacts of internal nigration has been less subst antial than that on its determinants. It is relatively difficult to miake causal inference about
the economic impacts of migration into a region, and there have been few attempts.
A larger number of studies have looked at the demographic impacts of doriestic migration in terms of the net population change to a region or changes in the relative size of different demographic groups. Overall net domestic migration is frequently
used as an ind(Pator of regional economic health in the popular media (Kotkin, 2012), despite having systematic biases as a statistic (Rogers, 1990).
It has been docunented that regions that receive large numbers of immigrants have tended to have substantial net domestic outmigration, especia llv of low-skilled
workers (Frey, 1994: Borjas, 2006). Beginning in the 1990s., this prompted concerns
about "demographic Balkanization," in which different regions of the country would become increasingly culturallv and ethnically dist inct, dividing the country spatially
along racial, class, and ideological lines (Frey, 1995, 1996; Wrioht, Ellis, [Reibel,
1997).
One consequence of migration that has attracted a great deal of concern from
plolicymnakers, especially in rural or economically distressed areas, is that of "brain
drain." In the domestic context, this is the net out-migration of a region's young, college-educated workers. Due to the importance of human capital in stimulating eco-nomic growth (see below), the prospect of college graduates leaving town is frequently viewed with alarm by policymakers, and many states and cities have implemented re-tention programs for their students, offering financial incentives to attend college in the state or to remain after graduation.
Brain drain almost certainly does occur, in the sense that universitv graduates are extremely mobile and many do move away after graduation (Hansen, Ban, & Huggins,
2003; Sanderson & Dugoni, 2002; McGuire, Hardy-Johnston, &K Saevig, 2006; Stricker,
2007). However, several studies have found a simall but existent relationship between
the location of a school arid the region where its graduates end up (Bound, Groen,
K6zdi, k Turner, 2004; Groen, 2004: Gottlieb & Joseph, 2006). Further, 20-29 year
olds nationally are the only age group with a strong net tendency to move into large cities, moves that are balanced out by older residents leaving (Plane., Henrie, & Perry,
2005). This suggests that the proper way for municipalities to approach brain drain
may be to acknowledge that young educated workers are likely to move to a major city as a natural part, of their life course, note that, attending college in an area in fact makes them more likely to end up there than if they had gone to a different school, and perhaps focus on attracting their parents.
2.2
Human Capital, Social Networks, and Economic
Development
2.2.1
Human Capital and Economic Growth
Studies of migration have gained renewed relevance in recent years with the increasing emphasis given to the role of human capita] in economic development. Knowledge spillovers stemming from the concentration of human capital are seen as one of the primary mechanisms driving endogenous growth (Lucas, 1988; Romer, 1990). Cities with high levels of human capital have been shown to grow more quickly than those with lower levels, perhaps because they are more able to adapt to negative economic shocks (Glaeser, Scheinkman, & Shleifer, 1995; Glaeser k Saiz, 2003; Black &
Hender-son, 1999; Gottlieb k Fogarty, 2003). This evidence has put a premium on high-skilled
workers, and urban policymakers have been encouraged to pursue growxth strategies that attempt to accumulate human capital (Mathur, 1999).
The role of urban amenities in particular has received a, great deal of attention from both academic and popular sources. High-amenity cities have been shown to grow faster than those with few amenities (Glaeser, Kolko, & Saiz, 2001), and resi-dential amenities have been found to impact the location decisions of firms (Gottlieb,
1995). Focusing on high-skilled workers specifically, Richard Florida has found them
to be concentrated in areas with high levels of diversity as well as amenities (Florida, 2002). Whisler et al. suggest that different types of amenities are important to college-educated workers at different stages in the lifecycle, with young workers being attracted to areas with large numbers of cultural amenities while older workers are drawn to areas with low crime rates and mild climates (Whisler, Waldorf, Mulligan, & Plane, 2008).
It should be noted that there is still very much a debate in the literature about whether the causality described above-amenities attract, human capital which attracts companies-is in fact correct, or if the causality is more or less inverted: strong career prospects attract highly skilled workers to a region, who create a market for the amenities. Some economic geographers, most notably Michael Storper, argue for the latter scenario, claiming that firms at the forefront of innovation-driven sectors are able to secure excess profits, which attract highly skilled workers who are able to create the next round of innovations (Storper, 2010).
2.2.2
The Importance of Social Networks in Cross-Regional
Economic Activity
It is increasingly understood that economic activity is embedded in a network of social relationships (Granovetter, 1985). People and places occupying central positions in this network may be able to reap rewards unavailable to those on the periphery
(Borondo, Borondo, Rodriguez-Sickert, & Hidalgo, 2014). The importance of social networks to employment prospects in particular is evidenced by the proliferation of LinkedIn and the popularity of happy hours at conferences. But it was studied more
extensively by Mark Granovetter, who found that among white collar workers a large proportion come) to their jobs via leads from their social networks (Granovetter, 1973). Gr anovetter noted that most of these leads came from people the job seeker saw
relatively rarely. He suggests that these "weak ties" are extremely valuable, because they connect people who for the most part occupy different social circles and are thereftore exposed to different infornation and different opportunities. An individual with many weak ties will be able to draw on a, much larger and more complete body
of awareness about what is goin g on in the world.
Inter-regional I migrants are likely to have large numbers of these weak ties. In many cases they will leave a dense network of family and friends behind when they move, a group they feel a strong connection with but no longer see very frequently. In addition, they will create a new circle of social ties in their new home. 'They are thus very well poised to act as a bridge between their old friends and their new neighbors.
The economic impacts of such bridges on their home regions can be powerful. In the international context, entrepreneurs returning from Silicon Valley were instru-mental to the development of the Taiwanese tech industr. largely because they were
alble to use their connections to and knowledge of Silicon Valley to identify areas
where Taiwan co1k1d play a complementary role (Saxenian & Sabel, 2008). A similar pro('e'ss has played out in the emergence of Israel's tech industry (Senor & Singer. 2009). In fact, over the past two decades many countries have shifted from viewing their expatriates as a national embarrassment to seeing them as an important eco-nomic resource that allows the country to tap foreign markets and investors (Ga men.
2011; Kuznetsov, 2006).
Even the domestic context, social ties are important to the developrent of busi-nesses and industries. They are a primary mechanism 1y which innovations are dif-fused (Hagerst ra ind, 1966). Business owners tend to purchase from suppliers who they know, and investors wvii-1 be predisposed towards cities they are familiar with (Pred,
1977). All of this means that regions wvith high numbers of informal social links to
other, prosperous regions--at what has been termed a low "social distance" (Andris, 2011)- may be likely to prosper as well. Practitioners of economic development are in-creasingly less concerned with retaining residents than with attracting large volumnes of migrants from elsewhere, who bring with them new connections and ideas, keeping the Intellectual ecosystem of the city vital (Piiparinen K; Russell, 2013).
The literature on humman capital, economic developmenit, migration, an1d social ties
suggest s that migration flows may not be simply a result of' econoumic conditions in the affected regions. Rather, migration may also contribute to the economic development of both sending and receiving regions, whether by supplementing the human capil al
stock of the receiving region or by creating social links between the two.
2.3
Mapping and Analyzing the Urban System
A number of researchers have attempted to map the economic and social connections
among cities over the years. The current round of interest in "city networks" can
1991). Sassen noted that certain high-profile cities-most notably New York, London,
and Tokyo were increasingly becoming the command and control centers for the world
economy, and that in many ways they had stronger connections to each other than
they did to the rest of their home countries. Attempts to delineate world cities as proposed by Sassen and explore the connections between them have used the location of advanced producer services firms (Taylor, 2001). These advanced producer services-accounting, corporate law, finance-were argued by Sassen to be the primary mechanisms by which world cities achieve their prominent role. By examining where such firms locate and looking at co-location patterns of their offices, Taylor was able to define a. world-city system and articulate links between its component parts.
City systems did not begin with transnational producer services, however, and urban system analysis did not begin with Sassen. In the United States, Allan Pred created an extensive body of historical work on the formation of the US urban system in the eighteenth and nineteenth centuries (Pred, 1977, 1973, 1980) and the spatial diffusion of innovations (Pred, 1975, 1971). Other, recent efforts to map the con-nections between cities at both a. domestic and international level have utilized data from air traffic patterns (Guimera, Mossa, Turtschi, & Amaral, 2005; Neal, 2010), telephone calls, (Ratti et al., 2010; Calabrese et al., 2011), and the movement of dollar bills (Thiemann, Theis, Grady, Brune, &- Brockmann, 2010).
2.4
Themes and Direction
The economic literature on migration has shed a great deal of light over the years on the determinants of migration: what types of people tend to migrate, what drives them to do so, and how they choose where to move. The empirical literature thus far has had less to say about the impacts of migration, especially at the regional level. However, some glimmers of a theory about such impacts emerge from the literature on human capital and economic growth, migration, and social networks that are worth bearing in mind. It seems plausible that, rather than being solely an effect of economic prosperity in a region, migration may contribute to it. The increase in human capital from in-migration to a region may endogenously contribute to economic growth in the future. Less directly, it is possible that the social ties migrants establish between their old and new homes may improve the economic prospects of each. Finally, if individuals migrate only when it increases their overall well being, as hypothesized
by the human capital investment model, then regions with high volumes of migration
churn may enjoy a net benefit independent of any absolute gains in population due to improved matching between residents and opportunities.
Chapter 3
Data Source and Preparation
3.1
Data Source
My primlary data source throughout this tIhesis is the IRS Statistics of Income igra
tion Data. This dataset is put together each year based on address changes reported
-)n indiidu(Ial tax returns filed with the IRS. Dat a is a(Ore(ated to the county level.
For each county, the dathaset conlains inflows and outflows to each other county in the country measured in three wars: the nurnber of ret urns, the number of
exemptions-generaliy one exemption is clairned for each person in a filer's family-and the total adjluste gross incorne. Data for a given pair of counties is suppressed ii there are
fewer than 10 returns (Internal Revenue Service, 2014).
This dat aset is extremely powerful because it is not based on a sample: the entire
population of tax filers in the United States is used. That allows researchers to
examine the flows of migrants in much greater detail than is possible with datasets based on surveys or samples of the population, which tend to have large margins of error for small geographic samples (Isserman, Plane, &- MicMillen, 1982). For insta nce, the American Community Survey 2006-2010 5-year est imat es contain a table
of county-to-county migration flows. but the margins of error are generally larger in
imagnitude than the estimates.
The construction of the dataset does present a few limitations, however. Most notably, since it is construct ed based on federal income tax returns, it excludes those people who do not file income taxes. This means that these counts likely underrep-resent the poor and the elderly, who are not required to file federal income taxes. Additionally, this dat a is limited to returns that have been filed by Sept ember of the filing year. This captures roughly 95-98% of all returns, but late returns tend to be complex and to report high income, meaning that this data may underrepresent the
very wealthy as well (Gross, 1999).
In order to examine the conipleteness of the dataset, I compare it to population data from the 2010 US Census. For each county in the 2009-2010 IRS dataset I sum
the number of exemptions reported as non-migrants and t he total in-migrants from
all other states and foreign countries. This gives the total number of exemptions for
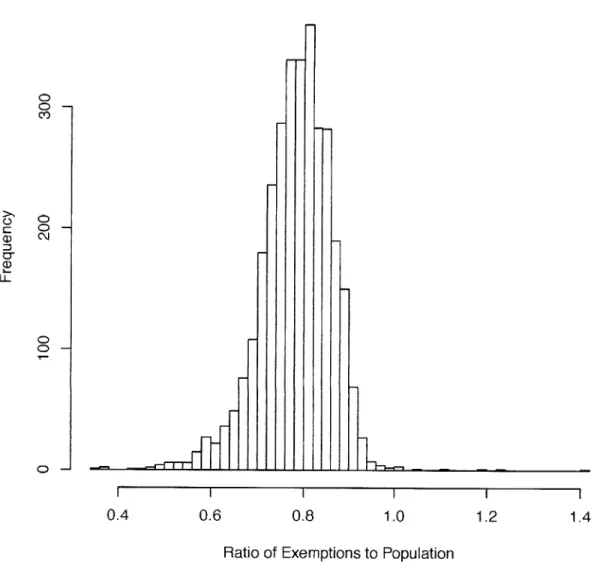
Figure 3-1: Histogram of Exemptions Compared to Population, 2009-2010
0.6
K
.11.I
___________________________________0.8 1.0 1.2 1.4
Ratio of Exemptions to Population
as of April 2010. I then calculate the ratio of this total exemption number to the
population in the 2010 census. A histogram of this ratio for the entire country is
shown in Figure 3-1. On average, counties have about 79% as many exemptions as
they do people. The overall ratio of exemptions to people for the entire country is
79% as well. It is fair to say, then, that my dataset for 2010 includes exact data for roughly 79% of the country, but misses completely the other 21%, who are likely to
be on average poorer and or more elderly than those present in my data.
C) 0 0-C\j 07 U0 -0.4
3.2
Data Preparation
In this analysis, I use data from 2009-2010. The IRS dahta counts the number of people
who changed their address betwe(en the pre'vious year's and the current year's filings.
Here that means it generally captiures people who moved between April 15, 2009 and April 15, 2010. Note that taxes filed in a given year pertain to income earned the year before, so income reported as moving may actually have been earned prior to
3.2.1
Metropolitan Areas
I conduct my aialvsis at the metropolitan level. The rnetropolitan area-a core
rinic-ipality and it's surrounding suburbs is generally considered the most logical definitiOn
of a "city" for the purposes of econonic analysis, since in many cases t he exact
i-munii-ipal boundaries are drawn for political or historical reasons that have little comnection to current economic or social processes.
In particular, I aggregate counties into Core Based Statistical Areas, as lefinied
by the Office of Management and Budget. (BSAs are collections of comities chosen
to consist of one or more urban cores with at least 10.000 people along with the SurrounIng areas to which t hey are linked socioeconomicallv, as measured by com-mnutincg pattems (Office of Management and Budget. 2013). As opposed to migration between counties. where a person nmight move from the city to the suburbs but keep the same job and social ties, migration between CBSAs can generally be thought of
as Involving a substantial change in a persons life.
Since eah county is assigned to at most one CBSA, it is fairly straight forward to map each origin andl destinat ion colinty to its appropriat e CBSA and then aggregate the county-to-county flows into (BSA-to-CBSA flows. This results in a dataset with one row for each pair of CBSAs coutaining the number of returns, exemptions, and gross in ome flowing in each dire tion.
CBSAs can be further divided into Metropolitan Statistical Areas (MSAs), which
have an urban core of at least 50.000 pe_ople, and Micropolitan Statistical Areas, which have urban cores of between 10,000 and 50,000 people. For the rest of this thesis, the terns CBSA., MSA, metro, and city will be used interchangeably.
3.3
Net, Gross, and Reciprocal Migration
The first quantity that generally comes to mind when considering migration flows to and from a region is the net change. This is the bottom line-the overall impact of irugration of a region's population-and it is certainly an important quantity to know. However, one of the benefits of the IRS dataset is that it allows us to go beyond the net changes to examine the gross flovs that, underlie them, which often paint a much richer pictulire.
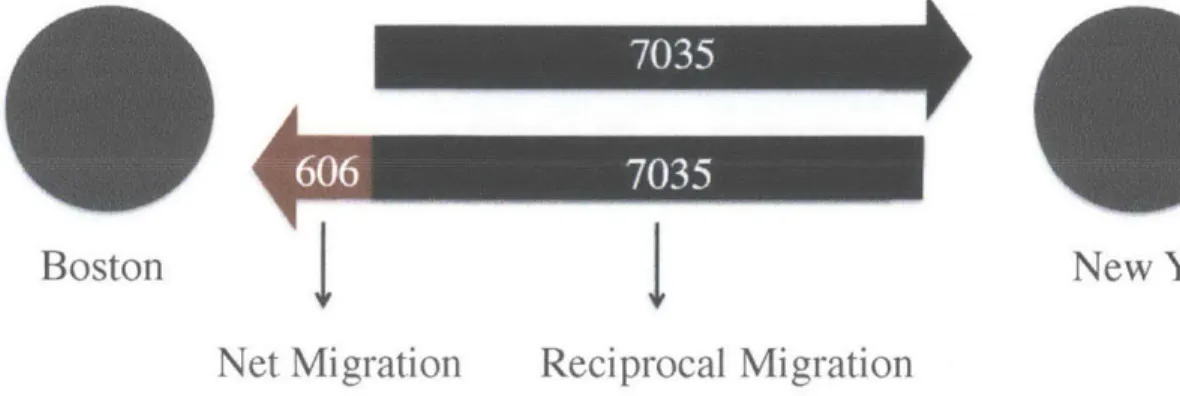
Consider New York and Boston. As illustrated in figure 3-2, from 2009 to 2010, according to the IRlS data, 7035 people moved from the Boston MSA to the New York
Figure 3-2: Migration Between New York and Boston, 2009-2010
Boston
4
4
New York
Net Migration
Reciprocal Migration
MSA, while 7641 people moved in the other direction. That means that there was
a net flow of 606 people from New York to Boston. But these 606 people represent just 8% of the people moving from New York to Boston, and just 4% of the total people moving between those two cities. Focusing solely on net change ignores the other 96% of people moving back and forth.
As another illustration, consider Boston's relationship with two other cities, Chicago and Detroit. In 2010, Boston posted net gains of 211 people from Chicago and 243 from Detroit. But the net gain from Chicago was just 8% of the 2713 people moving back and forth, while that from Detroit was a full 43% of the total migrants. Boston clearly has a much stronger connection with Chicago than with Detroit, but focusing solely on net migration misses that.
To fully access the information contained in migration data, it is necessary to move
beyond just net migration and examine the other components of the flow. In- and
out-migration are relatively straightforward: the total number of people moving in each direction. Some authors are increasingly promoting the use of gross migration, the total number of people moving in both directions. Because this thesis views migration as a measure of exchange and connection between cities, I will make extensive use of a measure I call "reciprocal migration." This is the number of people who switched places between two cities in a given year-the number that moved in both directions. It is the complement of net migration, tracking all of the population movement that didn't contribute to a net population shift. Using reciprocal migration isolates the
exchange part of migration from the directional movement portion.
The relationships among these various types of migration can be understood through the equation:
G = I + O = N + 2 - R
Chapter 4
Observed and Modeled Migration
Patterns
4.1
Metropolitan Migration Rates
In 2(H)9-2010 9,653,424 people (as approximated by tax exemptions in the IRS data) moved across co(unnty boundaries in the United States. 5,280,236 of these moved to another MSA.
Table 4.1 shows the top ten metro areas by number of migrants receive(l in 2009-2(110. Fr each metro, it lists the poputation of the MA5A, the number of migrants who entered, the number of migrants who left, and the net population change due to
migration. This table brings home the distinction between net afnd gross mnigrat ion. New York and Los Angeles received nore rnigrants than any other cities in the country during 2009-2010. However, their net populat ion change due to domestic migration was negative because even larger numbers of people left. On the other hand, cities like Riverside, Washington D(, and Houston all posted substanti al population gains due to inigration despite smaller overall flows than LA or New York. Miami and San Diego form a third category, with hardly any net migration at all despite seeing aImost I 00,000 people move in and out.
In addition, Table 4.1 shows that the net flows are quite small compared to the total number of people moving. Los Angeles had the largest net outflow in the country, and Riverside had the largest net inflow. In both of these cases the net change is less than a quarter of the total flow in thait direction, and thiat prop-)lortion drops relat ively quickly. On the whole, net population gains and losses due to migration amount to just 7.1% of the total flows into and out of cities, and the average pairwise flow has a net population shift accounting for just 16% of its total flux.
F(:cusing on population exchange, Figure 4-1 maps the total reciprocal migration by metro. In this map as well as the many to folloy, the circles representing MSAs are sized according to population. They are colored based on the variable indicted. with blues indicating low values and reds indicating high ones. Here, we see that the metros with the largest overall numbers of reciprocal migrants are Los Angeles, New York City, and Riverside. New York and LA are not surprising considering that they
Table 4.1: Top 10 Migrant-Receiving Metros, 2009-2010
MSA Population In-migrants Out-migrants Net Migration
Los Angeles, CA 12,828,837 194,069 258,610 -64,541 New York, NY 18,897,109 155,501 214,875 -59,374 Riverside, CA 4,224,851 152,943 117,577 35,366 Washington. DC 5,582,170 124,960 102.225 22,735 Dallas, TX 6,371,773 121,958 103,831 18,127 Houston, TX 5,946,800 103,380 80,884 22,496 Phoenix, AZ 4,192,887 98,921 93,317 5,604 Miami, FL 5,564,635 98,188 99,582 -1,394 San Diego, CA 3,095,313 95,048 94,514 534 San Francisco, CA 4,335,391 94,551 101,321 -6,770
are the two largest cities in the country. Riverside is less expected, but over half of its migrants are exchanged with Los Angeles. The other cities with high levels of reciprocal migration are Washington DC, Dallas, San Francisco, Miami, San Diego, Chicago, and Phoenix.
In addition to looking at the total numbers of people moving between cities, it is instructive to consider the rate of migration relative to population. One can think of a city's migration "churn rate" as the percentage of its population that migrates in and out, over the course of a given year, independent of any net, changes in population. Churn rate has no direct effect on the population size of a city, but places with high
churn rates will see large portions of their populations cycle in and out ea.ch year,
perhaps indicating greater dynamism.
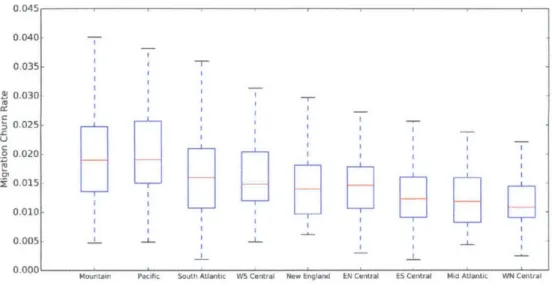
Figure 4-3 maps the churn rates of metros. Two things stand out. The highest churn rates are found in relatively small metro areas that are distributed seemingly at random around the country. However, on closer inspection these appear to be metros that contain military bases. Many of these metros are also among the cities whose migrants travel the farthest average distances. This makes sense: there are a lot of members of the armed forces, and they tend to dominate the rural areas surrounding major bases. They are also likely to move frequently due to changing deployments or discharge from service, and they often have little prior relationship with their post,. Because these movements are not strictly economic decisions-army staff choose where to send people based on military needs, and wages are not tied to being in a particular location-they may have different economic impacts than economically-motivated migration. However, if soldiers engage with the local communities they may still form social ties that they maintain after their period of service.
Beyond the very high churn rates surrounding military facilities, some regions of the country appear to have generally higher churn rates than others. The west, especially the desert southwest, and Florida stand out for relatively high churn rates across a number of metro areas. The northeast and Midwest appear to have lower churn rates on the whole. Figure 4-3 displays box plots of the distribution of churn
Figure 4-1: Reciprocal Migration, 2009-2010 -~ * . 00 ee
e,"'4
a gI
Figure 4-2: Migration Churn Rate, 2009-2010
loop*
0
I
A
Figure 4-3: Migration Churn Rate by Census Region, 2009-2010 0.045 0.040 -0.035
2
0.030 - D0,025-C .2 5 0.025 r -0.020 ~ 0.000,Moujntain Pacific South Atlantic WS Central New England EN Central ES Central Mid Atlantic WN Central
rates by Census region. The median western metro has a churn rate more than 50% higher than the median metro in the West North Central region (the western Midwest and northern great plains).
4.2
Individual Migration Flows
Narrowing the focus of analysis, Table 4.2 shows the largest individual flows between pairs of cities. This list is dominated by pairs of large MSAs adjacent to each other, and particularly by the flows between Los Angeles and Riverside, California (the number of people moving between L.A. and Riverside is greater than the rest of the top ten flows combined). In many of these cases, it can be debated whether the two MSAs are truly distinct economic units. In fact, the OMB releases a list of "Combined Statistical Areas" composed of groups of adjacent MSAs that have particularly strong mutual ties. Of the top 10 flows, only those from New York to Miami and Philadelphia, cross CSA boundaries.
This raises an interesting point. It is impressive that 90,000 people moved from Los Angeles to Riverside in one year, but it is not necessarily surprising that large numbers of people move between adjacent large cities. Figuring out whether the LA-Riverside migration is notable requires a method to determine which flows are substantially larger than would be expected a priori, and thus suggestive of unusually strong economic or cultural ties between their sending and receiving cities, and which can be explained due to geography alone. Identifying meaningful migration links requires a "null hypothesis" for comparison.
How to formulate this null hypothesis is a difficult question. It doesn't make sense to assume that migrants have an equal propensity to migrate between all pairs of cities, but any departure from this should have a theoretical foundation.
Fur-Table 4.2: Top 10 Migration Flows, 2009-2010
Origin Destination Migrants Distance (km) Los Angeles, CA Riverside, CA 93,807 194
Riverside, CA Los Angeles, CA 551729 194
San Jose, CA Scan Francisco, CA 20,014 125
Washington, DC Baltimore, Mi) 18,732 89
San Francisco., CA San Jose. CA 18,120 125
Baltimore, MD Washington, DC 16,936 89
New York, NY Philadelphia, PA 16.870 156
San Diego, CA Riverside, CA 16,179 179
New York, NY Miami, FL 15,374 1,743
Philadelphia, PA New York, NY 13,964 156
ther, determining which factors explain two cities' inherent likelihood of exchanging
migrants and which ones are additional explanatory variables tlhat signify a special relationship between the cities is somnething of a judgment call. If there is an inter-state highway dir(ectly connecting two MSAs. should that go into the model as an a priori predictor of increased riigration between them? What about if they are in the same state. and thus share many of the sane political and economic institutions? It is conventional wisdom that there has been a net migration of people to warmer climates over the past several decades. Should temperature be considered an inherent
fact or in predicting migration relat ilnships?
Ultimately, I include popullat ion and dist ance as the exogenous factors that should De expected to influence migration patterns independent of any special relationships between cities. The population of a sending city determines the number of potential migrants, while that of a receiving city is a reasonable proxy for its overall attractive-ness as migration (estination the likelihood of having a relative or a job opportunity there, for example. Following Tobler's first, law of geography, all else equal we would expect a city to have less interaction with distant metros than with nearby ones.
4.3
The Radiation Model
Even with only two predictor variables there are a number of options for the functional form of the "null hypothesis" model. Traditionally geographers have been fond of gravity models, which take inspiration from the equations governing the gravitational forces that all physical bodies impose on each other. The amount of interaction between two cities is hypothesized to be proportional to the product of those cities' populations divided by the distance between them raised to some exponent. Theory is agnostic on what that exponent should be (in the case of physical gravity, it is equal to two. but that exponent has not been universally observed among geographic phenomena), and in practice it is often selected to fit, the data.
today. However, one weakness of it, is that while it incorporates information on the
population of the origin and destination, as well as the distance between them, it does not include any information on what exists in the space between the cities. The intervening features of a, landscape can have a strong impact on the amount of interaction between two places, independent of distance. In Montana, high school sports teams will travel hundreds of miles for a regular season game, because there are so few towns in the intervening area. On the east coast that type of interaction
rarely involves a trip of more than a dozen miles, because there are so many nearby alternatives.
One recent attempt to incorporate the population of the area between two cities, and to remove the free parameter that is the exponent in the gravity model, has been
termed the "radiation niodel" (Simini, GonzAlez, Maritan, & Barabdsi, 2012). Rather
than using the analogy of gravitational forces, the radiation model treats migrants
(or commuters, or freight flows) as if they are physical particles. The probability of a given particle colliding with another at a distance d is equal to the probability of it hitting the latter while not having collided with any particle in the intervening space.
In the case of migration, we can imagine that a, person will move if she becomes aware of an opportunity that is sufficiently superior to her current living situation in terms of employment options, access to friends or relatives, access to amenities, or other factors. Two assumptions about these opportunities underlie the radiation
model. First, it is assumed that the likelihood of there being such an opportunity
in a given city is proportional to its population. Most of the factors that draw
people to migrate are in fact correlated with population, so this is a fairly reasonable
assumption. However, it does assume that the types of opportunities are distributed uniformly across the country: if Chicago has twice the population of Minneapolis, then it has twice the number of opportunities, period, and there's no reason why it might be more or less attractive to certain subsets of the population. This is almost certainly false, but it creates an effective null hypothesis. Second, it is assumed that people will tend to move to opportunities closest to their current locations. This could be because they are more likely to learn of opportunities that are nearby, or because longer moves are more costly. The result of these two assumptions is the assertion that people will only move if they find a sufficiently superior opportunity,
and that they will move to the closest such opportunity that they find.
To estimate the overall flow of migrants from one city to another, this decision
process is multiplied by the total number of people in the city of origin. The estimated
flow is thus directly proportional to the population of both cities: the city of origin
because its population is the pool of potential migrants, and the destination city
because the presence of attractive opportunities is correlated with population. The
estimated flow is inversely correlated with the total population of all cities that are closer to the origin than is this particular destination, because people will only move to the destination if they have not yet found a sufficiently good opportunity at a closer location.
This last assumption is not entirely count erintuitive, but it does seem a. little less straightforward than the rest of the assumptions underlying the model. People learn about opportunities in all sorts of ways, and if they are already going to be switching
jobs they mlay not care how far they move. Still, if we limit ourselves to purely a priori thinking based only on popullation and distance it seems reasonable to think
that people will mnore often tend to moXve to nearby places tha n to farther ones. The radiiation miodel was originally developed for coiimuting flows, arid in that case the assumptiol1nI isore innocuous: since people don't like to commut e, they will tend to
take the closest job to their house than is a sufficiently good amatch for their interests and desired compensation.
Titirnately, V - the fraction of all migrants leaving city z who end up in city j, is
predieted to be:
A) , A
,j
i-
Qj
( I-.I ]) j + S i)Where pA, is the population of city k and sij is the total population of cities that
are closer to city I than city J is. This ultiimate expression is somewhat similar in
form to t hat of t he gravity model, but with sij replacing distance in the denominator
(along with pi and p]). Note that unlike the gravity model, the radiation model is not
symmetric: the predicted flow from city 1 to city j will not generlly be equal to that from city j to city i. This is because while the cities and the distance dij between them are constanlt, a circle of radius dij centered at city I will c(ntain different cities with aI different total population than one centered on city j. So if' I is in a
peripheral location it is likely to send a higher proportion of its total migrants to centrally located cit
jv
than cityj
will send back. However. it is possible that city j rnay send more total migrants in which case the numerical flows may be similar.4.3.1
Implementation of the Radiation Model
I compute the radiat ion models predictions for 2009-201() migration flows.
Al-though this study is primiarily concerned with migration among MSAs, I include nlonnetropolit an count ies in this calculation to fully account for the intervening op-portunities that are central to the radiation model. TO implemnent the radiat io n) model
I first find the geographic centroid for each NISA and no1netropolitall county. Note
that in some cases the M\SA centroid may be a somnewhat imprecise represent ation
of the of a netro's center of population. Many MSAs, especially in the western U)S,
contain geographically large counties that are sparsely populated. For exaniple, San Bernardino County, CA, part of tile Riverside MSA, is larger that Vermont and New Hampshire combined, but almost all of its population is concentrated in its
south-western corner. The centroid of the Riverside MSA is almost certainly substantially north and east of the vast majority of its population.
Next I compute the great circle distance between each pair of centroids. I then calculate the total population within that distance of each centroid based on the 2010 Census. That information is sufficient to calculate F as described above. I then multiply F&1 by the total number of migrants originating at city I in the 2009-2010
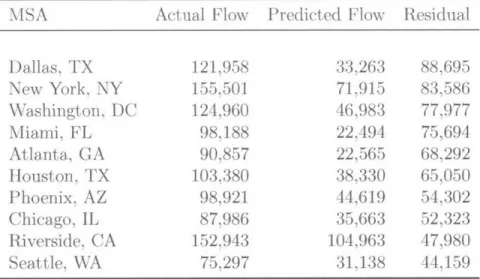
Table 4.3: Largest Positive Radiation Model Residuals
Origin Destination Predicted Actual RIesidual Distance (km)
Los Angeles, CA Riverside, CA 35,087 93,807 58,720 194
New York, NY Miami, FL 650 15,374 14,724 1,743
Riverside, CA Los Angeles, CA 41,942 55,729 13,787 194
San Diego, CA Riverside, CA 3,797 16,179 12,382 179
Miami, FL New York, NY 523 11,134 10,611 1,743
New York, NY Los Angeles, CA 639 7,883 7244 3,943
San Jose, CA San Francisco, CA 13,559 20,014 6,455 125
New York, NY Atlanta, GA 1,150 7,352 6,202 1,222
Los Angeles, CA New York, NY 785 6,928 6,143 3,943
New York, NY Orlando, FL 320 5,995 5,675 1,534
4.4
Radiation Model Results
Figure 4-4 compares the predicted results of the radiation model with those observed. To measure goodness of fit I use the "common part"' statistic employed by Lenormand et al. (Lenormand, Huet, (argiulo, & Deffuant, 2012). The statistic is computed as:
2. E E min (Aj, 1TJ,)
i=Ij-1 =1 i=I 71 M
Where n is the number of MSAs, ,ij is the observed migration flow from location
to location j, and AMfj is the predicted migration flow from location i to location j.
When the model and the have the same total number of migrants, as they do here, the statistic measures the fraction of those that are correctly classified. The common part statistic for the radiation model on 2009-2010 migration data is 0.527, indicating that the radiation model is able to correctly classify about half of the observed migration flows. This is a, reasonably good fit, considering that the radiation model is parameterless-it, is based purely on theory and is not tweaked to reflect the observed data-and that it uses only two variables to predict a noisy and idiosyncratic process. The common part statistic of 0.527 is in line with values found by Lenormand et al. in their evaluation of the radiation model across a number of commuting datasets.
More interesting than the model's overall fit are the specific instances in which it
over- and under-predicts the flows of people. These represent connections between
cities that are either stronger or less strong than would be expected based purely on the physical distribution of people across the country. Tables 4.3 and 4.4 show the top ten positive and negative residuals from the radiation model.
Table 4.3 shows the largest positive residuals from the model. These are flows that are much larger-hence representing stronger connections between their start and end points-than are predicted by the radiation model. There are two main types of
Figure 4-4: Actual vs. Predicted Migration Flows, 2009-2010 105 10 4-102 10 100 -0-2 -U--0 * I1, 10 102 103 Actual Value
Table 4.4: Largest Negative Radiation Model Residuals
Origin Destination Predicted Actual Residual Distance (km)
San Diego, CA Los Angeles, CA 71,669 12,652 -59,017 178
Riverside, CA San Diego, CA 49,841 12,060 -37,781 179
Las Vegas, NV Riverside, CA 35,194 3,289 -31,905 212
Los Angeles, CA San Diego, CA 38,322 13,675 -24,647 178
Phoenix, AZ Riverside, CA 23,550 2,689 -20,861 405
Colorado Springs, CO Denver, CO 20,959 3,528 -17,431 69
New York, NY Philadelphia, PA 32,938 16,870 -16,068 156
Washington, DC Baltimore, MD 33,121 18,732 -14,389 89 Phoenix, AZ Tucson, AZ 18,019 4,050 -13,969 121 Tucson, AZ Phoenix, AZ 17,569 5,654 -11,915 121 U. :3 4-J 104 10 5
flow represented in this table. The first are short-distance flows-generally less than 200 kilometers, meaning that they are between metros that, are essentially adjacent. These flows are generally predicted to be quite large, but the observed numbers are even greater. Los Angeles was predicted to send 35,000 people to Riverside, but it actually sent over 90,000.
The second type of positive residual is perhaps more interesting from the per-spective of determining the urban structure of the United States. It consists of long-distance flows, generally between major cities, that are predicted to be small but are in fact quite substantial. The strongest of these link New York City to Miami and Los Angeles, though also in the top ten are flows from New York to Atlanta and Orlando. Outside of the top ten list some of the highest long distance residuals are found on the flows from Dallas to Atlanta, New York to Tampa, Atlanta, to Miami, New York to San Francisco, and Chicago to Phoenix and Los Angeles.
The negative residuals shown in Table 4.4 are somewhat more uniform in nature. They tend to be the inverse of the first type of flow represented among the posi-tive residuals: MSAs that are close together and that do exchange large numbers of migrants, just not as many as the radiation model would predict. The lack of large negative residuals at long distances makes sense given the radiation model's preference for nearby opportunities: it is not going to predict large long-distance movements if there are closer opportunities.
There are a few flows in Table 4.4-most notably those from Las Vegas and Phoenix to Riverside where the metros in question are not actually adjacent but simply have very few intervening opportunities (the primary one in these two cases being the
Mojave Desert). These two have the smallest observed flows as a percentage of
those predicted-less than 10% in both cases. They may be cases where distance or physical barriers act as an impediment to migration even in the lack of intervening opportunities. This phenomenon is illustrated even more clearly in the flow from Honolulu to San Francisco, which is predicted to be 8817 people but in reality is just
758.
Possibly the most surprising residual in Table 4.4 is that between Denver and Col-orado Springs. These are relatively large cities in the same state separated only by seventy kilometers of fertile plains, but Colorado Springs sends an order of magnitude fewer migrants to Denver than the radiation model would predict. This could poten-tially be due to cultural differences between the two cities: Colorado Springs is known as a relatively conservative city, while Denver is generally seen as more progressive.
The largest positive and negative residuals involve the three major MSAs of south-ern California-Los Angeles, Riverside, and San Diego. The extreme size of these residuals is likely due in part to the quirk in how MSA centroids are calculated de-scribed above. Because the MSA centroids are calculated using the full area of all counties in the MSA, the model treats San Diego as being closer to Los Angeles than to Riverside, and closer to Riverside than Riverside is to LA. It is difficult to precisely define the distance between two cities, but by almost any measure this is incorrect: Riverside and Los Angeles form one continuous urbanized area., while San Diego is a hundred miles to the south. The driving distances between the downtowns of the central cities of these MSAs are 54 miles from Los Angeles to Riverside, 98 miles from