HAL Id: hal-00301688
https://hal.archives-ouvertes.fr/hal-00301688
Submitted on 18 Jul 2007
HAL is a multi-disciplinary open access
archive for the deposit and dissemination of
sci-entific research documents, whether they are
pub-lished or not. The documents may come from
teaching and research institutions in France or
abroad, or from public or private research centers.
L’archive ouverte pluridisciplinaire HAL, est
destinée au dépôt et à la diffusion de documents
scientifiques de niveau recherche, publiés ou non,
émanant des établissements d’enseignement et de
recherche français ou étrangers, des laboratoires
publics ou privés.
maps for flash-floods in the municipality of Jucuarán (El
Salvador)
C. Fernández-Lavado, G. Furdada, M. A. Marqués
To cite this version:
C. Fernández-Lavado, G. Furdada, M. A. Marqués. Geomorphological method in the elaboration of
hazard maps for flash-floods in the municipality of Jucuarán (El Salvador). Natural Hazards and
Earth System Science, Copernicus Publications on behalf of the European Geosciences Union, 2007,
7 (4), pp.455-465. �hal-00301688�
www.nat-hazards-earth-syst-sci.net/7/455/2007/ © Author(s) 2007. This work is licensed under a Creative Commons License.
and Earth
System Sciences
Geomorphological method in the elaboration of hazard maps for
flash-floods in the municipality of Jucuar´an (El Salvador)
C. Fern´andez-Lavado1,2, G. Furdada1, and M. A. Marqu´es1
1Departament Geodin`amica i Geof´ısica, Facultat de Geologia, Universitat de Barcelona, Mart´ı i Franqu`es s/n, 08028
Barcelona, Spain
2World Geologists, Av. Parallel 144–146, 08015 Barcelona, Spain
Received: 8 March 2007 – Revised: 22 June 2007 – Accepted: 27 June 2007 – Published: 18 July 2007
Abstract. This work deals with the elaboration of flood
haz-ard maps. These maps reflect the areas prone to floods based on the effects of Hurricane Mitch in the Municipality of Ju-cuar´an of El Salvador. Stream channels located in the coastal range in the SE of El Salvador flow into the Pacific Ocean and generate alluvial fans. Communities often inhabit these fans can be affected by floods. The geomorphology of these stream basins is associated with small areas, steep slopes, well developed regolite and extensive deforestation. These features play a key role in the generation of flash-floods. This zone lacks comprehensive rainfall data and gauging sta-tions. The most detailed topographic maps are on a scale of 1:25 000. Given that the scale was not sufficiently detailed, we used aerial photographs enlarged to the scale of 1:8000. The effects of Hurricane Mitch mapped on these photographs were regarded as the reference event. Flood maps have a dual purpose (1) community emergency plans, (2) regional land use planning carried out by local authorities. The geo-morphological method is based on mapping the geomorpho-logical evidence (alluvial fans, preferential stream channels, erosion and sedimentation, man-made terraces). Following the interpretation of the photographs this information was validated on the field and complemented by eyewitness re-ports such as the height of water and flow typology. In addi-tion, community workshops were organized to obtain infor-mation about the evolution and the impact of the phenomena. The superimposition of this information enables us to ob-tain a comprehensive geomorphological map. Another aim of the study was the calculation of the peak discharge using the Manning and the paleohydraulic methods and estimates based on geomorphologic criterion. The results were com-pared with those obtained using the rational method. Signif-icant differences in the order of magnitude of the calculated discharges were noted. The rational method underestimated Correspondence to: C. Fern´andez-Lavado
(cfedez@gmail.com)
the results owing to short and discontinuous periods of rain-fall data with the result that probabilistic equations cannot be applied. The Manning method yields a wide range of results because of its dependence on the roughness coefficient. The paleohydraulic method yielded higher values than the ratio-nal and Manning methods. However, it should be pointed out that it is possible that bigger boulders could have been moved had they existed. These discharge values are lower than those obtained by the geomorphological estimates, i.e. much closer to reality. The flood hazard maps were derived from the com-prehensive geomorphological map. Three categories of haz-ard were established (very high, high and moderate) using flood energy, water height and velocity flow deduced from geomorphological and eyewitness reports.
1 Introduction
Flooding is regarded as one of the most dangerous natural hazards and as a principal trigger of disasters (Alc´antara-Ayala, 2002). One of the methods to curb the catastrophic ef-fects of floods is to use hazard maps applied to regional/local planning management with the cooperation of national and local authorities (Montz and Gruntfest, 2002).
Nowadays the general tendency is to produce hazard flood maps using rainfall data and computer-based models. The data needed in these models include a comprehensive register of daily rainfall data, roughness coefficients of the channel and detailed topographic maps or DEMs. Nevertheless, when the quality of data is poor the results of the models are not real. In developing countries like El Salvador, there is a lack of data, with the result that these methods cannot be applied because the results are unreliable.
On 21 October 1998 the National Hurricane Center of the USA identified a low pressure area over the Caribbean Sea. On 22 October this depression evolved into a tropical storm known as Mitch. Between 23 and 26 October winds rose up
to 300 km/h (category 5 in Saffir-Simpson Hurricane scale). In some places of El Salvador the rainfall recorded was about 400 mm/day, which accounts for almost 30% of the average annual rainfall of the whole country. Along the Pacific coast many communities that inhabited the alluvial fans located in the lower reaches of the stream channels were affected. These alluvial fans are activated when a flash-flood occurs resulting in erosion and sedimentation. Because of the floods and landslides, 374 people lost their lives and about 56 000 were displaced. Material losses were estimated at 398 mil-lion U.S.$. Hurricane Mitch triggered the most catastrophic floods in Central America in modern times (Neumann, 2000) Studying the effects of Hurricane Mitch will enable us to reconstruct the extreme reference event in the zone. The Mitch hurricane was an extreme event, and in such events precipitation is not homogeneous in time and along their route. For instance, in Nicaragua accumulated rainfalls re-lated to the Mitch hurricane can vary from less than 100 years (75 years for Leon) to 500 years return period (Con-dega and San Isidro), calculated with the longest rainfall se-ries existing in the country (1966 to 1998) (INETER, 1998). Also in El Salvador, accumulated rainfalls nearby our study zone (pluviometer located in San Miguel, 20 km North of the mountainous study area) vary from 25 to 80 years return period using a 20 year rainfall series depending on the sta-tistical method used, i.e. Type-I Gumbel distribution, GEV, SQRT (Ferr´es et al., 2002). On the other hand, the effects in Quebrada Seca correspond to an extreme event, as it is shown in the following sections.
1.1 Study area
Central America is a prone region to hurricanes coming from the Caribbean Sea between July and December. These hur-ricanes can provoke long and intense rainfall causing severe flooding. The region is also affected by tropical storms be-tween May and November.
El Salvador occupies an area of 21 000 km2. Geologi-cally El Salvador is a very active country. The Cocos plate subducts under the Caribbean plate and forms the volcanic range that extends along the country in a NW-SE direction.
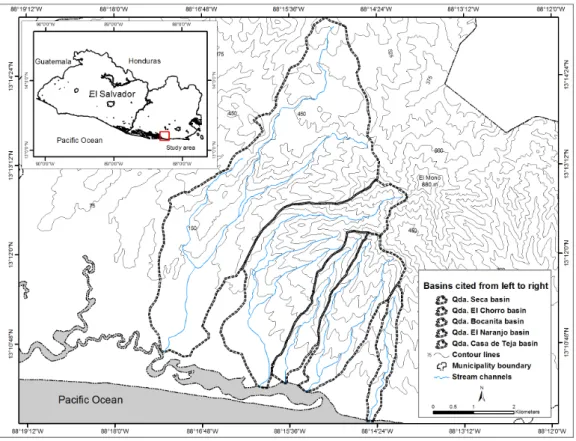
The study area (Fig. 1) is located in the municipality of Jucuar´an (SE El Salvador). The municipality has an area of 32.7 km2and is characterized by stream channels running from the coastal range to the Pacific Ocean. In the study area there are effusive rocks forming part of the B´alsamo unit defined as a succession of basic and intermediate ef-fusive volcanic rocks, pyroclastites and epiclastites (Baxter, 1984) which readily disintegrate.
The flood hazard analysis was focused on the lower reaches of five stream channels flowing into the Pacific Ocean. Most of the communities currently inhabit this zone which was affected by Hurricane Mitch.
1.2 Geomorphological context
The study area consists largely of alluvial fans in the lower reaches of the stream channels. The gradient of these chan-nels varies between 8% and 16% and the basins of these channels occupy areas from 1.6 km2 to 18 km2. Soils are usually regolites that disintegrate without difficulty. Land use is characterized by ever increasing crop cultivation and deforestation (Fern´andez-Lavado, 2006).
These characteristics provide conditions for flash-floods (Camarasa and Segura Beltr´an, 2001) which include a large amount of solid material deposited by landslides coming down the adjacent slopes (Larsen and Simon, 1993; Guinau et al., 2005). This dynamics generate the reactivation of al-luvial fans when rainfall intensity and magnitude are excep-tional as in the case of hurricane Mitch.
One important feature of a flash-flood is the short time between the meteorological phenomenon and generation of the flood (Handmer and Gruntfest, 2001). During Hurri-cane Mitch, large basin rivers such as the Lempa and the San Miguel Rivers had high water levels for several days. On the other hand, channels in our zone displayed a torren-tial behaviour and water levels went down once the rainfall intensity diminished. This sort of flood lasts few hours but with devastating consequences.
1.3 Available data
El Salvador is a developing country and has few resources. In the study area there are no gauging stations. There are no pluviographs. Pluviometers that are already located are insufficient and rainfall records are available for few years and are discontinuous. Topographic maps are slightly de-tailed (1:25 000 scale). In a real flood, water levels can range from centimeters to a few meters. The distance between contour lines in the available maps is 20 m with the result that these maps are of little use for constructing flood haz-ard maps. DEMs do not exist. A rough approach, useful for general description of the region, can be constructed from the contour lines of the 1:25 000 topographic map, equidis-tant 20 m, and the few extra points indicating altitudes on the map (TIN extension of ArcGIS). In consequence, the resolu-tion of the DEM is not enough to reconstruct the topography of the channel affected by the floods at an appropriate scale. Because of this, cross sections can not be extracted system-atically from the DEM in order to calculate discharges.
Vertical aerial photographs from December 1998 were ac-quired (Open Skies post Hurricane Mitch aerial photogra-phy, USGS). They are not orthophotographs but they gave us a high resolution of the zone. The photographs were en-larged in order to work at approx. 1:8000 scale. Despite the distortions of the aerial photographs, these detailed and en-larged photographs provide more and better information than the 1:25 000 scale topographic maps. The main geomorpho-logic effects of Hurricane Mitch are still visible. Using these
Fig. 1. Study Area. El Salvador is the smallest country in the Central American isthmus.
photographs it is possible to locate the evidence of flooding and to construct a geomorphologic map that reflects all the features and characteristics modelled by the reference flood. The resulting geomorphological features will exert an influ-ence on future floods.
2 Methodology
Most hydrological studies are focused on obtaining peak dis-charges to determine floods. Other studies concern geomor-phological and historical information (Arnaud-Fassetta et al., 2004; Ballais et al., 2005). In this study we adopted the two approaches. On one hand, the geomorphological analysis of evidence and eyewitness reports (T´emez, 1997) constitute the basis for the comprehensive geomorphological map. On the other hand, the calculation of discharge values during the peak discharge provides us with an order of magnitude of the flow. Both these approaches will enable us to give an overall view of the phenomenon and to discuss the validity of the methods used.
2.1 Integrated geomorphological method
The geomorphological evidence is obtained using three com-plementary techniques, as described below. The integrated
geomorphological map is constructed with this evidence (Furdada et al., 2007). The method is very similar to that used by Arnaud-Fassetta et al. (2004) and Ballais et al. (2005) but adapted to the characteristics and constraints of Central America (Furdada et al., 2007).
2.1.1 Vertical aerial photointerpretation
Photointerpretation precedes the fieldwork. The preliminary analysis provides a geomorphological scenario that condi-tions the processes during the flood. In the case of alluvial fans channel migration and decreasing sediment distribution along the fan and other processes can be expected. The anysis is focused on the lower reaches of the channels and al-luvial fans given that the higher reaches are abrupt and unin-habited.
The aerial photographs of December 1998 show a num-ber of geomorphological effects caused by hurricane Mitch (Fig. 2a). These effects include reactivation of alluvial fans, preferential stream channels, stagnant water, overflow in me-anders, erosion and deposition zones. In addition a number of anthropic constructions influencing the flood i.e. manmade terraces to cultivate cotton can also be identified.
Fig. 2. Photointerpretation. Observations: main channel, preferential circulation channels and sedimentation zones. Location of the cross section used for the general geomorphological estimation of the flow is shown (see Sect. 2.2.3.).
2.1.2 Fieldwork and eyewitness reports
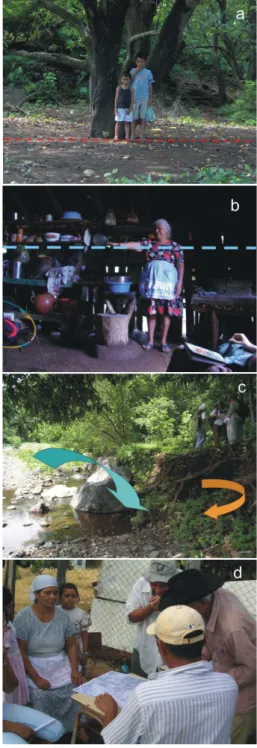
Evidence from aerial photographs is corroborated during fieldwork and eyewitness reports are obtained from local people: (1) field evidence: critical points of overflow, big boulders displaced by flow energy, tree roots covered by fine sediments, vegetation influence and sediment retention, etc. and (2) eyewitness reports: high water levels during peak discharge, material transported by flood, damage caused by flow, etc. which give an idea of the energy of the flash flood (Figs. 3a–c).
2.1.3 Community workshop
The aim of the community workshop is to obtain a histori-cal perspective and specific information about the reference event (Hurricane Mitch in this case) complemented with eye-witnesses reports obtained during field work. People are di-vided into groups to discuss the enlarged aerial photographs (Fig. 3d). It should be noted that people are able to recognise their houses and identify community infrastructures and all the effects related to the reference flood without difficulty. The limits of the flooded area were drawn as well as water
height, damage, buildings and structural elements within the community. In order to establish the return periods of dif-ferent flash floods, people were asked about past floods, but in this case no one in the community could recall a flood that matched Hurricane Mitch in magnitude. Nevertheless, the oldest people in the community were able to recall Hur-ricane Fif´ı in 1974. This information gives us an idea of the frequency of large magnitude floods. The consequences of Hurricane Fif´ı were not as devastating as those of hurricane Mitch. Other aims of the workshop included the preservation of the historical memory of the community as well as raising the awareness of future floods.
2.2 Discharge calculations
This section is concerned with estimating peak discharge val-ues during the flood. In addition, these discharge valval-ues are usually used as input data in flood computer models. Here, we summarize the calculations employing the different meth-ods normally used by technicians and practitioners. Our aim is to highlight the limitations of computer-based models that are sometimes used without a criterion.
The quality of the data must be evaluated for all the meth-ods in order obtain reliable results (Maizels, 1983). This is of especial importance in areas with little data. The rational method, for instance, depends on rainfall data series lasting for few years and that are discontinuous in our zone. Nev-ertheless, prior studies in Quebrada Seca stream were un-dertaken to obtain a peak discharge, using rainfall records not exceeding 15 years. The pluviometer is located in El Transito Municipality, 10 km North-West of the study area; TyI Gumbel distribution was applied to obtain return pe-riod rainfall values. Intensity rainfall derived from daily pre-cipitation, and run-off values were calculated and the rational method applied) (Torrecilla et al., 2003). Results ranged be-tween 150 m3/s and 200 m3/s.
In our study the Manning (Benson and Dalrymple, 1967) and the paleohydraulic (Costa, 1983) methods were also used. Our peak discharge results were compared with those obtained by Torrecilla et al. (2003), cited above. The calcula-tions were made in the Quebrada Seca stream since this has the largest fan in all the studied area. It is the stream that causes most damage during floods.
To apply the Manning and the Paleohydraulic methods, one cross section was obtained. This section was measured in the field by using a compass, a clinometers and a meter tape measure, and with the aid of a native inhabitant who cleared off the vegetation grown since 1998. The slope of the channel was obtained also in the field, close to the cross section and along the lowest terrace. The location of the cross section was carefully chosen. As commented in section 1.3., topo-graphic maps at 1:25 000 scale were useless to build cross sections at an appropriate scale and the difficulty of access (rainforest) made very difficult to obtain series of cross sec-tions. It was assumed that all the water that spread over the
Fig. 3. Integrated geomorphological method. Techniques and indi-cators employed. (a) Tree roots covered by fine sediments, indicat-ing low flood energy. The red line indicates the surface of the fine sediment deposited, covering the base of the trunk, at the level of the tree. (b) Woman indicating water level inside her house during flash-flood peak. (c) Displacement of large boulders. Undermining in a meander. Critical overflow points were, in some cases, wa-ter canalizes to preferential circulation channels. (d) Community Workshop. Persons working with enlarged aerial photographs.
Fig. 4. Cross section made in Quebrada Seca at the apex of the alluvial fan. The Manning and the paleohydraulic methods were applied. The section was obtained in the field, using compass, clinometers and a meter tape measure.
Table 1. Discharges obtained with different methods. Qr –
Dis-charge calculation obtained from the rational method. Qm–
Dis-charge calculation obtained from the Manning method; Qp–
Dis-charge calculation obtained from the paleohydraulic method; Qg–
Discharge estimate obtained from geomorphologic evidence.
Discharge (m3/s)
Qr(Torrecilla et al., 2003) Qm Qp Qg
Qda. Seca 138–184 288–672 779 ∼3000
alluvial fan had passed through this section (Fig. 4), located near the apex of the alluvial fan.
In addition, an estimate using geomorphological criterion was made, which enabled us to analyze more critically the methods employed (Table 1).
2.2.1 The Manning method
In order to apply the Manning equation, the area correspond-ing to the cross section of the stream (Fig. 4) is needed to cal-culate peak discharge (Harrelson et al., 1994). Subsequently the Manning equation was used:
Q = A × R 2 3 × j12
η (1)
where Q is the discharge, R is the hydraulic radius (A/Wp),
A is the area of the cross section, Wpis the wet perimeter, j
is the channel slope and η is the roughness coefficient. The selected roughness coefficient values ranged between 0.03 associated with mountain channels with gravel and a few boulders and 0.07 associated with mountain channels with large boulders (Chow, 1959). Benson and Dalrimple (1967) propose values related to the channel characteristics from 0.028 to 0.035 (gravels) and until 0.07 (boulders). We assume that the values 0.03 and 0.07 represent well enough the possible range of coefficients applicable to Quebrada Seca, even though values ranging from 0.04 to 0.07 could be more appropriate.
Discharges obtained from this data ranged from 288 m3/s to 672 m3/s (Table 1). Using this equation, the results are very sensitive to the roughness coefficients selected. 2.2.2 The Paleohydraulic method
The paleohydraulic method developed by Costa (1983) and applied to a number of studies (Alcoverro et al., 1999; Williams, 1984) is based on obtaining the mean velocity of flow by means of the intermediate axis of the largest boulders moved by the flow. The following equation was used (Costa, 1983):
v=0.182 × d0.4873 (2)
where v is the velocity, d is the mean value of five inter-mediate axes of the five largest boulders displaced by flood. Downwards the section (Fig. 4), a number of blocs that had been transported across it by the flow (eyewitness and Al-coverro et al., 1999) was measured and the five largest blocs were selected. The resulting d value was 1462 mm, which means a velocity of 6.21 m/s. Once the velocity and the area of the cross section are known (Fig. 4), the following equa-tion can be applied:
Q=A × v (3)
where Q is the discharge, A is the area of the cross sec-tion and v is the velocity. The discharge obtained is around 780 m3/s (Table 1).
2.2.3 Estimate derived from geomorphological criteria The discharge in the middle part of alluvial fan was estimated (Fig. 2a). This estimate was used to obtain an approximate discharge value that represented only one order of magnitude of the flow. The cross section was obtained using GIS tech-niques. A rough DEM, useful for other purposes than obtain-ing cross sections, was constructed from the topographic map at a scale of 1:25 000 (see Sect. 1.3). The DEM allowed us to draw a rough, approximate cross section in the alluvial fan (Fig. 2). The limits of the flood and the height of the water level were well known: the flood occupied the whole width
Fig. 5. Geomorphological indicators map at Quebrada Seca stream.
of the alluvial fan; the water level was at least about 1 meter (witnesses information). Then the area of the cross section occupied by the flood was calculated. This was rough, but real information. Velocity flow was not calculated, but es-timated at 4 m/s using damage and displaced boulders. It was considered lower than the velocity calculated at the up-stream cross section because of the following reasons: 1) wa-ter spreads over the alluvial fan, and consequently the wawa-ter level falls (Fig. 3b) and velocity decreases; 2) during the peak discharge, water spreads over the fan, and velocity is higher in the preferential circulation channels than in the
intermedi-ate zones; 3) the flow velocity in the preferential circulation channels during the peak discharge has to be high enough to transport large boulders. The area of the cross section was about 780 m2. With the aid of these data Eq. (3) can be used to obtain a discharge value of about 3000 m3/s (Table 1). 2.2.4 Limitations of the methods
It should be pointed out that the rational method underesti-mated the results with respect to those of the other methods used in this work. This may be due to the availability rainfall
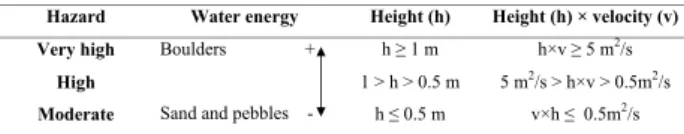
Table 2. Hazard ranges in Jucuar´an Municipality derived from Hurricane Mitch effects. Classification made using water energy and water level criteria. Velocity estimated by the paleohydraulic method.
2 ! 3 # 2 & ) 2 & ) 4 ( # &()
5 # ! " # ! $ %
2 " & & ' $ $ % & # & ' $ %
( )
* + , ' $ # , ' $ %
records that are discontinuous and cover few years. These data do not therefore reflect the real evolution of rainfall dur-ing a long period of time in our zone. Other limitations in-clude the application of probabilistic methods, run-off coef-ficient election, etc. (Ayala-Carcedo, 2001).
As regards the other methods, a number of considerations must be borne in mind when analysing the results.
The Manning method depends on a number of variables. Of these, slope, water height and especially the roughness co-efficient can considerably vary the results (Benson and Dal-rymple, 1967). Channel erosion, which is directly influenced by channel slope, is very often overlooked. The water of-ten leaves marks along the river channels, ofof-ten used to re-construct the water level a posteriori. The water level varies during a flood and usually, the marks along the channel are assumed to correspond to the peak discharge water level. As the erosion incises the stream, the stream bed deepens with the result that the water level descends. In this case, the water mark would be erroneous and the resulting discharge overes-timated. This can be the scenario for steep stream channels (Jarrett, 1986). The opposite scenario can also happen. Dur-ing peak discharge the area of the cross section of the chan-nel can be larger than the area measured after the flood. This may be due to the filling of the channel with sediments when flow energy diminishes after peak discharge. This could have happened in the lower reaches of the channel and the alluvial fan in Quebrada Seca. In this case, the discharge could have been underestimated.
When using the paleohydraulic method it is necessary to be sure that boulders were transported by the flood and they passed through the section where the velocity is calculated (Alcoverro et al., 1999). Another difficultiy of the applica-tion of this method is that velocity can be very variable across the section. In addition, during one of these extreme events, several flood peaks can happen. Also, in alluvial fans the properties of the flow can vary and change from a water flow transporting bed load and fines to a debris flow (that can eas-ily transport big boulders). Even though, in this case and supported on witness information, it seems that there was at least one very important discharge peak (not a debris flow) and the flow (water plus sediment) covered all the alluvial fan. During this flow peak some large boulders were
trans-ported and deposited near the houses, downwards the consid-ered cross section (houses flooded, inhabitants went out, and when they came back the big boulders were found besides the houses; no evidence of debris flow deposits were found in these cases) (Fig. 5). We deduce, then, that the boulders measured (or other boulders of the same size) could be trans-ported across the section by the flow, at least during the most important peak. Another of the limitations of this method is that we cannot be sure whether the flow could have trans-ported larger boulders. The size of the transtrans-ported blocks depends on the maximum size of the available blocks, on the size distribution of all particles in the load and on the energy of the flow (Selby, 1991). The size of the blocks is controlled firstly by the lithology and the discontinuities of the bedrock, and finally by the alteration of this fragmented bedrock which becomes the regolite; this regolite, including the blocks, is eroded and incorporated to the stream. If the flow had transported larger boulders (i.e. not available in the basin) the resulting discharges would be underestimated.
In our work Manning and paleohydraulic methods were applied in one of the best possible cross sections (approx. 300 m North of the map in Figs. 2, 5 and 6), made at the apex of the alluvial fan and assuming that the flow that spread over the fan must have passed trough this section.
The estimate based on geomorphological criteria is about one order of magnitude higher than those calculated with the paleohydraulic and the Manning methods. This estimate is based on real data or on data directly derived from the real data (extension of the fan affected by the flow and water level height, obtained form geomorphological evidence and wit-ness). This result may be considered to be closer to reality than the other results. Channels can be modified during flood last stages, and sediment redistributed and deposited, but this is not considered in our rough estimation. The aim of our rough estimation is just to point out that, taking into account the geomorphological frame or scenario (i.e. the alluvial fan and its limits in this particular case), calculated flows can be “calibrated” (or at least compared to an extreme value, used as a reference) and assumptions and hypothesis used to cal-culate flows can be reconsidered if necessary. The limitations of the different methods discussed above exert a considerable influence on the discharge calculation in large flash-floods. The use of geomorphological indicators together with real data enables us to assess the validity of the results obtained by other methods.
3 Results
From the comprehensive/integrated geomorphological map (Fig. 5) we can construct a hazard map (Fig. 6).
Flood hazard evaluation methods are mostly based on flood frequency, height and velocity of the flow or, like in Neumann (2000), a combination of all these parameters (in-cluding height per velocity). Several authors propose to
se-Fig. 6. Flood Hazard map at Quebrada Seca stream.
lect a reference event and to elaborate the hazard zoning based on the flow height and velocity for this event. For in-stance, ACA (Generalitat de Catalunya) (2003) propose to take the 100 years return period event; for this event the high hazard level corresponds to a flood height >1 m, flow veloc-ity >1 m/s, or the product of height per velocveloc-ity >0.5 m2/s; the moderate hazard level corresponds to a flood height
>0.4 m, flow velocity >0.4 m/s, or the product of height per
velocity >0.08 m2/s. The Minist`ere de l’Am´enagement du Territoire et de l’Environnement Franc¸aise (MATE), in the Plans de pr´evention des risques naturels previsibles : risque
d’inondation (1999) proposes a similar approach, and specif-ically treat flash floods: for a 100 years return period flood, the low hazard corresponds to a flood height <0.5 m or/and a flow velocity <0.2 m/s; the medium hazard corresponds to a to a flood height (h) 0.5 m< h<1 m or/and a flow velocity (v) 0.2 m/s< v<0.5 m/s; the high hazard corresponds to a to a flood height >1 m or a flow velocity >0.5 m/s; and the very high hazard corresponds to a flood height >1 m and a flow velocity >0.5 m/s.
We lacked sufficient data to make a hazard map based on the return periods. But the Mitch associated flood was, with
no doubt, a very low frequency, extreme event. So we take this event as the reference one. We obtained sufficient infor-mation about water levels and flow energy from geomorpho-logical analyses and eyewitness reports to construct a map. We can superimpose all these data (synthesized in Fig. 5) to elaborate a hazard classification (Table 2):
Very high hazard zone. Big boulders displaced by flow en-ergy. Water levels above 1 m and/or the result of multiplying velocity (v) and height (h) exceeds 5 m2/s (where velocity is estimated by the paleohydraulic method).
High hazard zone. Medium boulders and cobbles dis-placed by flow energy. Water levels between 0.5 m and 1 m. The result of multiplying velocity (v) and height (h) ranges between 0.5 m2/s and 5 m2/s (where velocity is estimated by the paleohydraulic method).
Moderate hazard zone. Gravels and sands displaced by flow energy. Water levels below 0.5 m and/or the result of multiplying velocity (v) and height (h) does not exceed 0.5 m2/s (where velocity is estimated by the paleohydraulic method).
4 Conclusions
Hurricane Mitch is regarded as the reference event in our study area. The geomorphology of the basins favours flash-floods because of the short time elapsed between the rainfall and the flood and because of the short time of high water level permanence. The analysis of the effects of Hurricane Mitch enables us to characterize flooding in this area and to construct flood hazard maps useful for the communities that inhabit the alluvial fans located in the lower reaches of the channels.
The lack of good, detailed data obliged us to use the avail-able data and documents, which we used with a geomor-phological perspective. The method includes well known techniques (interpretation of aerial photographs, compila-tion of historical references, field survey and eyewitness re-ports). The geomorphological evidence obtained was accu-rately mapped on the aerial photographs on a scale of 1:8000. The integrated geomorphological map, which is the most im-portant document on which this work was based, could then be constructed using these photographs.
The geomorphological evidence was completed and com-pared with discharges estimated by different methods. It should be pointed out that certain techniques of discharge calculation, which are very often used between engineers and technicians, can lead to erroneous results when applied to ex-treme magnitude floods. Flash-floods have an enormous ca-pacity for erosion and sedimentation and reshape the chan-nels. Another limitation of these methods is that a large amount of transported material, which characterises flash floods, is not considered in the hydraulic calculations. In ad-dition, if equations are applied using uncertain data (i.e. short rainfall series) or unreal hypotheses, the results could be even
more erroneous. Geomorphological evidence, including the alluvial fan scenario in this case, is useful to evaluate the goodness of the results obtained with other methods.
The historical memory of the communities resides in the oldest members. Although this is a valuable source of in-formation, these persons can only produce information for a period not exceeding 80 years. A hazard map based on flood return periods was not considered because of insufficient his-torical data. Given the available geomorphological informa-tion (the integrated geomorphological map), it is possible to construct a flood hazard map as a function of variables re-lated to flood energy e.g. size of the sediment transported, water height, flow velocity, etc.
It should be noted that the lifetime of flood hazard maps is finite. During floods, water will flow preferentially through the channels that were reshaped by Hurricane Mitch. For extreme events with a magnitude similar to or higher than Mitch, channel reshaping can occur because of the high dy-namic activity generated in the alluvial fans. Changes in the geomorphology will lead to changes in future floods. Flood hazard maps constructed with the geomorphological method will continue to be valid until remodelling caused by the next extreme flood. This is applicable to all flood hazard maps.
Thus, the hazard maps obtained using the geomorpholog-ical method are reliable because they derive from real data. They are also accurate, simple and relatively cheap. These flood hazard maps achieve a dual purpose: for self-help com-munity emergency plans and for land use planning carried out by the regional authorities.
Acknowledgements. This study has been possible thanks to the
agreement between the World Geologists NGO and the
Departa-ment de Geodin`amica i Geof´ısica of the Universitat de Barcelona.
The project was financed by the Generalitat de Catalunya and
Universitat de Barcelona. The project was supported by the Consolider-Ingenio 2010 programme, under CSD2006-0004“Topo-Iberia”. We are indebted to all the communities that participated in the study such as Puerto Caballo, la Bocana and Salamar. Thanks are also due to all the persons who contributed with their knowledge to our study of the floods caused by Hurricane Mitch in 1998.
Edited by: L. Ferraris
Reviewed by: J.-L. Ballais and another anonymous referee
References
Ag`encia Catalana de l’Aigua (ACA): Recomanacions t`ecniques per als estudis d’inundabilitat d’`ambit local, Generalitat de Catalunya, Barcelona, 106pp., 2003.
Alc´antara-Ayala, I.: Geomorphology, natural hazards, vulnerabil-ity and prevention of natural disasters in developing countries, Geomorphology, 47, 107–124, 2002.
Alcoverro, J., Corominas, J., and G´omez, M.: The Barranco de Ar´as flood of 7 August 1996 (Biescas, Central Pyrenes, Spain), Engi-neering Geology, 51, 237–255, 1999.
Arnaud-Fassetta, G., Cossart, E., and Fort, M.: Hydro-geomorphic hazards and impact of man-made structures during the catas-trophic flood of June 2000 in the Upper Guil catchment (Queyras, Southern French Alps), Geomorphology, 66, 41–67, 2004. Ayala-Carcedo, F. J.: La inundaci´on torrencial catastr´ofica del
camping “LasNieves” del 7 de agosto de 1996 en el cono de deyecci´on del Ar´as (Biescas, pirineo ADD SPACE aragon´es), in: Riesgos Naturales, Una perspectiva global, edited by: Ayala-Carcedo, F. J. and Olcina, J., Ariel, Barcelona, 2001.
Baxter, S.: L´exico estratigr´afico de El Salvador, CEL, 95pp., 1984. Ballais, J.-L., Garry, G., and Masson, M.: Contribution de l’Hydrog´eomorphologie `a l’´evaluation du risque d’inondation: le cas du Midi m´editerran´een franc¸ais, Comptes Rendus Geo-science, 337, 1120–1130, 2005.
Benson, M. A. and Dalrymple, T.: General field and office proce-dures for indirect discharge mesurements, USGS Techniques in Water Resources Investigations, Book 3, Chapter A1, 1967. Camarasa, A. M. and Segura Beltr´an, F.: Flood events in
Mediter-ranean ephemeral streams (ramblas) in Valencia region, Spain, Catena, 45, 229–249, 2001.
Chow, V. T.: Open-channel hydraulics, McGraw-Hill, New York, 680pp., 1959.
Costa, J. E.: Paleohydraulic reconstruction of flash-flood peaks from boulders deposits in the Colorado Front Range. Geol. Soc. Am. Bul., 94, 986–1004. 1983.
Fernandez-Lavado, C.: Caracterizaci´on de la inundabilidad por avenidas de tipo flas-flood en el municipio de Jucuaran (El Sal-vador, CA), unpublished dissertation, Universitat de Barcelona, 151pp., 2006.
Ferr´es, D., Garc´ıa, J. C., and Mu˜noz, C.: Manejo integral de ame-nazas y vulnerabilidades en el municipio de San Miguel (Depar-tamento de San Miguel), World Geologists (unpublished techni-cal report), 244pp., 2002
Furdada, G., Calder´on, L. E., and Marqu´es, M. A.: Flood hazard map of La Trinidad (NW Nicaragua), Method and results, Nat. Hazards Earth Syst. Sci., in press, 2007.
Guinau, M., Pall`as, R., and Vilaplana, J. M.: A feasible method-ology for landslide susceptibility assesment in developing coun-tries: A case-study of NW Nicaragua after Hurricane Mitch. En-gineering Geology, 80, 316–327, 2005.
Handmer, J. and Gruntfest, E.: Coping with flash floods. Dordrecht: Published in cooperation with NATO Scientific Affairs Division by Kluwer Academic, cop, 322pp., 2001.
Harrelson, C. C., Rawlins, C. L., and Potyondy, J. P.: Stream Channel Reference Sites: An Illustrated guide to field technique. United States Department of Agriculture, Forest Service, Gen-eral Technical Report RM-245, 1994.
INETER (Ed.): Las lluvias del siglo en Nicaragua, Managua, 159pp., 1998.
Jarrett, R. D.: Evaluation of the slope-area method for computing peak discharge, USGS Water supply paper 2310, 13–24, 1986. Jarrett, R. D.: Errors in slope-area computations of peak discharges
in mountain streams, J. Hydrol., 96, 53–67, 1987.
Larsen, M. C. and Simon, A.: Rainfall intensity-duration thresh-old for landslides in a humid-tropical environment, Geografiska Annaler, Series A, Physical Geography, 75(1–2), 13–23, 1993. Maizels, J. K.: Paleovelocity and palaeodischarge determination for
coarse gravel deposits, in: Background to Palaeohydrology: A Perspective, edited by: Gregory, K. J., John Wiley & Sons Inc., 101–139, 1983.
Minist`ere de l’Am´enagement du Territoire et de l’Environnement (MATE): Risques d’inondation. Plans de pr´evention des risques naturels (PPR) (La documentation Franc¸aise), 122pp., 1999. Montz, B. E. and Gruntfest, E.: Flash-flood mitigation:
recommen-dations for research and applications, Environmental Hazards, 4, 15–22, 2002.
Neumann, A.: Propuesta de definici´on de clases de peligrosi-dad para mapas de peligrosipeligrosi-dad a fen´omenos hidrol´ogicos en Venezuela, Proyecto PREVENE, COSUDE, 10pp., 2000. Selby, M. J.: Earth’s changing surface : an introduction to
geomor-phology. Repr. Oxford, Clarendon Press, 245–259, 1991. T´emez, J. R.: Jornadas parlamentarias sobre prevenci´on de riesgos
relacionados con el agua. Sesi´on VI. La protecci´on civil ante el riesgo de inundaciones. Madrid, Senado 24 y 25 de noviembre 1997 (policopied example), 1997.
Torrecilla, C., Barrio, J., Ma˜n´e, R., Mart´ın, M., Laj, L., Fern´andez-Lavado, C.: An´alisis Geol´ogico ambiental para el desarrollo co-munitario de la asistencia primaria en salud (APS) en el mu-nicipio de Jucuar´an, World Geologists (unpublished technical re-port), 244pp., 2003.
Williams, G. P.: Paleohydrologic equations for rivers in Develop-ments and Applications of Geomorphology, 343–367, 1984.