ORIGINAL PAPER
Capabilities of femtosecond laser ablation ICP-MS
for the major, minor, and trace element analysis
of high alloyed steels and super alloys
Helmar Wiltsche&Detlef Günther
Received: 20 August 2010 / Revised: 28 November 2010 / Accepted: 15 December 2010 / Published online: 8 January 2011 # Springer-Verlag 2011
Abstract Femtosecond laser ablation inductively coupled plasma mass spectrometry was used for the quantification of 23 metallurgical relevant elements in unalloyed, alloyed and highly alloyed steels, and super alloys. It was shown that by using scanning mode ablation with large ablation spot diameters (250 μm), stable and representative sam-pling can be achieved for the majority of elements, except for bismuth and lead. For Bi and Pb up to 46%, temporal relative standard deviation (TRSD) was encountered, whereas for most other elements, the TRSDs were below 10%. Calibration with matrix-matched and non-matrix-matched standards provided similar agreement within the uncertainty of the certified values. However, the non-matrix-matched standard-based quantification was more influenced by interferences rather than ablation- or excitation-related matrix effects. The method was validated using 34 certified reference materials. 52Cr, 51V, or 55Mn were used as internal standards due to the fact that the Fe concentration was not certified for the majority of reference materials. The determined concentrations for major and minor elements indicate that the total matrix internal standardization (100 wt.%) is applicable, which requires no knowledge about the steel samples prior to analysis.
Keywords Laser ablation . Mass spectrometry/ICP-MS . Metals/heavy metals . Femtosecond laser ablation ICP-MS . High alloyed steel . Trace contaminants
Introduction
The mechanical properties of alloyed steels and super alloys are not only dependent on the production process or the main constituents but are also critically affected by the concentration of trace contaminants (<100 mg kg−1) such as As, Bi, Sb, Se, Sn, Te, or Pb [1,2,3].
Currently, trace contaminants in steels and super alloys are often analyzed by solution-based methods such as inductively coupled plasma optical emission spectroscopy (ICP-OES) or ICP-MS. To access the trace element concentrations by ICP-OES or ICP-MS, matrix separation prior to the trace element analysis is required to avoid matrix effects and interferences. In ICP-OES, the emission line-rich concomitant metal matrix causes severe spectral interferences [4]. The analysis of trace contaminants by ICP-MS is hampered by isobaric and polyatomic interfer-ences from argides, oxides, chlorides, and doubly charged ions [5] of main matrix elements. Moreover, clogging of the ICP-MS cones can only be circumvented by high sample dilution or the use of flow injection ICP-MS [13]. Matrix separation is often carried out by hydride generation or by liquid–liquid extraction [6,4,7]. The general disadvantage of matrix separation techniques is the lack of universality and general applicability as every protocol is suitable for a few elements only. Furthermore, solution-based analyses are rather time-consuming [12] and prone to contamination during sample dissolution (digestion in acid cocktails). Moreover, current steel production processes allows the analysis of trace element concentration in the final product Published in the special issue Laser Ablation with Guest Editors
Detlef Günther and Jan Fietzke.
Electronic supplementary material The online version of this article (doi:10.1007/s00216-010-4605-8) contains supplementary material, which is available to authorized users.
H. Wiltsche (*)
:
D. GüntherETH Zurich, Laboratory of Inorganic Chemistry, Wolfgang-Pauli-Strasse 10, 8093 Zürich, Switzerland e-mail: [email protected] D. Günther e-mail: [email protected] DOI 10.1007/s00216-010-4605-8
only by liquid analysis. The time-consuming sample dissolu-tion procedure is unsuitable for the monitoring of trace elements in each production step. Process analysis is only possible for the major and minor steel constituents using direct solid analysis techniques such as X-ray florescence spectros-copy (XRF), spark emission spectrosspectros-copy, glow discharge source (GD)-based techniques such as GD-OES, and dedicated elemental analyzers (carbon, oxygen, nitrogen, sulfur; based on sample combustion–molecular absorption).
Laser ablation ICP-MS (LA-ICP-MS) is recognized as a high-sensitivity direct solid analysis technique. Rapid, multi-elemental analysis from trace concentration levels (less than parts per million) up to the percent range have been performed in various applications [11]. Several publications describe the use of Q-switched Nd:YAG lasers for the analysis of minor and trace elements in metallurgical samples [14,15]. These laser systems have pulse durations of a few nanoseconds. During the ablation, a“heat-affected zone” is generated, causing the formation of molten metal in and around the ablation spot. Furthermore, the nanosec-ond pulses can cause preferential vaporization which results in non-stochiometric sampling [16]. Using femtosecond (fs) lasers for ablation, the formation of the“heat-affected zone” can be circumvented as the pulse duration falls below the material-specific thermal relaxation time. For unalloyed steel samples, it was shown that fs laser ablation produces an aerosol consisting of significantly smaller particles when compared to nanosecond laser-generated aerosols [17].
The aim of this study was to investigate the suitability of femtosecond LA-ICP-MS (fs-LA-ICP-MS) for fast, precise, and accurate analysis of trace contaminants in highly alloyed steels and nickel super alloys. Moreover, the multi-element capabilities of fs-LA-ICP-MS for the simul-taneous quantification of major, minor, and trace elements in advanced metallurgical samples and related figures of merit were determined. Furthermore, non-matrix-matched quantification was investigated for major, minor, and trace elements. The method was validated using a total of 34 reference materials, such as unalloyed, alloyed, high alloyed steel certified reference materials (CRM), as well as nickel base alloy CRMs.
Experimental
Certified reference materials
Several CRMs were investigated within this study: unalloyed steels (BAM039-2, BCS451/1, BCS457/1, BCS460/1, ECRM085-1, ECRM090-1, JK2D, SRM364), alloy steels (BAM179-2, BAM184-1, BAM187-1, SRM1243, SRM1261a); highly alloyed steels (BAM227-1, BAM284-2, BAM286-1, BCS334, BCS462, BCS467/1, BCS475,
ECRM231-2, ECRM276-2, ECRM281-1, ECRM295-1, ECRM296-1, JK37, SRM1263a, SRM1264a, SRM346a); and nickel base alloys (BCS345, BCS346, BCS346A, BCS387/1, SRM897, SRM898, SRM899).
All CRMs were in the form of chips, except BCS345, BCS346A, JK2D, JK37, SRM1243, SRM1261a, SRM1263a, and SRM1264a which were used for analysis as discs. CRM chips were embedded in epoxy resin (Struers EpoFix) prior to the analysis. Machine grinding and polishing was accomplished using a commercial polisher/ grinder (Struers LaboPol-5; grinding disc: MD Piano 600; polishing discs: MD Allegro, MD Mol, and MD Nap in combination with the appropriate Struers water-based dia-mond suspension polishing fluids). In order to circumvent potential surface corrosion, polished samples of unalloyed steels and alloy steels were stored in a desiccator. However, it needs to be mentioned that the sample preparation steps described here are not required for process analysis since the samples are commonly in the form of discs and surface contamination can be removed by ablation.
The uncertainties of the CRMs reported in Tables2and3
and in the Electronic Supplementary Material (ESM) are reproduced as stated on the certificates. They represent in some cases the standard deviation of the average value and in other cases the half-width confidence interval C(95%) or are“based on judgment” by the manufacturer.
Laser ablation system
The laser beam (wavelength 795 nm; pulse duration of <150 fs) of a Ti:sapphire femtosecond laser (Legend, Coherent Inc., USA) was focused below the sample surface (∼0.5 mm) by a single plano-convex lens (f = 75 mm). Thereby, the ablation crater diameter was controlled and crater shape distortion as observed by Koch et Al. [8] was circumvented. If not indicated differently, scanning ablation (2 μm s−1 scan speed) with 250 μm crater diameter at a repetition rate of 10 Hz and 2 mJ pulse energy (resulting in a fluence of approx. 4 Jcm−2 and irradiance of 2.7× 10¹³W cm−2) was used throughout the experiments. Some measurements were carried out in single hole drilling mode to compare the aerosol generation between the two modes of ablation. For each measurement, a 30 s gas blank was recorded followed by a 200 s sample ablation. The relatively long sample ablation time was selected to average potential spatial sample heterogeneities for elements such as lead and bismuth. The samples were ablated in a 30 cm3 cylindrical ablation cell equipped with a helium inlet nozzle (0.5 mm nozzle inner diameter). The laser-induced aerosol was flushed with a constant helium flow of 1 Lmin−1to an ICP-MS. An argon makeup gas flow of 0.85 Lmin−1was admixed to the aerosol in front of the ICP to maintain optimum ICP operating conditions. When ablating
epoxy-embedded chips, a minimum distance between the ablation site and the metal chip edge of 50μm was maintained. This procedure was found sufficient to avoid the ablation of the thin metal edges together with the epoxy resin.
ICP-MS instrumental conditions
A quadrupole ICP-MS (Elan DRC II, PerkinElmer SCIEX, Canada) was coupled to the laser system for m/z detection. The ICP was operated at 1,350 W RF power, a plasma gas flow of 17 Lmin−1, and an auxiliary gas flow of 0.7 Lmin−1. A detector dwell time of 10 ms per m/z measured was used throughout the entire experiments. The measured isotopes are listed in Table 1. To avoid detector saturation, the isotopes of major alloy constituents were recorded with increased quadrupole resolution (0.3 amu). Thereby, the ion count rate was reduced by two to three orders of magnitude [18]. The ICP-MS was optimized prior to the analysis for highest signal/noise ratio while maintaining low oxide formation and doubly charged ion formation, respectively. To assure linearity between the detectors pulse and analog counting mode, a dual detector calibration was performed on a daily basis using BCS346.
Data processing and calibration
Data collection and processing was performed in accor-dance with the protocol reported by Longerich et al. [9]. Briefly, each sequence of up to 20 analyses started with the measurement of two replicates on a calibration standard. Then, three samples with five replicates each were measured. The sequence was closed with the measurement of two replicates on a calibration standard. Data reduction and quantification was performed using LAMTRACE [10]. BCS346 (nickel base alloy) and ECRM295-1 (highly alloyed steel) were used as calibration standards since these two CRMs cover the highest number of elements. Further-more, NIST SRM610 (silicate glass) was also used as external calibration standard to determine the differences in the stoichiometry of fs-LA-generated aerosols of a con-ducting and non-concon-ducting material and to study the capabilities of non-matrix-matched calibrations since most steel reference material contain a limited number of certified elements. Limits of detection were determined using the protocol given in [9].
Results and discussion Single hole drilling experiments
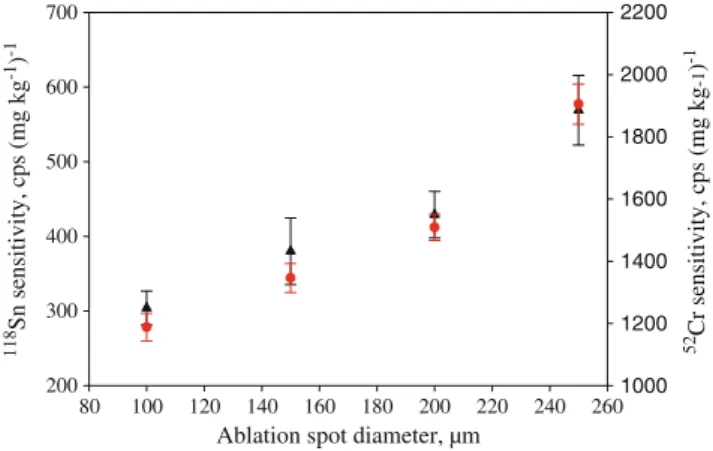
Figure1shows the dependence of the52Cr and the118Sn fs-LA-ICP-MS signal (expressed as sensitivity) on the ablation spot diameter for BCS346. It was found that with increasing crater diameter, the sensitivity increases linearly. With the exception of Se, sensitivities of all recorded isotopes were increased by a factor of 1.5–2.8. This indicates that the fs-LA optical setup does not allow changing the crater diameter independent of the energy. The linear increase in sensitivity indicates that doubling the crater diameter leads to an increase in sensitivity of a factor of 2 only, which is mainly based on the reduced fluence and therefore reduced sample ablation. However, for77Se,78Se, and 82Se, no increase in sensitivity was observed, which can be attributed to the low concentration of Se in BCS346 (9.1 mg kg−1), resulting in low background-corrected Se signals (<1,000 cps).
The transient signals obtained with 100- and 150 μm ablation spot diameters showed a pronounced decrease in ion signal intensity by a factor of about 6 and 3, respectively, over an ablation period of 200 s due to the formation of a strong V-shaped crater. The element ratios of matrix elements are stable within 6%. However, to compensate for the well-known trace elemental heterogeneity in some of the Table 1 Measured isotopes
Quadrupole resolution Isotopes
Standard resolution (∼0.7 amu peak width) 11
B,13C,66Zn,67Zn,69Ga,71Ga,75As,77Se,78Se,82Se,90Zr,91Zr,107Ag,109Ag,110Cd,
115
In,118Sn,119Sn,121Sb,126Te,128Te,181Ta,182W,203Tl,205Tl,206Pb,207Pb,208Pb,209Bi Increased resolution (∼0.2- to 0.3 amu peak width) 27
Al,46Ti,49Ti,51V,52Cr,53Cr,55Mn,57Fe,59Co,60Ni,61Ni,93Nb,95Mo,97Mo
Ablation spot diameter, µm
80 100 120 140 160 180 200 220 240 260 118 Sn sensitivity, cps (mg kg -1) -1 200 300 400 500 600 700 52Cr sensitivity, cps (mg kg -1 ) -1 1000 1200 1400 1600 1800 2000 2200
Fig. 1 Dependence of the 52Cr sensitivity (circles) and the 118Sn sensitivity (triangles) on the ablation spot diameter for BCS346 (2 mJ laser pulse energy, 10 Hz laser repetition rate, mean value of five different line scanning ablations)
samples, longer sampling was required and therefore large ablation spot diameters of 250μm were applied. Thereby, the formation of V-shaped craters was circumvented and stable ICP-MS analyte signals were obtained.
Table 2 lists the measured elemental concentration in BCS346 (nickel base alloy) and ECRM295-1 (highly alloyed steel). Both materials were used as external calibration standard and sample. 52Cr was used in both measurements as internal standard. The reason for using Cr as internal standard is based on the fact that the Fe concentrations are not certified within both materials. The results (Table2) were found in agreement with the certified values. It is interesting to note that for Al, V, and Co, the concentration difference between the calibration standard and the CRM used as sample was larger than three orders of magnitude. The close agreement of the results for these elements with the certified values proves the high linear dynamic range of the calibration function as well as the applicability of the gas blank background correction when not having a real blank sample. Both must be regarded as an essential prerequisite for quantitative analysis using LA-ICP-MS.
Line scanning experiments
The selection of the ablation site for single hole drilling was found to be time-consuming as the embedded metal chip CRMs were often too thin after polishing to allow prolonged single hole drilling experiments. Therefore, line scanning ablation was investigated.
Figure 2 shows the dependence of the 52Cr and the 118
Sn signal (mean value of five different line scanning
ablations) on the speed of the line scanning. For scan speeds between 1 and 10 μm s−1, no significant change in the52Cr intensity was observed. When the scan speed was further increased to 40μm s−1, the analyte signal decreased by 20%. Similar behavior was observed for the other analytes (data not shown), which indicates that the reduction of signal intensity is not caused by ICP mass load effects and possibly more related to aerosol transport phenomena.
The temporal relative standard deviations (TRSD) of 52
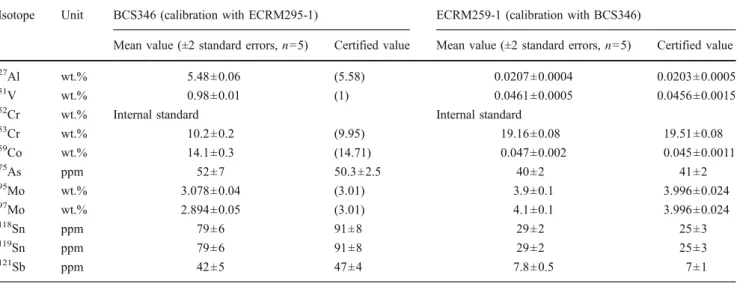
Cr and 60Ni in BCS346 were determined to be stable better than 5% when applying line scanning mode for sampling. However, for some trace elements, larger signal Table 2 Analysis of BCS346 and ECRM295-1 using hole drilling ablation and matrix-matched calibration with ECRM295-1 and BCS346, respectively
Isotope Unit BCS346 (calibration with ECRM295-1) ECRM259-1 (calibration with BCS346)
Mean value (±2 standard errors, n=5) Certified value Mean value (±2 standard errors, n=5) Certified value
27
Al wt.% 5.48±0.06 (5.58) 0.0207±0.0004 0.0203±0.0005
51
V wt.% 0.98±0.01 (1) 0.0461±0.0005 0.0456±0.0015
52
Cr wt.% Internal standard Internal standard
53 Cr wt.% 10.2±0.2 (9.95) 19.16±0.08 19.51±0.08 59 Co wt.% 14.1±0.3 (14.71) 0.047±0.002 0.045±0.0011 75 As ppm 52±7 50.3±2.5 40±2 41±2 95 Mo wt.% 3.078±0.04 (3.01) 3.9±0.1 3.996±0.024 97 Mo wt.% 2.894±0.05 (3.01) 4.1±0.1 3.996±0.024 118Sn ppm 79±6 91±8 29±2 25±3 119Sn ppm 79±6 91±8 29±2 25±3 121Sb ppm 42±5 47±4 7.8±0.5 7±1
52Cr was used as internal standard. Values in parentheses are informative non-certified values. Only values of elements certified in both calibration
standards are presented
Scan speed, mm s-1
0.00 0.01 0.02 0.03 0.04 0.05
52Cr Signal after background subtraction, cps
0 1e+6 2e+6 3e+6 4e+6 5e+6 6e+6 7e+6 118 Sn Si g
nal after back
g round subtraction, cps 1200 1300 1400 1500 1600 1700 1800 1900 2000
Fig. 2 Dependence of the52Cr signal (circles) and the118Sn signal (triangles) on the scan speed (250 μm ablation spot diameter, 2 mJ laser pulse energy, 10 Hz laser repetition rate, mean value of five different line scanning ablations) on JK37
fluctuations were encountered. Whereas 118Sn was deter-mined with a TRSD of 7%, the TRSD for75As and 208Pb was 14% and 36%, respectively. These differences are explainable by the metallurgical properties of these ele-ments. For example, the solubility of Sn within the metal matrix is low, whereas As and especially Pb are pushed to the grain boundaries during solidification. Therefore, it is understandable that Pb is more heterogeneously distributed within the sample, resulting in larger signal fluctuations when compared to the major elements. This effect was observed in all CRMs where the Pb concentration was above 30 mg kg−1. It is interesting to note that for lead concentrations below 20 mg kg−1, only TRSDs below 10% were observed.
The scan speed optimization was performed on a CRM in the shape of a solid disc (JK37). Constrained by the size of the epoxy-embedded metal chips (0.5–1 mm), a scan speed of 2 μm s−1 was used for the analysis of all samples.
Quantitative analysis using non-matrix-matched calibration materials
The quantification capabilities for major, minor, and trace elements using non-matrix-matched calibration standards was investigated using SRM610 (silicate glass) [17,19,20]. This quantification procedure can be considered as an extreme case of non-matrix-matched calibration since the material properties should lead to significantly different amounts of ablated material when using the same fluence and should also influence the particle size distribution, which is critical for complete vaporization of the material within the ICP. Nevertheless, this approach is not only of academic interest but could also provide quantitative elemental information for elements (due to the large number of elements contained in SRM610) that are beyond the focus of today’s steel CRM production.
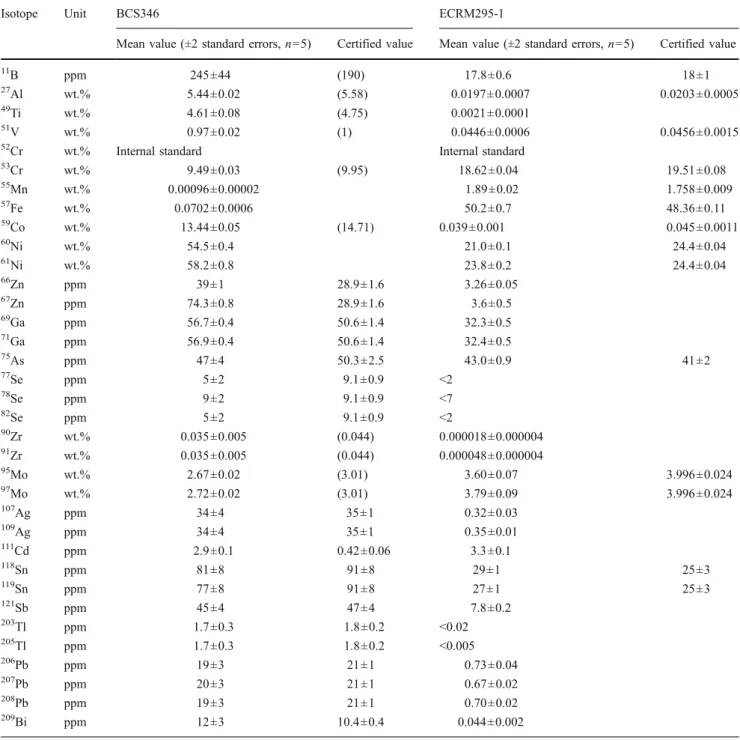
Table 3 lists the measured elemental concentration in BCS346 and ECRM295-1. The measurements were per-formed in line scanning mode using 250μm-wide ablation spots.52Cr was used as internal standard. Deviations by a factor of 2 and larger between the certified and the measured values were observed for 67Zn and 111Cd. In both cases, significantly higher element concentrations were measured, which can be explained by interferences from 51V16O for 67Zn and 95Mo16O for 111Cd. A simple mathematical correction of the67Zn and111Cd signals was not possible due to the fact that51V and95Mo signals had to be acquired at increased mass filter resolution (custom resolution). Furthermore, for 66Zn, higher values than the certified were obtained due to the interference by50V16O. Another example of an oxide interference is the determined Ni content in ERCM295-1 using 60Ni. The 44Ca16O
interference formed in SRM610 leads to an underestimation of the60Ni, whereas the61Ni is in good agreement with the certified value. Most interesting are the results for As, Ag, Sn, Sb, Tl, Pb, and Bi. These elements are typically considered as fractionating elements in ns-LA. However, the results in Table3demonstrate that the generated aerosol is representative for glass and steel samples because most of these elements are in good agreement with the certified values. Furthermore, the sum of all determined elements was 91.3% for BCS346 and 95.5% for ECRM295-1 when using the same isotopes as reported in Table4. Therefore, a 100% normalization approach for calibration could also be used for unknown samples, eliminating the need of an internal standard.
Furthermore, it can be concluded that the isotope selection, when using non-matrix-matched calibration, becomes more critical. Oxide interferences must be taken into account and are in most cases more critical than the typically reported matrix effects. In most cases, a sector field ICP-MS would help solve the interference problems. Nevertheless, non-matrix-matched calibration using a sili-cate glass provides inferior accuracy compared to a calibration with metallic standards, but provides an alter-native quantification approach. Different aerosol particle size distributions as reported in [17] can be excluded as a major source of uncertainty.
Matrix-matched quantitative analysis
For the matrix-matched calibration approach, BCS346 and ECRM295-1 were used as calibration standards. The sampling was carried out using the line scanning ablation mode. A complete list of all measured element concen-trations in all CRMs is provided asESM.52Cr was used as internal standard except for CRMs were no certified value for chromium was given. In these cases, either51V or55Mn was used as internal standard. Fe was excluded as internal standard due to the fact that the concentration of this element was certified only in few CRMs.
The determined element concentrations are in general in good agreement with the certified values. The quantifica-tion of low Al concentraquantifica-tions (<0.005%) was hampered by the low signal intensity caused by the increased quadrupole resolution. However, due to different ablation efficiencies between the materials, even 0.0032 wt.% Al were success-fully quantified for ECRM231-2. When using BCS346 as calibration standard, a significantly lower boron concentra-tion was determined compared to the calibraconcentra-tion with ECRM295-1. Although boron is not certified in BCS346, the certificate states a similar major element composition than in BCS345 (B certified, 190±20 mg kg−1). With the exception of SRM1261a and SRM1263a, all determined boron values do not deviate from the certified values within
the uncertainty of the measurement when using ECRM295-1 for calibration.
Although scanning ablation mode and large ablation crater diameters were selected to achieve long and stable ablation signals, TRSDs of Pb and Bi were rather large
(maximum found in SRM1264a: 46% for 208Pb and
209
Bi) compared to the other trace elements investigated (TRSD below 10% for element concentrations >5 mg kg−1). This trend was observed in all CRMs where the Pb
concentration exceeded ∼20 mg kg−1 and the Bi concen-tration exceeded∼5 mg kg−1and independent of the large variety of main element composition in the investigated CRMs. For Cd, Ga, Sb, Sn, Te, Tl, and Zn, no concentration dependence of the TRSD values was encountered. The variation of the TRSDs for Ag and As were found in several CRMs larger than 10%, although no correlation to the matrix constituents or the concentration was found.
Table 3 Analysis of BCS346 and ECRM295-1 using a non-matrix-matched calibration with SRM610 (silicate glass)
Isotope Unit BCS346 ECRM295-1
Mean value (±2 standard errors, n=5) Certified value Mean value (±2 standard errors, n=5) Certified value
11 B ppm 245±44 (190) 17.8±0.6 18±1 27 Al wt.% 5.44±0.02 (5.58) 0.0197±0.0007 0.0203±0.0005 49 Ti wt.% 4.61±0.08 (4.75) 0.0021±0.0001 51 V wt.% 0.97±0.02 (1) 0.0446±0.0006 0.0456±0.0015 52
Cr wt.% Internal standard Internal standard
53 Cr wt.% 9.49±0.03 (9.95) 18.62±0.04 19.51±0.08 55 Mn wt.% 0.00096±0.00002 1.89±0.02 1.758±0.009 57 Fe wt.% 0.0702±0.0006 50.2±0.7 48.36±0.11 59Co wt.% 13.44±0.05 (14.71) 0.039±0.001 0.045±0.0011 60Ni wt.% 54.5±0.4 21.0±0.1 24.4±0.04 61Ni wt.% 58.2±0.8 23.8±0.2 24.4±0.04 66Zn ppm 39±1 28.9±1.6 3.26±0.05 67Zn ppm 74.3±0.8 28.9±1.6 3.6±0.5 69 Ga ppm 56.7±0.4 50.6±1.4 32.3±0.5 71 Ga ppm 56.9±0.4 50.6±1.4 32.4±0.5 75 As ppm 47±4 50.3±2.5 43.0±0.9 41±2 77 Se ppm 5±2 9.1±0.9 <2 78 Se ppm 9±2 9.1±0.9 <7 82 Se ppm 5±2 9.1±0.9 <2 90 Zr wt.% 0.035±0.005 (0.044) 0.000018±0.000004 91 Zr wt.% 0.035±0.005 (0.044) 0.000048±0.000004 95 Mo wt.% 2.67±0.02 (3.01) 3.60±0.07 3.996±0.024 97 Mo wt.% 2.72±0.02 (3.01) 3.79±0.09 3.996±0.024 107 Ag ppm 34±4 35±1 0.32±0.03 109 Ag ppm 34±4 35±1 0.35±0.01 111 Cd ppm 2.9±0.1 0.42±0.06 3.3±0.1 118Sn ppm 81±8 91±8 29±1 25±3 119Sn ppm 77±8 91±8 27±1 25±3 121Sb ppm 45±4 47±4 7.8±0.2 203Tl ppm 1.7±0.3 1.8±0.2 <0.02 205Tl ppm 1.7±0.3 1.8±0.2 <0.005 206 Pb ppm 19±3 21±1 0.73±0.04 207 Pb ppm 20±3 21±1 0.67±0.02 208 Pb ppm 19±3 21±1 0.70±0.02 209 Bi ppm 12±3 10.4±0.4 0.044±0.002 52
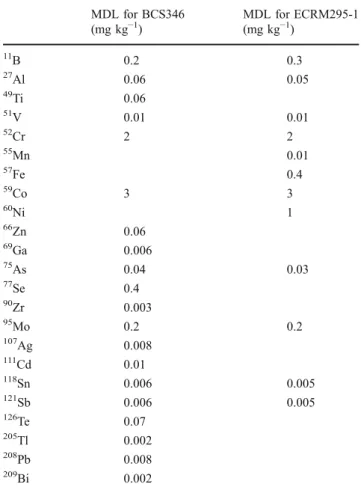
Table 4 reports typical method detection limits (MDL) for calibrations using BCS346 or ECRM295-1. As stated by Longerich et al. [9] in laser ablation, MDLs are calculated from the gas blank. Statistically significant MDL values are only attained if a sufficiently large number of estimates are used. The reported values are the median of 16 individual MDLs obtained over a period of several days. For elements certified in both calibration standards, a good agreement between the two MDLs was observed. The MDLs indicate that the parameters optimized within this study are sufficient for routine analysis of steels and alloys and exceed partially the capabilities of solution nebulization ICP-MS after dissolution.
Conclusion
The capabilities of fs-LA-ICP-MS for quantitative analysis of major, minor, and trace elements in steels (unalloyed, alloyed, and highly alloyed) and super alloys were investigated. Thirty-four CRMs sampled using line scan-ning ablation mode covered a wide range of steel matrix compositions. It was shown that by using a matrix-matched
calibration with a highly alloyed steel (ECRM295-1) and a nickel base alloy (BCS346), an excellent agreement between certified and determined value can be attained for a wide variety of elements, even when the difference in concentration between calibration standard and sample is several orders of magnitude.
Non-matrix-matched calibration using NIST SRM610 glass standard provided similar results in comparison to the matrix-matched calibration approach. The results indicate minimum fractionation between the two very different matrices. However, deviations between the certified and determined values encountered were caused by polyatomic and matrix interferences rather than differences in the stoichiometry of the fs laser-generated aerosols between the matrices. Furthermore, it is demonstrated that the analysis of two different matrices requires very careful selection of isotopes to avoid interferences.
Throughout this work, internal standardization with52Cr, 51
V, or 55Mn was applied. As the sum of all determined elements was found for all CRMs well above 90%, a 100% normalization approach can be expected to result in comparable results. Nevertheless, in industrial routine analysis, the concentration of the main elements will be known to the analyst almost always from other well-established direct solid sampling techniques, such as XRF. Therefore, fs-LA-ICP-MS could extend the range of elements which need to be determined in time critical processes and would shorten the response time signifi-cantly since an established procedure requires <60 s for one analysis.
Most of the CRMs used in this investigation are not qualified for microanalysis—and they were also not prepared for this purpose. The same also applies to “real samples.” We were well aware of these facts and therefore paid close attention to the structure of the ablation signals. As stated above, our aim was the quantification of analytes in the bulk material and the comparison of the attained values with the certified ones. We used a large number of CRMs to clearly and undoubtedly prove that neither the sample matrix must be closely matched to the calibration standard matrix nor that sample heterogeneity causes significant deviations from the certified values. Only successful validation of the method for bulk analysis provides the necessary confidence and justification for the application of this method for microanalysis. The poten-tial heterogeneity of the used CRMs should not be considered a problem for the method but rather an overcome challenge. Furthermore, in the context of steel analysis, LA-ICP-MS should not be called “semiquanti-tative” anymore.
Acknowledgments The authors wish to acknowledge the support of Boehler Edelstahl GmbH, Kapfenberg, Austria.
Table 4 MDL for calibrations with BCS346 or ECRM295-1 MDL for BCS346 (mg kg−1) MDL for ECRM295-1 (mg kg−1) 11 B 0.2 0.3 27 Al 0.06 0.05 49 Ti 0.06 51 V 0.01 0.01 52 Cr 2 2 55 Mn 0.01 57 Fe 0.4 59 Co 3 3 60 Ni 1 66 Zn 0.06 69 Ga 0.006 75 As 0.04 0.03 77 Se 0.4 90 Zr 0.003 95Mo 0.2 0.2 107Ag 0.008 111Cd 0.01 118Sn 0.006 0.005 121Sb 0.006 0.005 126 Te 0.07 205 Tl 0.002 208 Pb 0.008 209 Bi 0.002
References
1. Melford DA (1966) J Iron Steel Inst 204:495 2. Zou Z, Grinder O (1982) Scand J Metall 11:79–84
3. Mayer G, Clark CA (1974) Metall Mater Technol 116:491–501 4. Wiltsche H, Brenner IB, Prattes K, Knapp G (2008) J Anal At
Spectrom 23:1253–1262
5. Montaser A, Golightly DW (1992) Inductively coupled plasmas in analytical atomic spectrometry, 2nd edn. VCH, New York 6. Wiltsche H, Brenner IB, Knapp G, Prattes K (2007) J Anal At
Spectrom 22:1083–1088
7. Burke KE (1972) Analyst 97:19–28
8. Koch J, Wälle M, Pisonero J, Günther D (2006) J Anal At Spectrom 21:932–940
9. Longerich HP, Jackson SE, Günther D (1996) J Anal At Spectrom 11:899–904
10. LAMTRACE 2.16, Jackson SE (2005) Department of Earth and Planetary Sciences, Macquarie University, Australia
11. Günther D, Hattendorf B (2005) Trends Anal Chem 24(3):255– 265
12. Granfors G, Gustavsson I (2001) J Anal At Spectrom 16:1439– 1441
13. Coedo AG, Dorado T (1995) J Anal At Spectrom 10:449–453 14. Yasuhara H, Okano T, Matsumura Y (1992) Analyst 117:395–399 15. Usero R, Coedo GA, Dorado MT, Padilla I (2009) Appl
Spectrosopy 63:859–864
16. Russo RE, Mao XL, Gonzalez JJ, Mao SS (2002) J Anal At Spectrom 17:1072–1075
17. Mozna V, Pisonero J, Hola M, Kanicky V, Günther D (2006) J Anal At Spectrom 21:1194–1201
18. Heinrich CA, Pettke T, Aigner-Torres M, Audetat A, Günther D, Hattendorf B, Bleiner D, Guillong M, Horn I (2003) Geochim Cosmochim Acta 67(18):3473–3496
19. Bian Q, Garcia CC, Koch J, Niemax K (2006) J Anal At Spectrom 21:187–191
20. Bian Q, Koch J, Lindner H, Berndt H, Hergenröder R, Niemax K (2005) J Anal At Spectrom 20:736–740