In vivo Structural Imaging of the Cerebellum,
the Contribution of Ultra-High Fields
José P. Marques&Rolf Gruetter& Wietske van der Zwaag
Published online: 2 July 2010
# Springer Science+Business Media, LLC 2010
Abstract This review covers some of the contributions to date from cerebellar imaging studies performed at ultra-high magnetic fields. A short overview of the general advantages and drawbacks of the use of such high field systems for imaging is given. One of the biggest advantages of imaging at high magnetic fields is the improved spatial resolution, achievable thanks to the increased available signal-to-noise ratio. This high spatial resolution better matches the dimensions of the cerebellar substructures, allowing a better definition of such structures in the images. The implications of the use of high field systems is discussed for several imaging sequences and image contrast mechanisms. This review covers studies which were performed in vivo in both rodents and humans, with a special focus on studies that were directed towards the observation of the different cerebellar layers.
Keywords Structural MRI . Cerebellum . High field systems . Cerebellar layers . Dentate nucleus
Introduction
Cerebellar function is of major importance for our daily life, not only in movement control but also because of its
involvement in language and cognitive–emotional processing [1,2]. The cerebellar cortex can be affected by a number of neurologic and psychiatric diseases, such as stroke, tumors, autism, and schizophrenia [3,4], as well as genetic disorders like ataxias [1] and aceruloplasminemia [5, 6] where layer-dependent variations in iron deposition have been demonstrated using histology [7]. Thus, it is important that non-invasive methods delivering precise anatomical images of the cerebellar cortical architecture are available to provide markers for diagnosis and follow-up of such pathologies. Such markers have so far been difficult to obtain, but developments in ultra-high field magnetic resonance imaging (MRI) show promising results.
This review will discuss the implications of the limited spatial resolutions achieved in conventional clinical scanners when imaging the cerebellum and cover some of the advantages offered and challenges posed by MR scanning at ultra-high fields. Currently, the term ultra-high field is used for static magnetic fields greater than 3 T. Recent anatomical studies of the cerebellar structure in vivo, both in rodents and humans, will also be presented.
Despite its biological importance, the cerebellum is a structure that has thus far received little attention compared with the rest of the brain. This lack of interest is even more prevalent in the medical imaging fields [8]. One of the reasons for this lack of attention, both from a functional and an anatomical standpoint, has been the inability of most in vivo imaging techniques to resolve the cerebellum properly. While the cerebral cortex can be parcellated on the basis of its architectonic heterogeneity [9], the cerebellum has the particularity of having a uniform cortex covering the whole cerebellum, despite functional, biochemical, and even some cellular heterogeneities [10–15]. Furthermore, this uniformly structured cortex has a thickness of approximately 0.5 mm in contrast with the 3–4 mm of normal adult cerebral cortex.
J. P. Marques (*)
:
R. Gruetter:
W. van der Zwaag Laboratory for Functional and Metabolic Imaging, Ecole Polytechnique Fédérale de Lausanne, Station 6,CH-1015 Lausanne, Switzerland e-mail: [email protected]
J. P. Marques
:
R. Gruetter:
W. van der Zwaag Department of Radiology, University of Lausanne, Lausanne, SwitzerlandMoreover, the human cerebellum is divided into approximate-ly 260 folia [16] in a fairly reduced volume, which makes their visualization virtually impossible in functional and anatomical MR imaging studies that, until recently, were limited to spatial resolutions of 3 and 1 mm, respectively. It is therefore not surprising that a significant fraction of studies about the role of the cerebellum in cognitive, affective, and motor tasks are still based on the study of deficits presented by patients with cerebellar lesions [17]. If imaging techniques with higher spatial resolution would be available, a structure that would certainly be of interest is the cerebellar cortical layering. It is in these cortical layers (inside-out: granular, Purkinje, molecular layer), that the integration of multiple cerebellar functions takes place. Although these layers have been identified in vitro as early as in the late nineteenth century [8], they have only recently been observed in vivo [18].
Most clinical brain imaging employing 3D acquisitions will naturally cover the cerebellum, even though it might not be the primary target organ. For example, the MPRAGE sequence [19] is a widely used T1-weighted sequence which provides good brain tissue contrast in clinically acceptable scan times. The T1-weighted images are particularly suitable for segmentation studies that profit from the strong contrast between CSF, gray and white matter, and the relatively uniformity of both gray and white matter in T1-weighted images. It should be noted that the good contrast observed is obtained with a penalty on image signal intensity, which limits the resolutions achievable in such studies to approximately 1 mm, insufficient to resolve the folia. However, over the last 10 years, such low resolution T1-weighted images have successfully supplied atlases of the gross cerebellar anatomy (lobules, folia, fissures) [20–22]. The clinically obtained resolutions are sufficient to perform some parcellation of the cerebellum with human interaction using the main fissures as landmarks [20]. Up to 28 compartments have been identified in this fashion [22]. Such semi-automatic forms of parcellation have been used to obtain probabilistic maps of the cerebellum that, when used with care, can serve as a reference for lobular assignment of activation in normalized fMRI group data. Another application that has found some attention has been volumetry of the cerebellum as a whole in different pathologies such as epilepsy and ataxias [23–28].
Recently, studies of anatomical relevance have been performed using diffusion tensor [29] and diffusion spectrum imaging [30]. Using such techniques, the researchers have probed the cerebellar white matter connectivity by observing preferential directions of water diffusion within white matter together with probabilistic tractography methods. In the first study, a comparison between the cortico-ponto-cerebellar system and its organization in humans and macaques was performed. This confirmed the dominant contribution of the
cortical motor areas to the macaque monkey cerebral peduncle. However, also, new anatomical evidence for a relatively large prefrontal contribution to the human cortico-ponto-cerebellar system was found in the cerebral peduncle, suggesting the selective evolution of prefrontal inputs to the human cortico-ponto-cerebellar system. The study by Granziera et al. was purely directed to the cerebellum and employed multiple surface coils and an improved sequence acquisition scheme to thoroughly study of the connections between different cerebellar nuclei at a 2.2 mm isotropic spatial resolution.
Properties of Ultra-High Field MR Imaging
From a physics point of view, it is known that the signal available for MR imaging increases quadratically with the main static magnetic field, B0. For various reasons, the observed improvement in the obtained image and spectroscopic signal-to-noise ratio (SNR) tends to be approximately linear with the increase of the magnetic field strength [31, 32]. This linear increase in SNR has been one of the main driving forces behind the search for scanners with ever higher static magnetic fields in both clinical and research environments. Today, 3 T magnets are ever more common in clinical environments and even 7 T human scanners are becoming a highly sought-after research tool with over 40 installations worldwide to date. The resulting increase in signal strength is typically used by clinicians to reduce the scanning time (in theory, a factor of four reduction in acquisition time can be obtained by doubling the field strength) and by researchers to increase the spatial resolution of the images in order to observe finer anatomic detail in structural imaging [33,34] or smaller functional areas [35–37].
Moving to higher static magnetic fields, B0, requires the adaptation of the acquisition protocols because of the changes in the relaxation parameters T1 and T2. Typically, with the increase of B0, T1 increases while T2 and T2* decrease. The decrease in T2 and T2* implies that the sampling has to be performed faster to prevent full signal decay during detection, but, fortunately, this can also result in shorter acquisition times (if the scanner hardware permits) and improved contrast [38]. The longer T1may necessitate longer repetition times and thus acquisition times, but can also be beneficial in the case of T1-based sequences such as perfusion-weighted imaging. Several drawbacks when using higher field systems exist, of which transmit RF inhomoge-neity and increased energy deposition are most important for in vivo structural imaging. In the case of human imaging at 7 T, the radio frequency (RF) wavelength used to excite the sample in MRI is of the order of magnitude of the human brain itself, approximately 13 cm. This results in severe inhomogeneity of the RF field, meaning that signal excitation
can be as much as twofold less efficient in some areas than in others. A typical excitation pattern at 7 T, when using a standard volume coil, consists of a bright central area with peripheral low-intensity regions [39]. The energy deposition of a given sequence will increase quadratically with field strength, while the safety limits for energy deposition per mass for human imaging are fixed [40]. This presents a serious limitation for the use of RF-intensive sequences at high fields such as fast spin echo [41,42].
One of the sequences that benefits most from moving to ultra-high fields is the gradient echo (also known as FLASH) which yields both T2
*
-weighted magnitude and phase contrast and, at high fields, has been extensively used by a variety of groups to detect additional anatomical information to that provided by the conventionally used T1-weighted contrast [33, 43, 44]. A popular method employing a combination of phase and magnitude information which has also been used at lower fields is known as susceptibility weighted imaging (SWI) [43]. The contrast observed in T2*-weighted magnitude images has been used for a long time to visualize iron-rich regions, while the phase contrast associated to those acquisitions has historically been discarded. Only recently, it was observed that the phase image itself had enough information to, for example, distinguish white and cortical gray matter [45]. As this technique was taken to ultra-high field (>3 T) [33], it was demonstrated that it not only allowed distinction of brain tissues but also the observation of cortical substructures, for example the stria of Gennari within the visual cortex and the different layers within the gray matter of the motor cortex, as well as many known white matter fiber bundles. Furthermore, Duyn et al. [33] demonstrated that the contrast observable for many tissues in the phase images was superior to that observed in the concomitant magnitude images and showed that the sub-cortical contrast observed in both T2*magnitude and phase images was superior to that available in conventional T1-weighted images. These observations further increased the interest of the scientific community in phase imaging at ultra-high fields. Phase imaging is particularly suitable to high field studies as it takes only a small penalty from the biggest limitations of these systems, namely the previously mentioned inherent inhomogeneous transmit RF field and high-energy deposition. The first results in a non-uniform SNR distribution across the images but not in changes in contrast, and the second is largely circumvented by the use of small flip angles. On the other hand, phase imaging takes advantage of the improved SNR available at high field and the fact the phase changes increase linearly with the magnetic field strength. One of the biggest limitations of phase imaging is that the sensitivity to the tissue contrast, which is optimal when the echo time is equal to the average T2*of the tissues of interest, comes at a cost of high sensitivity to the B0 field inhomogeneity generated by air-tissue interfaces. This
entails the need of post-processing steps that try to remove large-scale effects (typically of the order of magnitude of the object being imaged) [33, 46, 47]. These processing steps make quantitative analysis of phase imaging unreliable, and despite all efforts, phase imaging is often poor close to air-tissue boundaries. Nevertheless, the improved contrast of phase imaging has recently been successfully used to assist in the detection of multiple sclerosis lesions [48,49], and many more applications can be foreseen.
Contributions of Ultra-High Field to Rodent Cerebellum Imaging
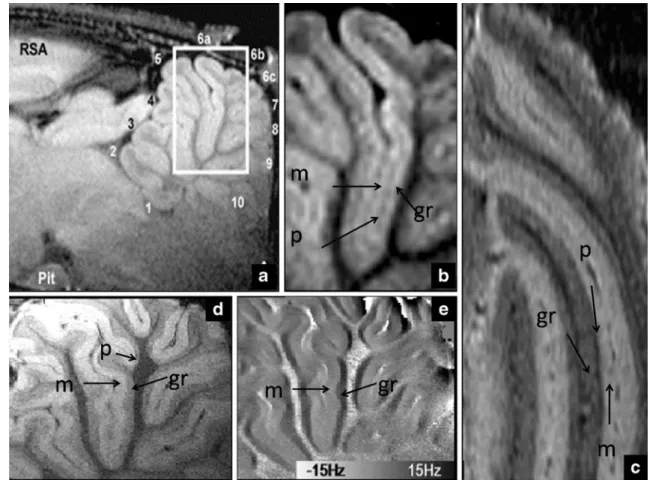
The highest magnetic fields available to perform in vivo imaging are designed for small animal imaging because, from a technological point of view, it is easier and cheaper to produce smaller-size high field systems, which have a limited usable space inside the magnet bore. In such systems, rodents are imaged under the effect of anesthesia and are kept fixed using stereotaxic holders and can be scanned for hours [50] without significant motion. It should therefore not come as a surprise that it was in such systems that the first in vivo observations of the cerebellar cortex were done. The first observation of the different layers was done by Aoki et al. [51] using manganese-enhanced MRI (MEMRI). In this technique, manganese is administrated intravenously to the animal model. MEMRI has raised much interest in the past years because of its ability to enhance the MR signal of regions rich in (or with active) voltage-gated calcium channels, where the manganese is taken up. The signal enhancement is observed because of the paramagnetic properties of manganese, which shortens the longitudinal relaxation times (T1) of the tissue in which it is present. Typically, the maximum contrast is observed 24 h after injection. In the mentioned paper [51], it was possible to observe, using T1-weighted images acquired at 11.7 T, with an in-plane resolution of 50 μm, different hippocampal fields, gray matter layers, and the cerebellar cortical layers (see Fig. 1b). This observation is in good agreement with histochemical staining of the cerebellum [52,53], where a high concentration of calcium channels in the cerebellum was found, especially in the granule layer. Two recent studies [54,55] showed that it was possible to observe those same structures using the endogenous tissue contrast associated with the magnetic susceptibility of the different tissues. The first study [55] made use of T2*and phase contrast available at 14 T to image the cerebellum with an in-plane resolution of 33 μm. In both magnitude and phase images acquired with the same acquisition, the granule and molecular layer were clearly discernible (see Fig. 1d, e) while the Purkinje cell layer was more elusive (possibly due to the relatively large slice thickness of
0.5 mm). In the other study [54], it was shown that, using T2 contrast obtained with a fast spin echo sequence at 9.4 T, it was possible to visualize all three cortical layers of the cerebellum. The authors hypothesize that the contrast observed might be related to either the different myelination of cell and cell density of the different structures as both this mechanisms are known to restrict water diffusion [54].
Contributions of Ultra-High Field to Human Cerebellum Imaging
Not all the contrast mechanisms explored in the context of animal imaging can be directly translated to human studies. MEMRI [51] is a technique that has quickly been employed by various groups in the animal imaging field but manganese, in the concentrations needed to observe sufficient contrast, is highly toxic and can induce, among other effects, heart complications. Therefore, it cannot be used in humans. Fast spin echo sequences have so far failed
to have any significant impact in human high field scanners because of two main reasons, each one associated to the two drawbacks of high field systems mentioned earlier: (1) fast spin echo sequences rely on large numbers of RF pulses, therefore the transmit field inhomogeneities are enhanced and make the contrast observed too dependent on the position within the brain; (2) fast spin echo sequences are very intensive sequences in terms of energy deposited in the subject, due to the aforementioned large number and high amplitude of its pulses. This last constraint severely limits the number of slices that can be acquired within an acceptable acquisition time.
From the methodologies brought forward in the animal imaging community to observe cerebellar cortical layers, only the contrast arising from magnitude and phase images in conventional gradient echo images can be directly translated into human studies. This has successfully yielded images of the cerebellum in which layers were visible [18]. Figure 2 shows some of the main observations in a recent study where T2*and phase imaging at 7 T were used to obtain high-resolution images of the cerebellum. The
Fig. 1. In vivo MR images of the cerebellum cortical layers of the rat (adapted with permission from Elsevier) from the manganese-enhanced MRI study at 11.7 T (a, b by Aoki et al. [51], Neuroimage, 2004), T2*and phase contrast at 14 T (d, e by Marques et al. [55],
Neuroimage, 2009) and fast spin echo images at 9.4 T (c by Boretius
et al. [54], Neuroimage, 2009). The molecular layer (m), Purkinje cell layer (p), and granule layer (gr) can be seen in all the different acquisitions. For more details regarding the different acquisitions, refer to the original papers
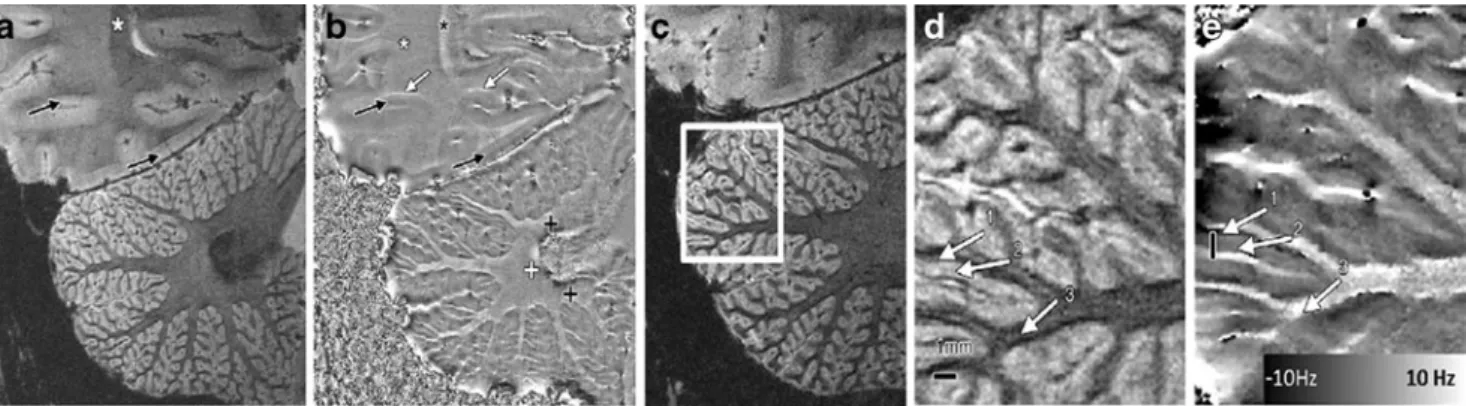
magnitude and phase images from slices crossing the dentate nucleus, which is well-known to have a high iron concentration [8], are shown in Fig. 2a, b. As a consequence of its high iron concentration, the dentate nucleus is hypo-intense in T2*-weighted magnitude images. In the phase images, the dentate nucleus appears dominated by noise (as would be expected because of the lack of signal in the magnitude image) while surrounding it, a magnetic dipole-like effect is visible. This magnetic dipole is characterized by a positive phase shift above and below the nucleus along the B0direction and a negative phase shift surrounding the nucleus in the plane perpendicular to the main static magnetic field. This pattern was consistently detected in the various subjects, and this observation confirms the high iron concentration attributed to the dentate nucleus [8].
To be able to visualize the cerebellar cortical layers with the 2D methodology suggested in [18] (with an in-plane resolution of 0.12 mm and slice thickness of 1 mm), it was crucial to have the slice orientation perpendicular to the cerebellar structures. By carefully adjusting the slice
orientation and analyzing the data obtained (Fig. 2c), it was possible to determine regions where the white/gray matter boundaries remained constant in the through-slice direction, and the cerebellar cortex was thus perpendicular to the slice direction. Magnitude and phase images of such regions of interest (Fig. 2d, e) show white matter bundles conveying into the cerebellar folium that appear dark in the magnitude images and bright in the phase image. Cerebellar cortex appeared brighter in the magnitude images and darker in the phase images, when compared with the white matter. Within the cerebellar cortex, two layers, granule and molecular, were distinguishable, mainly due to the phase contrast, with the granule layer having a strong positive frequency shift compared with the molecular layer. Both the magnitude and the phase contrast between those two layers as observed in vivo in humans was consistent with that observed in the rat brain (Fig.1c, d) [55], in agreement with the known higher iron content of granule layers.
Recently, the improvement of T2 *
-weighted imaging and SWI brought by 7 T over 1.5 T MR scanners was shown in
Fig. 2. High-resolution magnitude (a, c, d) and phase (b, e) GRE data from one volunteer (31-year-old male) with the slices crossing the dentate nucleus. Phase images show the expected dipole shape surrounding the dentate nucleus, which is a structure known to have a high iron concentration. Black and white crosses indicate the positive and negative lobes of the dipole shape. White arrows in b point out negative frequency shifts in regions superior to gray/white matter interfaces. Black arrows point to observable cortical gray
matter structures, while the black asterisks show regions where white matter bundles are observable both in magnitude and phase images. The white square in c indicates the positioning of the magnitude image shown in d and the phase image in e. Arrows indicate the granule layer (1), molecular layer (2), and white matter (3), respectively. The black lines in subfigures d and e have 1 mm length. (Figures adapted with permission from Marques, et al. [55] Radiology 2010;254:942–948)
Fig. 3. Coronal (a), sagittal (b), and transverse (c) cut of a cerebellum of a 30-year-old female volunteer acquired at 7 T with an MP2RAGE sequence with an isotropic resolution of 0.6 mm, showing good delineation
of the folia. The acquisition parameters were MP2RAGETR=5 s, TI1/TI2=
0.7/2.2 s,α1/α2=4/5°. No parallel imaging acceleration was used. Total
imaging of a dysplastic cerebellar gangliocytoma [56]. In this study, it was shown that, at ultra-high magnetic fields that emphasize susceptibility effects, the visualization of peri-tumoral veins was enhanced, and it was possible to better observe the compression of the dentate nucleus by the dysplasia mass.
It is well-known that T1-weighted images provide good contrast between white and gray matter (as has been mentioned earlier), but yield very poor contrast for iron-rich regions within white matter (such as the substantia nigra and red nucleus). Similarly, in the cerebellum, T1-weighted images, despite the strong contrast between cortex and white matter, fail to visualize a remarkable iron-rich region such as the dentate nucleus. As an example, Fig. 3 shows three different sections through a cerebellum of a healthy subject scanned at 7 T using a recently proposed sequence MP2RAGE (information regarding the acquisition protocol can be found in the legend of Fig.3) [57]. The MP2RAGE sequence provides“pure” T1contrast and, thanks to its low sensitivity to RF field inhomogeneities [57,58], is ideal for use in setups employing surface coils and/or high field systems. With such a pure T1contrast, even differences in T1 between the occipital and cerebellar white matter can be observed. In Fig.3, the occipital white matter appears brighter than cerebellar white matter. Another clear observation from this figure is that, due to the high resolution achievable at high field (0.6 mm isotropic in the case of Fig.3), the various folia can easily be distinguished. On the other hand, because the contrast in these images is completely independent from T2*, the dentate nucleus is undetectable even though it can often be seen in conventional MPRAGE images, where some degree of T2*-weighting exists.
Conclusion
As ultra-high field scanners become more common in research facilities throughout the world, it is expected that more imaging sequences will be available that take full advantage of the potential advantages, while circumventing the constraints, of high field systems. The integration of new hardware such as multi-channel transmission will significantly reduce the RF inhomogeneity either thanks to RF-shimming or parallel-transmit techniques [59–62]. Such approaches will allow sequences with different contrasts, such as T2- and diffusion-weighted imaging, which are thus far not employed for cerebellum imaging at ultra-high field, to better use the increased signal available at higher magnetic fields. Exploring such new contrasts may allow moving to in vivo visualization of the different cerebellar nuclei.
In this review, most of the data presented was obtained using surface coils, and studies were targeted to image the cerebellum. As multiple channel coils and parallel imaging
[63] become more widely available, studies using isotropic resolutions of ~0.5–0.6 mm covering the whole brain will become more common. Such high-resolution whole brain images will allow researchers to have access to more data of both healthy and pathological subjects, and it is expected that we will soon be looking to more detailed atlases of the cerebellum.
In conclusion, it is clear that high field systems can contribute considerably towards better cerebellum imaging, both structural and functional. The improved resolution achievable at high magnetic fields, which better matches the cerebellum geometry, will make our understanding of the cerebellar structure and function more based on imaging evidence and less on clinical pathology.
Acknowledgements The authors would like to thank Prof. Ichio Aoki and Dr. Sussan Boretivs for generously providing the originals of their published figures. This work was supported by the Centre d'Imagerie BioMédicale (CIBM) of the UNIL, UNIGE, HUG, CHUV, EPFL, and the Leenaards and Jeantet Foundations.
References
1. Schmahmann JD. Disorders of the cerebellum: ataxia, dysmetria of thought, and the cerebellar cognitive affective syndrome. J Neuropsychiatry Clin Neurosci. 2004;16(3):367–78.
2. Schmahmann JD, Caplan D. Cognition, emotion and the cerebellum. Brain. 2006;129(Pt 2):290–2.
3. Schmahmann JD, Weilburg JB, Sherman JC. The neuropsychiatry of the cerebellum—insights from the clinic. Cerebellum (London, England). 2007;6(3):254–67.
4. Steinlin M. Cerebellar disorders in childhood: cognitive problems. Cerebellum (London, England). 2008;7(4):607–10.
5. Grisoli M, Piperno A, Chiapparini L, Mariani R, Savoiardo M. MR imaging of cerebral cortical involvement in aceruloplasminemia. Ajnr. 2005;26(3):657–61.
6. Stankiewicz J, Panter SS, Neema M, Arora A, Batt CE, Bakshi R. Iron in chronic brain disorders: imaging and neurotherapeutic implications. Neurotherapeutics. 2007;4(3):371–86.
7. Patel BN, Dunn RJ, Jeong SY, Zhu Q, Julien JP, David S. Ceruloplasmin regulates iron levels in the CNS and prevents free radical injury. J Neurosci. 2002;22(15):6578–86.
8. Voogd J. The human cerebellum. J Chem Neuroanat. 2003;26 (4):243–52.
9. Brodmann K. Vergleichende Lokalisationslehre der Grosshirn-rinde in ihren Prinzipien dargestellt auf Grund des Zellenbaues. Leipzig: J.A. Barth. 1909
10. Eccles JC. An instruction–selection theory of learning in the cerebellar cortex. Brain Res. 1977;127(2):327–52.
11. Marr D. A theory of cerebellar cortex. J Physiol. 1969;202(2):437–70. 12. Tyrrell T, Willshaw D. Cerebellar cortex: its simulation and the relevance of Marr's theory. Philos Trans R Soc Lond. 1992;336(1277):239–57. 13. Allen GI, Tsukahara N. Cerebrocerebellar communication systems.
Physiol Rev. 1974;54(4):957–1006.
14. Hawkes R, Blyth S, Chockkan V, Tano D, Ji Z, Mascher C. Structural and molecular compartmentation in the cerebellum. Can J Neurol Sci. 1993;20 Suppl 3:S29–35.
15. Dino MR, Mugnaini E. Distribution and phenotypes of unipolar brush cells in relation to the granule cell system of the rat cochlear nucleus. Neuroscience. 2008;154(1):29–50.
16. Manto M. The cerebellum, cerebellar disorders, and cerebellar research—two centuries of discoveries. Cerebellum (London, England). 2008;7(4):505–16.
17. Stoodley CJ, Schmahmann JD. Evidence for topographic organization in the cerebellum of motor control versus cognitive and affective processing. 2010 Cortex;46:831–44.
18. Marques JP, van der Zwaag W, Granziera C, Krueger G, Gruetter R. In vivo visualization of cerebellar cortical layers using structural high field MRI. Radiology. 2010; 254 doi:10.1148/radiol.09091136
(3):942–8.
19. Mugler JP III, Brookeman JR. Three-dimensional magnetization-prepared rapid gradient-echo imaging (3D MP RAGE). Magn Reson Med. 1990;15(1):152–7.
20. Schmahmann JD, Doyon J, McDonald D, Holmes C, Lavoie K, Hurwitz AS, et al. Three-dimensional MRI atlas of the human cerebellum in proportional stereotaxic space. Neuroimage. 1999;10(3 Pt 1):233–60.
21. Diedrichsen J. A spatially unbiased atlas template of the human cerebellum. Neuroimage. 2006;33(1):127–38.
22. Diedrichsen J, Balsters JH, Flavell J, Cussans E, Ramnani N. A probabilistic MR atlas of the human cerebellum. Neuroimage. 2009;46(1):39–46.
23. Burk K, Globas C, Wahl T, Buhring U, Dietz K, Zuhlke C, et al. MRI-based volumetric differentiation of sporadic cerebellar ataxia. Brain. 2004;127(Pt 1):175–81.
24. De Marcos FA, Ghizoni E, Kobayashi E, Li LM, Cendes F. Cerebellar volume and long-term use of phenytoin. Seizure. 2003;12(5):312–5.
25. Hagemann G, Lemieux L, Free SL, Krakow K, Everitt AD, Kendall BE, et al. Cerebellar volumes in newly diagnosed and chronic epilepsy. J Neurol. 2002;249(12):1651–8.
26. Joyal CC, Pennanen C, Tiihonen E, Laakso MP, Tiihonen J, Aronen HJ. MRI volumetry of the vermis and the cerebellar hemispheres in men with schizophrenia. Psychiatry Res. 2004;131 (2):115–24.
27. Schulz JB, Borkert J, Wolf S, Schmitz-Hubsch T, Rakowicz M, Mariotti C, et al. Visualization, quantification and correlation of brain atrophy with clinical symptoms in spinocerebellar ataxia types 1, 3 and 6. Neuroimage. 2010; 49(1):158–68.
28. Szabo CA, Lancaster JL, Lee S, Xiong JH, Cook C, Mayes BN, et al. MR imaging volumetry of subcortical structures and cerebellar hemispheres in temporal lobe epilepsy. Ajnr. 2006;27(10):2155–60.
29. Ramnani N, Behrens TE, Johansen-Berg H, Richter MC, Pinsk MA, Andersson JL, et al. The evolution of prefrontal inputs to the cortico-pontine system: diffusion imaging evidence from Macaque monkeys and humans. Cereb Cortex. 2006;16(6):811–8. 30. Granziera C, Schmahmann JD, Hadjikhani N, Meyer H, Meuli R,
Wedeen V, et al. Diffusion spectrum imaging shows the structural basis of functional cerebellar circuits in the human cerebellum in vivo. PLoS ONE. 2009;4(4):e5101.
31. Haacke M, Brown R, Thompson M, Venkatesan R, Haacke M, Brown R, et al. Magnetic resonance imaging: physical principles and sequence design: Wiley-Liss 1999.
32. Mekle R, Mlynarik V, Gambarota G, Hergt M, Krueger G, Gruetter R. MR spectroscopy of the human brain with enhanced signal intensity at ultrashort echo times on a clinical platform at 3 T and 7 T. Magn Reson Med. 2009;61(6):1279–85.
33. Duyn JH, Van Gelderen P, Li TQ, De Zwart JA, Koretsky AP, Fukunaga M. High-field MRI of brain cortical substructure based on signal phase. Proc Natl Acad Sci USA. 2007;104 (28):11796–801.
34. Thomas BP, Welch EB, Niederhauser BD, Whetsell WO Jr, Anderson AW, Gore JC, et al. High-resolution 7 T MRI of the human hippocampus in vivo. J Magn Reson Imaging. 2008;28 (5):1266–72.
35. van der Zwaag W, Marques JP, Hergt M, Gruetter R. Investigation of high-resolution functional magnetic resonance imaging by means of surface and array radiofrequency coils at 7 T. Magn Reson Imaging. 2009;27:1011–8.
36. Yacoub E, Harel N, Ugurbil K. High-field fMRI unveils orientation columns in humans. Proc Natl Acad Sci USA. 2008;105(30):10607–12.
37. Yacoub E, Shmuel A, Logothetis N, Ugurbil K. Robust detection of ocular dominance columns in humans using Hahn Spin Echo BOLD functional MRI at 7 Tesla. Neuroimage. 2007;37(4):1161–77. 38. van der Zwaag W, Francis S, Head K, Peters A, Gowland P,
Morris P, et al. fMRI at 1.5, 3 and 7 T: characterising BOLD signal changes. Neuroimage. 2009;47(4):1425–34.
39. Vaughan JT, Garwood M, Collins CM, Liu W, DelaBarre L, Adriany G, et al. 7 T vs. 4 T: RF power, homogeneity, and signal-to-noise comparison in head images. Magn Reson Med. 2001;46(1):24–30. 40. IEC. Medical electrical equipment—part 2–33: particular
require-ments for the safety of magnetic resonance equipment for medical diagnosis. 2008.
41. Hennig J, Weigel M, Scheffler K. Multiecho sequences with variable refocusing flip angles: optimization of signal behavior using smooth transitions between pseudo steady states (TRAPS). Magn Reson Med. 2003;49(3):527–35.
42. Weigel M, Hennig J. Contrast behavior and relaxation effects of conventional and hyperecho-turbo spin echo sequences at 1.5 and 3 T. Magn Reson Med. 2006;55(4):826–35.
43. Haacke EM, Xu Y, Cheng YCN, Reichenbach JR. Susceptibility weighted imaging (SWI). Magn Reson Med. 2004;52(3):612–8. 44. Li TQ, van Gelderen P, Merkle H, Talagala L, Koretsky AP, Duyn
J. Extensive heterogeneity in white matter intensity in high-resolution T2*-weighted MRI of the human brain at 7.0 T. Neuroimage. 2006;32(3):1032–40.
45. Rauscher A, Sedlacik J, Barth M, Mentzel HJ, Reichenbach JR. Magnetic susceptibility-weighted MR phase imaging of the human brain. Am J Neuroradiol. 2005;26(4):736–42.
46. Noll DC, Nishimura DG, Macovski A. Homodyne detection in magnetic resonance imaging. IEEE Trans Med Imaging. 1991;10(2):154–63. 47. Cheng YC, Neelavalli J, Haacke EM. Limitations of calculating
field distributions and magnetic susceptibilities in MRI using a Fourier-based method. Phys Med Biol. 2009;54(5):1169–89. 48. Hammond KE, Metcalf M, Carvajal L, Okuda DT, Srinivasan R,
Vigneron D, et al. Quantitative in vivo magnetic resonance imaging of multiple sclerosis at 7 Tesla with sensitivity to iron. Ann Neurol. 2008;64(6):707–13.
49. Mainero C, Benner T, Radding A, van der Kouwe A, Jensen R, Rosen BR, et al. In vivo imaging of cortical pathology in multiple sclerosis using ultra-high field MRI. Neurology. 2009;73(12):941–8. 50. Benveniste H, Blackband S. MR microscopy and high resolution
small animal MRI: applications in neuroscience research. Prog Neurobiol. 2002;67(5):393–420.
51. Aoki I, Wu YJL, Silva AC, Lynch RM, Koretsky AP. In vivo detection of neuroarchitecture in the rodent brain using manganese-enhanced MRI. Neuroimage. 2004;22(3):1046–59. 52. Serôdio P, Rudy B. Differential expression of Kv4 K + channel
subunits mediating subthreshold transient K + (A-type) currents in rat brain. J Neurophysiol. 1998;79(2):1081–91.
53. Strassle BW, Menegola M, Rhodes KJ, Trimmer JS. Light and electron microscopic analysis of KChIP and Kv4 localization in rat cerebellar granule cells. J Comp Neurol. 2005;484(2):144–55. 54. Boretius S, Kasper L, Tammer R, Michaelis T, Frahm J. MRI of cellular
layers in mouse brain in vivo. Neuroimage. 2009;47(4):1252–60. 55. Marques JP, Maddage R, Mlynarik V, Gruetter R. On the origin of
the MR image phase contrast: an in vivo MR microscopy study of the rat brain at 14.1 T. Neuroimage. 2009;46(2):345–52. 56. Moenninghoff C, Kraff O, Schlamann M, Ladd ME, Katsarava Z,
(Lhermitte-Duclos disease) with 7T MR imaging. Korean J Radiol. Mar;11(2):244–8.
57. Marques JP, Kober T, Krueger G, van der Zwaag W, Van de Moortele PF, Gruetter R. MP2RAGE, a self bias-field corrected sequence for improved segmentation and T-1-mapping at high field. Neuroimage. 2010;49(2):1271–81.
58. Van de Moortele PF, Auerbach EJ, Olman C, Yacoub E, Ugurbil K, Moeller S. T(1) weighted brain images at 7 Tesla unbiased for Proton Density, T(2) contrast and RF coil receive B(1) sensitivity with simultaneous vessel visualization. Neuroimage. 2009;46:432–46. 59. Ibrahim TS, Lee R, Baertlein BA, Abduljalil AM, Zhu H,
Robitaille PM. Effect of RF coil excitation on field inhomogeneity
at ultra high fields: a field optimized TEM resonator. Magn Reson Imaging. 2001;19(10):1339–47.
60. Hoult DI, Phil D. Sensitivity and power deposition in a high-field imaging experiment. J Magn Reson Imaging. 2000;12(1):46–67. 61. Hsu JJ, Glover GH. Mitigation of susceptibility-induced signal
loss in neuroimaging using localized shim coils. Magn Reson Med. 2005;53(2):243–8.
62. Katscher U, Bornert P, Leussler C, van den Brink JS. Transmit SENSE. Magn Reson Med. 2003;49(1):144–50.
63. Pruessmann KP, Weiger M, Scheidegger MB, Boesiger P. SENSE: sensitivity encoding for fast MRI. Magn Reson Med. 1999;42 (5):952–62.