f
Signal processing technique for
non-invasive real-time estimation of
cardiac output by inductance
cardiography (thoracocardiography)
\
G. B. Bucklar V. Kaplan K.E. Bloch
Pulmonary Division, Department of Internal Medicine, University Hospital of ZQrich, Switzerland
Abstract--Inductance cardiography (thoracocardiography) non-invasive/y monitors changes in stroke volume by recording ventricular volume curves with an inductive plethysmographic transducer encircling the chest at the level of the heart. Clinical application of this method has been hampered, as data analysis has not been feasible in real time. Therefore a novel, real-time signal processing technique for inductance cardiography has been developed. Its essential concept consists in performance of multiple tasks by several, logically linked signal processing modules that have access to common databases. Based on these principles, a software application was designed that performs acquisition, display, filtering and ECG-triggered ensemble averaging of inductance signals and separates cardiogenic waveforms from noise related to respiration and other sources. The resulting ventricular volume curves are automatically analysed. Performance of the technique for monitoring cardiac output in real time was compared with thermodilution in four patients in an intensive care unit. The bias (mean difference) among 76 paired thoracocardiographic and thermodilution derived changes in cardiac output was 0%; limits of agreement ( + 2 SD of the bias) were 4-25%. It is concluded that the proposed signal processing technique for inductance cardiography holds promise for non-invasive, real-time estimation of changes in cardiac output.
Keywords--lnductance cardiography, Thoracocardiography, Non-invasive cardiac monitoring, Stroke volume, Cardiac output, Real-time data analysis
Med. Biol. Eng. Comput., 2003, 41, 2,302-309
1 Introduction
INDUCTIVE PLETHYSMOGRAPHY is widely used in clinical medi- cine and research for monitoring ventilation using two transdu- cers placed around the ribcage and abdomen (SACKNER and KRIEGER, 1989). The transducer consists of an insulated wire arranged in a sinusoidal array within an elastic band. it represents the inductance element of an inductance-capacitance oscillator module that is stimulated by an alternating current source. Changes in the cross-sectional area enclosed by the transducer alter its self-inductance and, hence, the oscillation frequency. The latter is converted by demodulator and amplifier circuitry into an analogue or digital output that reflects changes in cross-sectional areas enclosed by the sensor (WATSON et al., 1988). After appropriate calibration, the sum of the rib cage and abdominal signals of the inductive plethysmograph reflects changes in hmg volume (KoNNO and MEAD, 1966; SACKNER et al., 1989).
Correspondence should be addressed to Dr Konrad E. Bloch; emaih pneubloc@ usz. unizh, ch
Paper received 6 September 2002 and in final form 6 December 2002 MBEC online number: 20033760
© IFMBE: 2003
inductance plethysmography can also be employed for non- invasive monitoring of cardiac output (SACKNER et al., 1991; BLOCH, 1998). This technique has been named inductance cardiography or thoracocardiography, it is based on the observation that the signal of an inductive plethysmographic transducer encircling the chest at the level of the heart is predominantly modulated by respiration, but, to a minor degree (approximately 5% of the total amplitude), by cardiac activity as well (BLOCH et al., 1998). By filtering and ensemble-averaging the signal with the ECG R-wave as a trigger, relatively pure cardiogenic curves can be obtained. Their amplitudes track changes in stroke volume. By computing the product of stroke volume times the heart rate, cardiac output can be estimated. Validation studies in critically ill patients (SACKNER et al., 1991; BLOCH et al., 1997) and animals (dogs (SACKNER et al., 1991) and juvenile piglets (BLOCH et al., 2002)) revealed close agreement among estimates of changes in cardiac output derived by inductance cardiography and thermodilution.
As the amplitudes of the inductance waveforms do not allow estimation of stroke volume in absolute units (i.e. millilitres) but reflect changes in stroke volume over time, an initial calibration by an independent technique, such as Doppler echocardiography or thermodilution, must be performed if the monitoring of stroke volume and cardiac output in absolute units is desired. Despite this limitation, inductance cardiography has advantages over
thermodilution, the current standard technique for monitoring cardiac output in clinical practice (JANSEN, 1995), as it is non- invasive and allows continuous monitoring of changes in cardiac output without a requirement for hand-holding a transducer or for the presence of an examiner at the bedside. Nevertheless, application of inductance cardiography in the clinical setting has been hampered, as real-time signal processing has not been feasible. To address this point, we developed a novel, real-time signal processing technique for inductance cardiography. In the current paper, we describe the principles of the signal processing technique and the results of the first clinical application in
critically ill patients.
J
J
f
2 M e t h o d s2.1 Measurement and recording devices
We employed a commercially available inductive plethysmograph*, its transducer consisted of an elastic band, 1.5 cm in height and 50-100 cm in length, that contained an isolated wire arranged in a sinusoidal way. it was connected to the amplifier/demodulator circuitry of the inductive plethysmograph by a coaxial cable. Changes in the cross- sectional area encircled by the transducer, along with the ECG waveform and the ECG R-wave impulse, were encoded by the inductive plethysmograph as a digital data stream with 200 Hz and 16-bit resolution. These data were transmitted by a serial port to a personal computer (PC) and stored on the hard drive.
2.2 Signal processing
The real-time inductance cardiography signal processing technique was developed using the graphical programming language G t. LabView provides various tools that facilitate the development of 'virtual instruments'. For clinical testing, the application was compiled ~ and operated on a portable PC with the Microsoft Windows98 operating system, a 200MHz processor, 64 MB RAM and >5 MB free hard disk space.
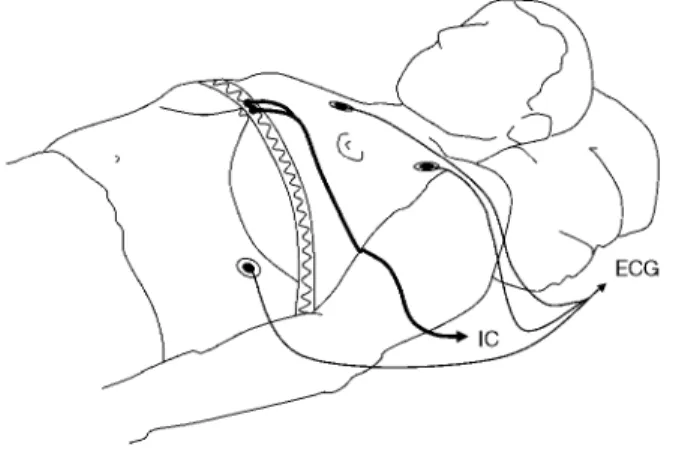
Fig. 1 Transducer for inductance cardiography (IC) transversely encircles chest at or within 5cm below level of xiphoid process. It consists of elastic band that contains isolated electrical conductor arranged in sinusoidal array. Three ECG electrodes are also positioned
served as the reference standard. The cardiac output computer displayed the average of multiple cardiac output determinations over 3-5 min on its display**.
Cardiac output estimated by the inductance cardiography system (in arbitrary units) and by thermodilution (in litres per minute) were recorded at 5-10min intervals on a sheet of paper.
2.3.3 Data analysis: Calibration of inductance cardiography- derived cardiac output, in litres per minute, was performed, as described previously (BLOCH, 1998), by comparison of one cardiac output estimated by the inductance cardiograph with a corresponding measurement by thermodilution. Relative (percent) changes in cardiac output estimated during succes- sive paired measurements by inductance cardiography and thermodilution were also computed. Agreement between the two methods was analysed by calculation of the bias (mean difference) and limits of agreement (the range of bias -4-2 SD) (BLAND and ALTMAN, 1986).
2.3 Validation
2.3.1 Patients: Four patients treated in the intensive care unit for the following reasons were studied: One suffered from pneumonia with sepsis, and one suffered from myocardial infarction with haemodynamic instability; in two patients with a history of high-altitude pulmonary oedema, the haemody- namic response to nifedipine was tested.
2.3.2 Measurements andprotocoh The inductance plethysmo- graphic transducer was placed transversely around the chest within 5 cm caudal to the xiphoid process (Fig. 1) (BLOCH, 1998). Three ECG electrodes were also positioned, inductance plethysmographic and ECG waveforms were recorded continu- ously and processed in real time by the inductance cardiography system. Cardiac output, stroke volume and heart rate averaged over periods of 3-5 min were displayed on a video screen.
A pulmonary artery catheter had been placed by the attending medical team according to clinical needs. Cardiac output measured by continuous thermodilution (YELDEgMAN, 1990) *Respitrace 204, Noninvasive Monitoring Systems, NIMS Inc., Miami Beach, FL, USA
tLabView version 5.1, National Instruments, Austin, Texas, USA ~Using LabView Runtime, version 5.1, National Instruments, Austin, Texas, USA
Medical & Biological Engineering & Computing 2003, Vol. 41
3 R e s u l t s
3.1 Principle concepts o f the signal processing technique Data acquisition and real-time analysis requires the simulta- neous performance of multiple tasks. The key to achieving the desired performance is to structure the signal processing system in sets of subroutines rtmning independently. Furthermore, several databases, containing raw data, derived information and parameters from user input, need to be set up during each monitoring session. The individual modules write to and receive information from the various databases, update each other and process user input. This essential principle is illustrated in Fig. 2 and elaborated in greater detail for two modules, i.e. 'data acquisition/real-time analysis' and 'ensemble averaging' (Fig. 3).
A 'main module' provides a common start-up panel and preloads other modules into the RAM. it manages system resources and co-ordinates access to databases used by several modules. The main module also controls the two modes of operation, data acquisition/real-time analysis, and data
**Vigilance continuous cardiac output computer, Baxter Healthcare, Irvine, CA, USA
Fig. 2
[
Essential characteristic o f signal processing technique for real-time monitoring by inductance cardiography is organisation as multiple modules running independently. Individual modules are logically linked. They access common databases according to predefined protocol Data are polled, ~ynchronised and updated periodically, along with internal states o f individual modules. Parameters o f signal processing can be adjusted by user at various levels
Fig. 3
.--4
data acquisition / real-time analysis~bj
r a m e t e r ~ ustment J y u s e y ~ a P d a . r a m e t e r ~ .... ustment ) 1~" r ~ L °ff-line analysis I ]I review of data recorded | J-~ ... L earlier J • .••'• -••. "" ~ / / ~ p a r a m e t e r ~ / ! I, adjustment
/
I . .
/
• initialisation of monitoring devices, databases, parallel tasks, charts • polling of information from monitoring
devices and databases
• filtering
• storage of information in databases • determination of heart rate and breath rate • graphical and numerical display of primary
and derived data
updating of other modules operating in parallel j ~ ..""
.," , . /
paralleltask ]
•
II' I synchronisation and 1 • " updating of modules
::::::::::::::::::: trend 1
• computation and displayof time series of • haemodynamic variables
••° °,.
[ ensemble averaging I
identification of relevant heart cycles
computation of mean heart rate computation and storing of mean waveforms in database peak and trough detection to determine amplitude (stroke volume) of mean inductance waveform
computation of cardiac output storage of stroke volume and cardiac output in database
time series display (trend) of haemodynamic variables updating of other modules
Various tasks performed in parallel by data acquisition~real-time analysis and ensemble-averaging modules are illustrated. These modules exchange information with each other and with other modules, such as trend and off-line analysis, and with databases
replay/off-line analysis. These two modes run simultaneously to allow collection of new data while providing the opportunity to review data recorded at an earlier time, in the same or a different session.
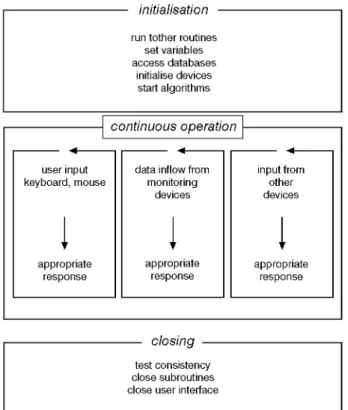
The data acquisition/real-time analysis module (Fig. 4) includes three components that handle initialisation, main tasks during continuous operation and closing, respectively (Fig. 4). The main tasks consist in polling information on user inputs, on data inflow from monitoring devices and on the status of other modules that operate simultaneously. Priorities on distribution of resources are assigned. An acquisition manager, incorporated within the data acquisition/real-time module, can assume one of the three states 'stand-by', 'acquisition' and 'play', depending on whether real-time data are received and processed from monitoring devices, real-time data are received and stored to databases on disk, or data stored previously are retrieved from a file on disk. Independent of these states, graphical waveform display, filtering, heart cycle and breath cycle measurements, ensemble averaging and other tasks are performed in real time and on replayed data by specialised routines.
At least every minute, the system appends data from moni- toring devices accumulating in the buffer to a file on the hard drive. This prevents loss of more data than those from the last minute before inadvertent interruption of system operation, for example during loss of electrical power. To allow rapid repeated display of long time series, i.e. several hours, without delay and unnecessary consumption of system resources, raw data from the original raw data file are compressed, and stored into secondary databases at the first replay.
3.2 Implementation o f a software application
The main steps in signal processing consist in data recording and storing, filtering, ensemble averaging, waveform analysis
initialisation
run tother routines set variables access databases initialise devices start algorithms
f continuous operation t
user input keyboard, mouse appropriate responsedata inflow from monitoring devices appropriate response input from other devices appropriate response
closing
test consistency close subroutines close user interfaceFig. 4 Main module controls" initialisation, various tasks" during continuous operation and closing of signal processing application
and computation of derived variables, in the current application, these tasks were performed by a total of 452 subroutines (modules).
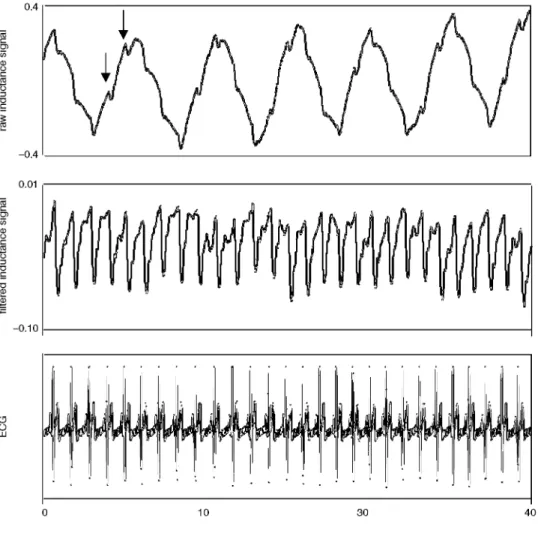
The data flow and characteristics of the user interface are displayed in Fig. 5. inductive plethysmograph and ECG data are received by the computer serial port and recorded onto the hard drive. A time series of each raw signal channel is displayed to allow assessment of signal quality and physiolo- gical interpretation (Fig. 6). The respiratory and heart cycle durations are measured (breath and heart cycle measurements, Fig. 5).
A finite impulse response (FIR) filter (512 tap FIR filter, provided by the LabView tool-box) was applied to the induc- tance waveforms, it suppresses low-frequency harmonics, related to respiration and other body movements, and high- frequency electrical noise. The resulting signal predominately reflects cardiac volume changes. The high-pass component of the FIR filter is controlled by the measured heart cycle length, it is automatically and continuously adapted to correspond to a fraction of 0.7 times the actual heart rate. The low-pass component of the FIR filter is set at 10 Hz. To compensate for the delay of inductance waveforms induced by the FIR filter, the (unfiltered) ECG and ECG R-wave signals are delayed by a corresponding time period (At, Fig. 5).
By ensemble-averaging the filtered inductance waveforms and the ECG with the ECG R-wave as a trigger, random variability of the signals not related to cardiac activity is removed. This provides mean inductance and ECG waveforms over multiple heart cycles (Era and EECG; see Figs 5 and 7). The number of heart cycles included in ensemble averages is adjustable using the ensemble-averaging control (Fig. 5). The default setting for validation studies was 200 beats.
Stroke volume is defined as the difference in inductive plethysmographic derived volume between the beginning of ejection, i.e. the major systolic negative deflection within a window of 50-180ms after the ECG Q-wave, and the minimum volume during the heart cycle (Fig. 7) (BLOCH,
1998). Mean heart cycle length over the ensemble-averaged time period is measured and converted to heart rate. The product of heart rate times stroke volume provides cardiac output. For validation purposes, the points corresponding to these measure- ments are indicated on the plot of ensemble-averaged wave- forms. Furthermore, the resultant numerical values of haemodynamic variables are displayed (Fig. 7). Their trend over time is plotted in a separate window (Fig. 8). Data stored on the hard drive du6ng a previous session or at an earlier time du6ng the actual recording session can be re-analysed in the same way as real-time data. These results are displayed in a separate window.
3.3 Clinical validation
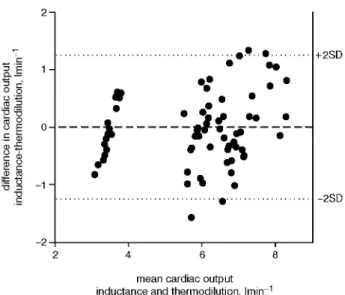
In all four patients, inductance cardiography waveforms could be continuously recorded, and the signal processing system was stable and convenient to use. A total of 80 simultaneous measurements of cardiac output by inductance cardiography and thermodilution were performed. The observed range of cardiac output by thermodilution was 3.4-8.21min -1. The limits of agreement (i.e. the range of-4-2 SD of the mean difference) of cardiac output estimates by the two methods extended over -4-1.2 lmin - I (Fig. 9). The range of 76 changes among successive measurements by thermodilution was from - 2 0 % to +14%. Analysis of agreement between inductance cardiography and thermodilution-derived changes in cardiac output revealed a mean difference (bias) of 0% and limits of agreement of -4-25%.
Fig. 5
data input from
monitoring
devices
(
R-wave
data input and . . . --2--2--2--2--2--T i i
storage
control
/
,~
'
...
.L
~. hard drive ]raw data
II
cycle
I
I
;
display
(Fig 5)
Ilmeasurement~ ~- q [~
iP_filter
control ) t
I~L~
/
/
~ydteh
m
~ filtered data
me en
i
display
ensemble
measurements
control
averaging ~
~
"~ ~- "] SV
...
... .... -I~~
|
HR
'~
EECG
[
t
data
ensemble
averaged
(Fig
display
6)
/
control
/
] ]measurement
measurement
bili!h
ild
iRd
~/ numerical /
results
~_
~
display
trend calculation .~
control
t
t
'
I~
t,
I~ / graphical
display
trends /
Schematic representation of signal processing for inductance cardiography. Data flow and processing is depicted by lines with arrows and rectangles. Control panels that allow user input are represented by octagons. Broken lines and arrows indicate steps that can be controlled by user Graphical plots displayed on computer video screen during operation are represented by shadowed rectangles. During real-time data acquisition, data input is provided by inductive plethysmograph (IP) and the electrocardiograph (ECG). During off:line review, data stored on computer hard drive are retrieved from file and processed in similar way to real-time data. Successive steps in signal processing include filtering of inductive plethysmographic signal, ECG-triggered ensemble averaging and automatic measurement of heart rate (HR), breath rate and stroke volume (SV). Cardiac output (CO) is computed as product o f heart rate and stroke volume. At = delay for ECG signals to maintain 3ynchronisation with filtered inductive plethysmographic signals; EzF, EECG = ECG-triggered ensemble averaging o f inductive plethysmographic and ECG waveforms
4 Discussion
We have developed a digital signal processing technique for inductance cardiography that, for the first time, allows moni- toring of changes in cardiac output in real time. This is a major step towards clinical application of this non-invasive technique for assessment of the mechanical performance of the heart. The application of inductance cardiography in critically ill adult patients, described in the current paper, and additional validation studies in healthy volunteers during bicycle exercise (KAPLAN
et al., 2003), in critically ill premature human neonates and in
juvenile piglets (BLOCH et al., 2002) demonstrate that the signal
processing technique is stable and robust enough to provide accurate haemodynamic data in various settings.
In contrast to the more common medical application of inductive plethysmography for monitoring respiration, induc- tance cardiography (thoracocardiography) applies digital signal processing techniques to suppress respiratory harmonics and body motion-related artifacts in inductive plethysmographic waveforms. The resulting cardiogenic curves reflect changes in the segmental cross-sectional area of the heart at the level of the transducer, i.e. predominantly left ventricular volume changes. This is supported by respiratory variations in induc- tance cardiographic-derived stroke volumes typical of the left ventricle, i.e. with greater stroke volumes during expiration than during inspiration. Such respiratory variations in stroke volume agreed with those derived simultaneously by echocardiography with automatic boundary detection of the left ventricle (BLOCH
03 03 o) .=_ 0.4 -0.4 0.01 -0.10 Fig. 6 0 10 30 40 time, s
Time series plot o f raw and filtered inductive plethysmographic signals and ECG. Display o f these data on computer video-screen during data acquisition helps assessment o f signal quality. Cardiac oscillations (arrows') are superimposed on raw inductive plethysmographic waveforms, which are dominated by respiratory excursions. Filtered inductive plethysmographic signal reveals" relatively pure cardiogenic curves, with characteristics o f ventricular volume curves"
e t a L , 1998). Furthermore, inductance cardiography provides systolic and diastolic time intervals that are similar to those obtained by arterial tonometry (BEACH et al., 1994) and Doppler-echocardiography of transmitral blood flow (BEACH et al., 1999), respectively, and that are longer than those typically observed for the right venctricle. Thus inductance cardiography differs from impedance cardiography, another technique for non-invasive cardiac monitoring, which derives cardiac output from measurements of electrical impedance of the entire chest (transthoracic electrical impedance) (BEACH, 1998). An essential characteristic of the signal processing technique for inductance cardiography presented here is its organisation in various modules that run independently and on demand. They are logically linked and access common databases containing raw and processed data (Figs 2 and 3). According to a predefined protocol, acquired raw data and information stored in databases are polled, synchronised and updated periodically, along with the internal states of individual modules. Several tasks are executed in parallel, with priorities allocated by a control module (Fig. 4). This structure ensures optimum use of system resources and stability, as required for real-time monitoring. The oppommity to review information stored at an earlier time during an active recording session, while data are continuously acquired and analysed in real time, is an important feature of the proposed signal processing system, in terms of clinical decision- making, it is essential to interpret the results of a measurement performed at a particular point in time in the light of the previous trend of the variable of interest.
Our s t u d y confirms that the combined application of FIR filters and ECG-triggered ensemble averaging effectively suppresses random noise in the inductance signal related to body motion and respiratory chest wall excursions. This
m e a n inductance ~ I( / v ~ / /avef°rm' ~ / / r ~ \ A q3.o8 !. ~ " ~ - J ECG 0 0.5 1.0 1.5 time, s HR 60 beats min 1 SV 0.081 I CO 4.9 I min 1
Fig. 7 Ensemble averaging o f filtered inductive plethysmographic and ECG signals'provides mean waveforms over several heart cycles. Stroke volume is" automatically measured as amplitude o f major systolic deflection o f inductive plethysmographic waveform (arrow). Actual mean waveforms are displayed in separate window on computer video-screen during real-time data acquisition. Corresponding derived numeric variables heart rate (HR), stroke volume (SV) and cardiac output (CO) are also shown and continuously updated
Fig. 8 '-~ 57.0 t 6 0
5651"--,,.,,
56° 1
- =55.51
0.12 0.08 E m m 6.7: 4.6- ' ' 0 6:54 7:00 7 : 6 time, min:sPlot o f trends in derived variables over time, i.e. heart rate, stroke volume and cardiac output, is continuously updated during real-time data acquisition. It represents" important information for clinical assessment. In current example, cardiac output by inductance cardiography has been calibrated by initial paired measurement with thermodilution. I f monitoring o f cardiac output in absolute units"
z
(lmin ) is not required, relative changes in cardiac output can still be monitored with inductance cardiography without initial calibration
provides relatively pure cardiogenic waveforms (Figs 6 and 7). Beat-by-beat measurement of stroke volume is feasible during apnoea (BLOCH et al., 2002) or breathing at a low rate (8 breath- smin -1) (BLOCH et al., 1998), by bandpass filtering the inductive plethysmographic signal without ensemble-averaging it. To provide the option for beat-by-beat monitoring, the proposed signal processing system can be employed with
2- 0 0 0 ' - ~ ~ o o E O- ~ ~ - 1 - -2 . . . o O O . . . •
•
e
.o
. .
o • •"_ 3i.-'_ ",
•
n n n 4 6 8 +2SD -2SDmean cardiac output inductance and thermodilution, Imin 1
Fig. 9 Plot o f diffbrences in cardiac output acquired by inductance cardiography and themodilution against their means (BLAND and ALTMAN, 1986). ( . . . ) Range o f ±2 SD o f mean difJbrence, i.e. limits" of agreement
ensemble averaging turned off. A graphical display of raw and processed data (Figs 6 and 7) is particularly important under these conditions, to allow quality control of signals.
The technical characteristics and user interface of the signal processing technique have been based on our previous experi- ence with this method and have been designed to accommodate the requirements for a clinical monitoring technique. Nevertheless, the software provides the flexibility for applica- tion in specialised research settings. Many features, such as characteristics of filters, ensemble averaging, automatic wave- form measurement and graphical and numerical output of data, can be adapted by the operator according to the actual needs (Fig. 5).
Application of inductance cardiography to critically ill patients in an intensive care trait has confirmed that the signal processing technique was convenient to use and robust. The limits of agreement between changes in cardiac output measured by inductance cardiography and thermodilution of -4-25% observed in the current study are similar to the corresponding values of-4-22% obtained in critically ill patients in an earlier investigation (BLOCH et al., 1997).
5 C o n c l u s i o n s
The signal processing technique described in the current paper significantly enhances the potential application of inductance cardiography by providing haemodynamic data in real time. Our current studies, together with additional, recent validation studies (BLOCH et al., 2002; KAPLAN et al., 2003), suggest that inductance cardiography is sufficiently accurate and
convenient to use to serve as a useful tool for non-invasive real- time monitoring o f cardiac output in a clinical setting and in cardiovascular research.
Acknowledgments" This study was supported by a grant from the E M D O Foundation, Ziirich, Switzerland. The authors would like to thank Marco Maggiorini, MD, Head of the Medical Intensive Care Unit, University Hospital of Ztirich, Switzerland, for performing the themodilution measurements. The inductive plethysmograph was provided by Noninvasive Monitoring Systems NIMS, Inc., Miami Beach, FL, USA.
References
BLAND, M. J., and ALTMAN, D. G. (1986): 'Statistical methods for assessing agreement between two methods of clinical measure- ment', Lancet, 1, pp. 307-310
BLOCH, K. E., JUGOON, S., and SACKNER, M. A. (1994): 'Thoraco- caxdiographic derived left ventriculax systolic time intervals', Chest, 106, pp. 1668-1674
BLOCH, K. E., BAUMANN, P. C., STOCKER, R., and Russ1, E. W. (1997): 'Noninvasive monitoring of cardiac output in critically ill
patients with thoracocaxdiography', Am. J. ResFir Crit. Care Med.,
155, pp. 26-31
BLOCH, K. E. (1998): 'Impedance and inductance monitoring of cardiac output', in TOBIN, M. J. (Ed.): 'Principles and practice of intensive care monitoring' (McGraw-Hill, Inc., New York, 1998), pp. 915-930
BLOCH, K. E., JUGOON, S., DE SOCARRAZ, H., MANNING, K., and SACKNER, M. A. (1998): 'Thoracocardiography: noninvasive monitoring of left ventriculax stroke volume', J. Crit. Care, 13, pp. 146-157
BLOCH, K. E., JUGOON, S., and SACKNER, M. A. (1999): 'Inductance
cardiography (thoracocardiography): a novel, noninvasive
technique for monitoring left ventriculax filling', J Crit. Care, 14, pp. 177-185
BLOCH, K. E., ADAMS, J. A., BASSUK, J. J., MANGINO, M. J., and SACKNER, M. A. (2002): 'Noninvasive monitoring of cardiac output in human neonates and juvenile piglets by inductance cardiography (thoracocaxdiography)', J. Crit. Care., 17, pp. 259-266
JANSEN, J. R. C. (1995): 'The thermodilution method for the
clinical assessment of cardiac output', Intensive Care Med., 21,
pp. 691-697
KAPLAN, V, BUCKLAR, G., and BLOCH, K. E. 'Noninvasive monitor- ing of cardic output during exercise by inductance cardiography', Med. Sci. Sports" Exerc. 2003 (in press)
KONNO, K., and MEAD, J. (1966): 'Measurement of separate volume
changes of ribcage and abdomen during breathing', J. Appl.
Physiol., 22, pp. 407-422
SACKNER, M. A., and KRIEGER, B. P. (1989): 'Noninvasive respiratory monitoring' in SCHARF, S. M., and CASSIDY, S. S. (Eds): 'Heart- lung interactions in health and disease' (Marcel Dekker Inc., Basel, New York, 1989), pp. 663-805
SACKNER, M. A., WATSON, H., BELSITO, A. S., FEINERMAN, D., SUAREZ, M., GONZALEZ, G., BIZOUSKY, E, and KRIEGER, B. (1989): 'Calibration of respiratory inductive plethysmograph during natural breathing', J. Appl. Physiol., 66, pp. 410-420 SACKNER, M. A., HOFFMAN, R. A., STROH, D., and KRIEGER, B. P.
(1991): 'Thoracocardiography Part 1: noninvasive measurement of changes in stroke volume; comparisons to thermodilntion', Chest, 99, pp. 613-622
WATSON, H. L., POOLE, D. A., and SACKNER, M. A. (1988): 'Accuracy of respiratory inductive plethysmographic measurement of cross- sectional area of models', J Appl. Physiol., 65, pp. 306-308 YELDERMAN, M. (1990): 'Continuous measurement of cardiac output
with the use of stochastic system identification techniques', J Clin. Monit., 6, pp. 322-332
Author's Biography
KONRAD E. BLOCH is attending physician at the Pulmonary Division, University Hospital of Zurich, Switzerland. After his studies at the Medical School of the University of Berne, Switzerland, he received his postgraduate training in Internal Medicine, and in Plumonaxy and Critical Care Medicine at the University Hospital of Zurich, Switzerland, and at the Mount Sinai Medical Center, University of Miami, Florida USA. Dr. Bloch's research has been focused on the development of various noninvasive cardiopulmonaxy monitoring techniques for application in critical care, and in the sleep laboratory. He has published several papers on evaluation of mechanical cardiac performance by inductance cardiography, and on breathing patterns assessed by inductance plethysmography in patients with lung disease and with sleep related breathing disorders.