pp.305-324 305
Turn-taking patterns in human discourse
and their impact on group communication
service design
Kostas KATRINIS*, Gisli HJALMTYSSON**, Bernhard PLATTNER*
Abstract
Recent studies demonstrated the benefit of integrating speaker prediction features into the design of group-communication services supporting multiparty online discourse. This paper aims at delivering a more elaborate analysis of speaker prediction by analyzing a lar-ger volume of data. Moreover, it tests the existence of speakers dominating speaking time. Towards this end, we analyze tens of hours of recorded meeting and lecture sessions. Our principal results for meeting-like interaction manifest that the next speaker is one of the last four speakers with over 90% probability. This is seen consistently across our data with little variance (standard deviation of 8. 71 %) independent of the total number of potential spea-kers. Furthermore, lecture time is in most cases significantly dominated by the tutor. In mee-tings, although a single dominating speaker is always evident, domination exhibited high variability. Generally, our findings strengthen and further motivate the act of incorporating user-behavior awareness into group communication service design.
Key words: Group dynamics, Speech, Speaker, Linguistic analysis, Human communication, Oral communi-cation, Teleconference.
CONFIGURATIONS DE PRISES DE PAROLE DANS LE DISCOURS HUMAIN ET LEUR IMPACT SUR LA CONCEPTION DES SERVICES
DE COMMUNICATION DE GROUPE Resume
Des etudes recentes montrent I 'interet d'integrer des caracteristiques relatives
a
la pre-diction du locuteur dans la conception des services de communication de groupe qui admet-tent une conversation en ligne entre plusieurs personnes. L' article visea
obtenir une analyse plus elaboree de la prediction du locuteur par I'analyse d'une plus grande quantite de don-nees. II teste en outre I' existence de locuteurs qui dominent Ie temps de parole. On analyse dans ce but des dizaines d'heures d'enregistrement de reunions et de conferences. Les princi-paux resultats pour des interactions de type reunion indiquent que Ie locuteur suivant est l'un des quatre derniers locuteurs avec une probabilite de plus de 90%. Cela est verifie de* Communication Systems Group, Swiss Federal Institute of Technology (ETH Zurich) - Gloriastrasse 35, 8092 Zurich, Switzerland; {katrinis, plattner}@tik.ee.ethz.ch
**
Network Services Laboratory, Reykjavik University - Ofanleiti 2, 103 Reykjavik, Iceland; [email protected]306 K. KATRINIS - TURN-TAKING PATIERNS IN HUMAN DISCOURSE fafon constante pour I' ensemble des donnees avec une faible variance (ecart-type de 8,71 %) quel que so it Ie nombre de locuteurs potentiels. Dans les conferences, Ie temps de parole est domine dans la plupart des cas par Ie conferencier. Dans les reunions, bien qu 'un seullocu-teur dominant apparaisse toujours, la domination se revele plus variable. De fafon gene-rale, les resultats renforcent et motivent l'incorporation du comportement des utilisateurs dans la conception des services de communication de groupe.
Mots clt~s: Dynamique groupe, Parole, Locuteur, Analyse linguistique, Communication humaine, Communication orale, Teleconference.
Contents I. Introduction II. Related work III. Theory and analysis IV Experimental setup
V. Pattern similarity between online and real sessions
VI. Results
VII. Conclusion References (14 ref)
I. INTRODUCTION
In various fields of computer science, patterns in resource usage or user behavior are often exploited for further optimization of algorithms and services. For instance, the execu-tion of computer programs is associated with high locality in terms of memory references. Page replacement algorithms in paged operating systems take advantage of this phenomenon to reduce the probability of page fetches from secondary storage to main memory, thus achie-ving faster code execution (e.g. Least Recently Used (LRU) replacement strategy [1]). Parti-cular to computer networks, locality has been used in large-scale distributed simulations and mUltiplayer online games [2] as a means of limiting the amount of data received by a node participating in the session. In short, each node interacts at full-rate only with the nodes resi-ding in its declared vicinity (termed "area of interest"), while exchanging only coarse-grai-ned control information with the rest of the session's nodes.
Out of the large set of potential multiparty applications, herein the focus is on "teleconfe-rencing-like" applications enabling online discourse. For instance, we consider Voice-over-IP (VOIP) multiparty meetings, synchronous distance learning sessions and online workshops. In our previous work on multicast tree management, we have demonstrated the benefit of tree caching in multi-source conferencing sessions over Source-Specific Multicast (SSM) [3].
One alternative for realizing multi-source SSM sessions mandates creating a tree rooted at a
group member as soon as the latter starts speaking (on demand). We showed that there is value in maintaining the tree rooted at a recently spoken conferee alive, as the probability of the same conferee speaking again in the near future is considerably high (temporal locality). This observation motivated us to extend our analysis to a larger set of interaction traces in an attempt to extract patterns that could be generally of interest to the designer of a network service supporting online multiparty applications.
In this paper, we analyze fifty-two hours of recorded discourse from thirty-nine interac-tive multiparty events with physically collocated participants (face-to-face). The recorded events comprised both of lectures and meetings recorded in a non-televised setting. We
K. KATRINIS - TURN-TAKING PATTERNS IN HUMAN DISCOURSE
307
lyze the sequence and duration of turns taken in each event and test the following two hypo-theses:
• HI: The existence of speakers dominating speaking time and
• H2: The ability of predicting with high probability the future speaker from the short term interaction history.
Our principal finding suggests that in meeting-like interaction, predicting the next speaker from a small constant number of previous speakers - independent of the group size - can be accomplished with considerably high probability (over 90% on average). Applying the same to lecture-like discourse proved irrelevant, solely due to low interactivity caused by the lecturer's domination in terms of speaking time. Last, our analysis confirms the hypothesis of a single dominating speaker across all meeting traces processed, however with varying significance.
The primary contribution of this work is showing that there are indeed specific patterns in human discourse that can be exploited to design more efficient group communication ser-vices. Although designs that take such patterns into consideration have been already introdu-ced (partly by the authors, see Section 11), a strict and large-scale statistical study of these patterns has so far been missing. As such, we see our work valuable in validating and opti-mizing existing designs and in possibly inspiring new approaches taking interaction behavior into consideration. In general, our work validates and strengthens the impact of incorporating user-behavior awareness to the design of group communication services.
The structure of this paper is as follows. The next section outlines previous work on the topic and discusses how this interrelates to the content presented herein. Section III presents the formal framework of the theory put under test and elaborates in the practical applica-bility of our primary hypotheses. The next two sections describe the method and scope of the performed data analysis, whose results are presented and discussed in Section VI. We conclude in Section VII with discussion and future work.
II. RELATED WORK
By definition, conversation is a sequence of possibly overlapping speaking periods - cal-led turns - and pauses. In each tum, one person talks, while another (or more) listens. Hence there is a subconscious assignment of speaker and auditor roles to the conversation parties. This assignment changes frequently as the conversation evolves, with or without the current speaker's consent (interruption) and either explicitly (e.g. by forcing a tum transition with addressing the word to a listener) or implicitly (e.g. eye gaze, gestures, content). Analyzing and modelling tum-taking has been an ongoing effort for more than thirty years. Discourse analysts [4] noted that humans innately delineate the start/end of turns and have focused on the factors driving these systems. Additionally, they investigated the various types of transi-tions between adjacent turns and elaborated on the human factors motivating them. Gene-rally, tum-taking constitutes a multidisciplinary topic that has been studied by various fields of science, like linguistics [4], psychology [5] and sociology [6] to name a few. Although we adhered to the established terminology and borrowed various definitions from these studies, this work approaches tum-taking from a completely different perspective. More precisely, we perceive tum-taking as a sequence of three types of finite duration events: turns, overlaps
308 K. KATRINIS - TURN-TAKING PATTERNS IN HUMAN DISCOURSE
and pauses. Using this simple model, we test the existence of specific patterns, leaving out the process of inquiring the aspects of human behavior that may cause the occurrence of such patterns.
Particular to studying tum-taking habits as a means of improving online human interac-tion, McKinlay et al. [7] evaluated the impact of various tum-taking protocols on the perfor-mance of a small group of humans collaborating over a networked cscw (Computer Supported Collaborative Work) platform. Although the authors mentioned the frequent occurrence of temporal locality in tum-taking (referred to as "adjacency pairs"), they neither specified the occurrence probability of this phenomenon, nor did they test the existence of locality in tum subsequences of size larger than two (therefore the term "pair").
To our knowledge, [8] was the first work that combined tum-taking analysis with the reflection of its findings to network design, resulting in the ALNAC system. ALNAC [8] (Appli-cation-layer Network Audio Conferencing) is a special-purpose Application-Layer Multicast (ALM) routing protocol targeted at audio-conferencing. The novelty of its design rests on the observation that minimizing latency over an ALM infrastructure from the active speaker to every other group member is not the most effective choice in terms of perceived quality. In fact, this can result in a number of participants experiencing unacceptably high (for real-time interaction) delays. On the contrary, ALNAC minimizes latency from the current speaker to a small (constant) set of participants, who are most likely to interact with the current speaker. It is exactly these participants, who need interactive latencies in order to react to conversational cues. The rest of the group members, participating as passive listeners at that particular time of the session, can tolerate higher latencies using normal (non ALNAc-optimized) overlay rou-ting. ALNAC builds the set of future speakers from the last five spoken participants. This deci-sion resides on results obtained after analyzing four multiparty conversations (two audio-conferencing sessions and two public-meeting traces) and which essentially state that the accuracy of picking the future speaker out of the last five spoken participants is on ave-rage 92%. The connection of the present work to ALNAC is twofold. While [8] offered a small scale proof of locality in tum-taking, herein we provide for a more robust study of the phe-nomenon by analyzing a much larger volume of discourse sessions. Still, ALNAC constitutes a straightforward example of how the results introduced in this paper can be put to good use in order to design more efficient services in support of online discourse.
In our previous work [9], we focused on the dynamic allocation of source-rooted trees in multiparty conferences over SSM. One approach [lO] for implementing sessions with mul-tiple sources over SSM is to build a distribution tree rooted at a session participant on demand, i.e. at the time this specific participant starts speaking. This reactive approach suffers from two critical shortcomings: first, it often leads to considerably long communication outages due to delay in the creation of the on demand tree. Second, it increases the cost of the service in terms of router processing resources, due to intensive tree creation/tear-down activity. As a remedy, we proposed caching a constant number of least recently used trees, building up on the observation that a recently spoken conferee is highly probable to speak again in the near future. Through simulation of two real-life meetings, we showed that the caching approach manages to alleviate both shortcomings of the elementary on demand approach to a great extent. The results presented herein form both a complement to and an extension of [9]: a) they strengthen the applicability of the tree caching approach by proving the existence of temporal locality in a much larger dataset of interaction traces and b) they show that applica-tion-aware tree management can potentially benefit from other interaction patterns beyond locality.
K. KA1RINIS - TURN-TAKING PATTERNS IN HUMAN DISCOURSE 309
III. THEORY AND ANALYSIS
In this section, we present the hypotheses put under test by our study. Additionally, we discuss for each pattern how it can be exploited by two specific network services - namely Source-Specific Multicast and Application-Layer Multicast - to provide for more efficient online discourse.
111.1. Dominance
Often, a small number of speakers tend to monopolize the word during multiparty conversations. Many factors may lead to this pattern, like for example the discussion topic (e.g. when the topic mostly concerns only a fraction of the speakers, who tend to express themselves more frequently), the status of a speaker (e.g. the CEO in a company meeting is
more probable to monopolize the podium) and/or simply due to human nature for some humans are more extroverted than others. Regardless of the reason, we are interested in fin-ding out the frequency of monopolization effects and the extent of monopolization. The latter expressed both in the number of speakers monopolizing a single session and in terms of speaking duration of each monopolizing speaker.
We use the term "dominance" to refer to the phenomenon of a speaker exceeding his fair speaking ratio and define the "dominance factor" metric to quantify the degree of monopoli-zation. More formally, let Tevent be the entire duration of a mUltiparty session and Ti stand for the cumulative speaking time of speaker i throughout the session. Let also fst (measured in seconds) stand for the fairl speaking time of a conversation, i.e. the nominal total speaking
time of any speaker, if the session's total speaking time were equally allocated to all partici-pants. Assuming that S is the set of participants spoken over the entire session,fst is given by the term:
(1) fst
=
T eventlsi
We define the dominance factor di for speaker i as the ratio:
(2)
di= fs~ , Vi: Ti T>
fstEssentially, the dominance factor metric captures the degree of significance, by which a particular speaker exceeds his theoretical speaking time, if fair sharing of speaking time were employed. To name an example, consider a two hours meeting with 10 participants. The fair speaking time common to all participants is 0.2 hours in this case. Assuming that speaker 3 talks for 36 minutes in total, his dominance factor is then d3 =
~~
= 3. Equivalently, speaker1. While acknowledging that uneven speaking time may be natural and proper, we use the term "fair" to refer to equal speaking time among the participants.
310 K. KATRINIS - TURN-TAKING PATTERNS IN HUMAN DISCOURSE
3 spoke three times more than he would talk, were speaking time allocated in a fair manner. Note in Equation 2 that we constrained the dominance factor definition only to speakers, whose participation level exceeds their fair speaking ratio. Thus, it is straightforward that dj > I will always hold.
Network services aware of speaker dominance are capable of improving service quality and/or cost by differentiating the service offered to dominating speakers as opposed to less talkative participants. Specifically, in the case of mUltiparty conferencing over SSM, each
dominating speaker can be assigned a static tree - i.e. a tree that is kept alive for the entire session lifetime - whereas the rest of the participants can be served with on demand created trees. Since creating on demand trees can potentially cause interruptions in data delivery [9],
assigning static trees to dominating speakers improves quality of service. Moreover, reducing the cumulative number of tree setup events that indeed alter router state economizes on rou-ter processing resources and therefore reduces cost.
In many applications, the potential dominating speaker(s) may be known in advance. This is for example particularly true for lecture sessions, where the tutor will with very high pro-bability (almost deterministically) dominate the speaking time. This is indeed verified by our analysis results presented later in this paper. However, specifying the potential dominating speaker( s) in advance of the session is not trivial for other types of online discourse, collabo-rative-work meetings being a typical example. For these cases, devising (learning) algorithms that are capable of predicting dominating speakers as the session advances constitutes an interesting research topic. This is however out of the scope of the present paper.
111.2. Speaker Prediction
In the following analysis, we make use of the sorted set U = (uI' U2"'" un) of global turns, n being the total number of turns taken throughout the session. Additionally, given the set of identities of all spoken participants S, we define the function sp: U ~ S as the operator that matches a tum to the identity of its speaker.
Here, we are primarily interested in testing the existence of temporal locality in tum taking. By the term "temporal locality" we refer to the probability of previous speakers appearing as speakers in the near future. If this pattern occurs with high probability, we can then predict the future speaker with high accuracy from the short-term interaction history. More formally, let ui be the next tum, taken by participantj, i.e.j
=
sp(u). We define the past speakers window PSWi of size w (w~
I
SI )
at tum i as the sorted set of identities of the last k distinct speakers prior to tum i, where k is given by:(3)
(
i-I'ifi~W
k=
w, if i>w
We test the existence of locality by calculating the probability P of the identity of the next speaker matching one of the identities contained in the past speakers window or equiva-lently:
K. KATRINIS - TURN-TAKING PATTERNS IN HUMAN DISCOURSE 311
(4)
P(U} n PSW,*0)Particular to the problem of on demand tree management in multiparty SSM sessions (see
Section II), the above probability equals to the hit ratio of an LRU (Least Recently Used) tree
cache of size w. To enhance intuition, we give an example of an audio conference among a set S = { 1,2,3,4} of four speakers. The SSM middleware at each of the four conferees
main-tains a cache with the W least recently spoken participants (in this example we set w = 2). For each cache entry, a tree rooted at the respective SSM source is maintained. Every new turn
taken triggers an update of the cache: if a tree rooted at the new speaker is not cached, the
SSM middleware builds a new tree towards the new speaker. Additionally, if the cache is full,
the least recently used tree in the cache is torn down and replaced by the new entry. In case the cache is not full at the start of the new turn, the newly created tree is just added to the cache and the usage flags of all cache entries are updated. Let the global turn sequence be given by the set U
=
(2,3,4,3,4, 1,2). The first three turns cause a cache miss, leading thus to creating new trees rooted at the respective speakers. However, at the fourth and fifth turn, every conferee has already a cached tree to speakers 3 and 4 respectively (cache hit) and thus the overhead of tree creation is for these two turns avoided. Finally, the last two turns lead to a cache miss. Overall, the probability P of the next speaker being among the last 2 speakers is P=
28.57% in this example.Note in the last example that if we increased the size of the last speakers window to w
=
3, the overall probability would increase to P = 42.85%. In general, there is a trade-off bet-ween the accuracy of next speaker prediction and the cost of taking locality into considera-tion. For instance, in the case of tree caching in SSM, increasing the size of the cache (andthus the probability of a correct prediction) increases the cost due to the additional amount of router state required to keep the additional cached trees alive. In application-layer multicast, the out-degree of each overlay node in the distribution tree is normally bounded by a maxi-mum number threshold dour If ALNAC is used on top of an overlay routing protocol, the
cur-rent speaker j streams to the w potential next speakers per unicast and to the rest dout- w children using overlay routing. The w overlay nodes, that j would serve, if ALNAC were not
used, are delegated by j to his dout-w children. Here, increasing the size w of the last spea-ker's window causes the current speaker to delegate more overlay neighbors to his children, thus increasing the deviation from "routing optimality" as mandated by the underlying over-lay routing protocol.
IV. EXPERIMENTAL SETUP
IV.I. Input Dataset
For the purpose of our study we analyzed various multiparty sessions contained in the "MIchigan Corpus of Academic Spoken English" (MICASE [11
D.
We first classified onlinediscourse to two major categories of interest: conversational meetings, where all meeting partners can potentially equally contribute as the meeting evolves, and classroom-like
312 K. KATRINIS - TURN-TAKING PATTERNS IN HUMAN DISCOURSE
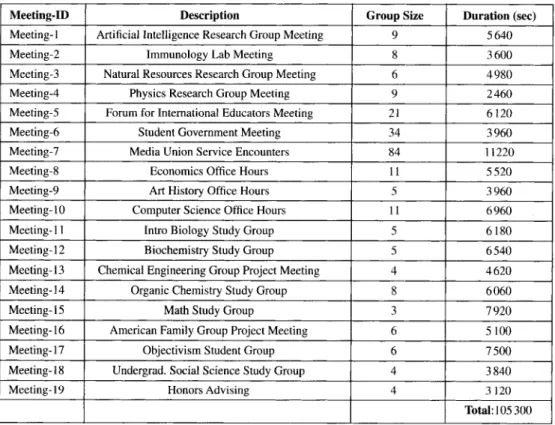
sions (e.g. courses, tutorials, talks), where implicit role assignment (e.g. tutor/student, main speaker/audience) causes a small fraction of participants to dominate in terms of speaking time. This classification corresponds fully with our intuition on types of discourse prominent in the Internet today and - as it will be made clear in the results section - is necessary, since we expect to find different patterns of interaction in the two classes of multiparty discourse. Table I summarizes the nineteen events making up our input dataset pertaining to mee-ting-like interaction. All but one event were held within the academic community (higher education or research). Participation level in sixteen of the meetings ranged from 3 to 11 par-ticipants (6.67 on average), whereas the rest three meetings were more highly populated (21, 34 and 84 respectively). Note that across all meetings, no participant remained silent and therefore the number of participants equals the number of speakers in our dataset. Last, the mean duration of a meeting session was 1.54 hours, ranging between 0.68 and 3.12 hours. In total, we analyzed 29.25 hours of meeting time. Accordingly, Table II lists the titles of the
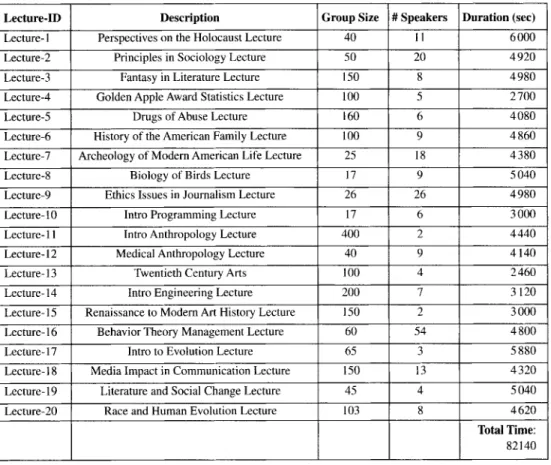
MICASE lectures we processed, together with participation and duration information (22.81
hours lecture time in total). To allow for generalization of results, we included both under-graduate and under-graduate sessions, with population ranging from 17 to 400 participants.
TABLE I. - Group size, duration and short description of analyzed MICASE meetings. Taille du groupe, duree et courte description des reunions MICASE analysees.
Meeting-m Description Group Size Duration (sec)
Meeting-I Artificial Intelligence Research Group Meeting 9 5640
Meeting-2 Immunology Lab Meeting 8 3600
Meeting-3 Natural Resources Research Group Meeting 6 4980
Meeting-4 Physics Research Group Meeting 9 2460
Meeting-5 Forum for International Educators Meeting 21 6120
Meeting-6 Student Government Meeting 34 3960
Meeting-7 Media Union Service Encounters 84 11220
Meeting-8 Economics Office Hours II 5520
Meeting-9 Art History Office Hours 5 3960
Meeting-IO Computer Science Office Hours II 6960
Meeting-II Intro Biology Study Group 5 6180
Meeting-I 2 Biochemistry Study Group 5 6540
Meeting-13 Chemical Engineering Group Project Meeting 4 4620
Meeting-I 4 Organic Chemistry Study Group 8 6060
Meeting-15 Math Study Group 3 7920
Meeting-16 American Family Group Project Meeting 6 5100
Meeting-17 Objectivism Student Group 6 7500
Meeting-I 8 Undergrad. Social Science Study Group 4 3840
Meeting-19 Honors Advising 4 3120
Total: 105 300
K. KATRINIS - TURN-TAKING PATTERNS IN HUMAN DISCOURSE 313
IV.2. Data Processing
Each MICASE session is transcribed using custom semantic and marked up in SGML
(Stan-dard Generalized Markup Language) format. Of the various types of annotated events, three are of interest to our analysis:
• Speaker turns, containing the full text of the tum and marked with the identity of the speaker .
• Overlapping utterances by two or more participants.
• Pauses in speech, either within an ongoing tum or between two adjacent turns, and their respective duration in seconds.
Lecture-ID Lecture-I Lecture-2 Lecture-3 Lecture-4 Lecture-5 Lecture-6 Lecture-7 Lecture-8 Lecture-9 Lecture-IO Lecture-II Lecture-12 Lecture-I 3 Lecture-14 Lecture-15 Lecture-I 6 Lecture-I 7 Lecture-I 8 Lecture-19 Lecture-20
TABLE II. - Group size, speaker number, duration and short description for each of the twenty analyzed MICASE lectures.
Taille du groupe, nombre d'intervenants, duree et courte description des vingt conferences MICASE analysees.
Description Group Size # Speakers
Perspectives on the Holocaust Lecture 40 II
Principles in Sociology Lecture 50 20
Fantasy in Literature Lecture 150 8
Golden Apple Award Statistics Lecture 100 5
Drugs of Abuse Lecture 160 6
History of the American Family Lecture 100 9 Archeology of Modem American Life Lecture 25 18
Biology of Birds Lecture 17 9
Ethics Issues in Journalism Lecture 26 26
Intro Programming Lecture 17 6
Intro Anthropology Lecture 400 2
Medical Anthropology Lecture 40 9
Twentieth Century Arts 100 4
Intro Engineering Lecture 200 7
Renaissance to Modem Art History Lecture 150 2
Behavior Theory Management Lecture 60 54
Intro to Evolution Lecture 65 3
Media Impact in Communication Lecture 150 13 Literature and Social Change Lecture 45 4
Race and Human Evolution Lecture 103 8
Duration (sec) 6000 4920 4980 2700 4080 4860 4380 5040 4980 3000 4440 4140 2460 3120 3000 4800 5880 4320 5040 4620 Total Time: 82140
Previous studies on human conversation have approached tum taking from a linguistic point of view, therefore usually defining a speaker's tum as the stretch of speech by a speaker that consists of one or more utterances. Various criteria (prosody, semantics) are used in these studies to decide on the start and the ending of a tum. For our engineering purposes, we
314 K. KATR[N[S - TURN-TAKING PATTERNS IN HUMAN DISCOURSE
adopted the definition proposed by Weilhammer [12]: the start of a tum is positioned either at the first word of the conversation or the first word interrupting the silence that follows the previous tum. Additionally, two successive turns by one speaker are always interrupted by an utterance of an interlocutor. The transcription methodology followed in the MICASE Corpus
samples conforms to this definition. The only deviation is that MICASE transcriptions contain
successive turns taken by the same speaker. Therefore, we applied the preprocessing step of merging adjacent turns taken by the same speaker into a single tum. Also note that overlap-ping utterances account in our analysis as distinct turns in the global tum sequence.
At various points of the present work, we are interested in the duration of a tum, apart from the tum taking sequence itself. As the MICASE transcriptions do not provide for the
dura-tion of each tum, except for the duradura-tion of pauses and the entire session duradura-tion, we devi-sed a custom technique to calculate tum duration. In particular, we first count the total number of letters comprising the entire session's speech and the effective speaking time, the latter given by subtracting the total pause time from the session duration. Subsequently, we divide the total letter count by the effective speaking time, resulting to the time spent on pro-nouncing a single letter (termed lettertime)2. The duration of a tum can then be easily com-puted by counting the number of letters in the tum and mUltiplying it with the lettertime. Note, that in the process of letter counting, we incorporate spaces between words as well, for breaks do also add to the total speaking time. Timed proof reading of random tum samples confirmed that our automatic technique gives a good approximation to actual tum duration.
V. PATTERN SIMILARITY BETWEEN ONLINE AND REAL SESSIONS Due to the lack of online traces, we conducted our analysis using traces captured during face-to-face multiparty sessions. In face-to-face sessions, visual cues and other bodily ges-tures aid communication, yet in online interaction these additional communication channels are not provided. Normally, this deficiency of online interaction should dramatically increase the number of overlaps and backchannel interactions. However, users becoming increasingly familiar with the medium realize that the single communication channel (or the couple of channels in case of synchronized audio/video) is exclusively important for communication and therefore tend to adhere to a gentle social interaction protocol (i.e. try to minimize over-lapping turns or remain silent until the current speaker concludes). This is partially confirmed for two-speaker interactions in [13], where overlaps or short interrupting utterances are found by only 13% higher in telephone conversations compared to the face-to-face analog. With the advent of video conferencing and the ability to have real-time visualization of more partici-pants beyond the current speaker, we expect to see an even closer match between online and real-life interaction patterns.
Particular to the patterns we seek for in this paper, we perceive both of them - locality and dominance - as features inherent to human communication per se, independent of the communication medium used. This lies in the fundamental way that people communicate with each other, no matter whether online or face-to-face. In fact, people do predict the next
2. This derivation holds under the assumption that speakers have uniform speaking speed. Although we acknow-ledge that this is not generally true, we don't expect this to heavily bias the results.
K. KATRINIS - TURN-TAKING PATIERNS IN HUMAN DISCOURSE 315
speaker, even if they just do not conceptualize it. If this were not the case, conducting a sen-sible conversation would not be possen-sible at all. Consider the counter-example of user A asking user B a question, user C responding to A's question and then user D commenting on C's answer. If such patterns of interaction appeared frequently, reaching a point of unders-tanding - essentially the ultimate goal of human conversation - would be impossible. Sum-marizing, if locality is frequently found in real-life interaction traces, the same will be true in online traces as well. The same argumentation applies to speakers dominating conversation time: the phenomenon is rather caused by human factors (e.g. due to some humans being more communicative or possessing more developed leadership skills than others) and/or context (e.g. when part of the speakers is specialized on the discussion topic and therefore dominates) and not influenced by the communication medium in use. In fact, it has been shown [14] that in business meetings the domination of the highest rank participant is magni-fied in online conversations as compared to the face-to-face paradigm.
The above argumentation holds under two reasonable assumptions, namely a) that all communication parties perceive acceptable audio quality from any potential speaker and b) that all speakers are well accustomed with the communication medium (e.g. VOIP or
video-conferencing tool used). The above two assumptions guarantee that communication parties will not be impeded to behave naturally due to problems inherent to or otherwise caused by the communication medium.
VI. RESULTS
As manifested by the analysis outcome presented below, the two types of mUltiparty dis-course - meetings and lectures - exhibited different interaction patterns. We present first the results stemming from the analysis of meetings and then proceed to lecture results.
VI.l. Meetings
VI.1.1. Dominance
We first tested the hypothesis of dominating speakers. For each meeting, we calculated the dominance factor of every speaker exceeding his fair speaking ratio (as given by Equation 2) and counted the number of speakers exceeding a specific dominance factor threshold
Dthresh' We repeated the same procedure for various threshold values, ranging from
Dthresh
=
1 to Dthresh=
6 and using a step of 0.01. For each threshold value, we computed themean, standard deviation, minimum and maximum number of speakers exceeding it over all meetings. Figure 1 plots the rates of the four statistical indices against threshold value. Unfortunately, the plot does only convey information about the high variability of the mini-mum and maximini-mum number of speakers exceeding a given dominance factor across all mee-tings. We avoid drawing any conclusions using the average index due to the relatively high standard deviation of samples from the mean. In fact, the magnitude of standard deviation
316 K. KATRINIS - TURN-TAKJNG PATIERNS IN HUMAN DISCOURSE
remained always comparable to the mean, motivating us to further explore the cause of increased variance. 10 9 8 7 ~
..
6 .x..
..
Q. m 5 '0 ~ 4 J:l E ~ z 3 2o
Number of Speakers Exceeding Dominance Factor - -Mean # Speakers E)lceedillg
1 - ••• SId O .... - -.. MIn NSpeakef$ Exceeding "on 1 Max #Speak.ers ElCceedlng
\ \ \ \ 1
-~
II> C!....
-:~ . .... . . . ... ~~- --~ II> II> N ~ ,.., c.; ~ .... Dominance Factor ~ .... II> II> .,;H
f-I
I
II
I
1FIG 1. - Mean number of speakers exceeding a given dominance factor, averaged over all meetings and for various factor values. The plot shows the high variability, as manifested by the relatively
large standard deviation.
Nombre moyen d 'orateurs depassant unfacteur de dominance donne, calcule sur toutes les reunions et pour plusieurs facleurs. Le trace montre une grande variabilite
illustree par un ecart-type important.
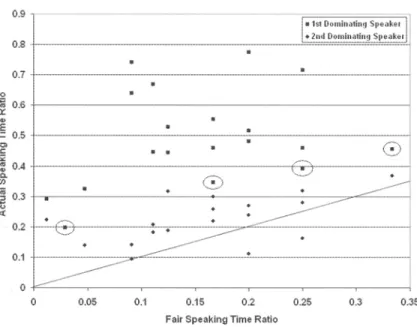
T. Towards this, we first calculated for each meeting the cumulative speaking ratio ~
event
for the two most talkative speakers - termed 1 SI and 2nd dominating speakers hereafter - and
plotted it against the fair speaking ratio of the event, the latter defined as
t.
The graph is depicted in Figure 2. We also show in the figure the reference "fair ratio" line, where all pairs would lie, if speaking time were equally allocated. The scattering of < fair speaking ratio, cumulative speaking ratio> pairs manifests that in the majority of meeting events, the 1st dominating speaker exceeded to a great extent his fair speaking ratio. However, four of the events did not follow this pattern. In fact, half of these "non-conforming" pairs (marked with a circle in Figure 2) correspond to the two highest fair speaking ratios of the plot or equiva-lently to two of the meetings with the lowest number of speakers. A possible explanation for this is that in very small meetings (in terms of speaker number), speakers are more easilyK. KATRINIS - TURN-TAKING PATTERNS IN HUMAN DISCOURSE 317
prompted to speak. Also, any potential implicit denial to communicate becomes much more apparent in very small meetings. This motivates all parties to speak more frequently and thus leads to speaking time being allocated closer to equally to all speakers. Particular to the second most talkative speaker, the deviation from fair speaking ratio was not noticeably high, as shown in the scatter plot, and therefore the hypothesis of having two speakers significantly dominating is defeated. 0.9 0.8 0.7 o ~ 0 .6 Ir
.,
E i= 0.5'"
"
:;;: :: 0.4 Q. <h ~ 0.3 ~ 0.2 0.1 o o1 stl2nd Dominating Speaker Ratio VS. Fair Ratio
I-
1st Oomin .ltiny SpeJkef t1
. 2otl Domin ating Slle.lke ,
·
·
.
·
·
·
•
·
•
0
. ·
·
r--...·
0
"-.:.../~
.
·
·
.
: ~
·
.
~·
\..:;/~
·
. ·
·
---
0.05 0.1 0.15 0.2 0 .25 0.3 0.35 Fair Speaking Time RatioFIG 2. - Scatter plot comparing the fair speaking ratio to the actual speaking ratio of the two most talkative speakers and for each meeting.
Nuage de points comparant Ie rapport de parole juste au rapport effectif pour les deux orateurs les plus bavards de chaque reunion.
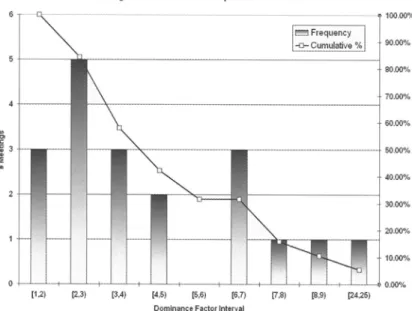
We quantify the degree of the 1 sl dominating speaker's dominance in the histogram
pre-sented in Figure 3. The dominance factor was at least 3 in 57.89% of the meetings, whereas only 15.79% had the 151 dominating speaker talk less than twice its fair speaking time.
Reco-. gnizing that the dominance factor is a measure dependent on total speaker number, we also plot the mass of the dominance compared to total meeting duration. For this, we cluster the cumulative speaking ratios of the pI dominating speakers using a bin-interval of 10% and illustrate the clusters' frequency over all meetings in Figure 4. The cumulative curve in this histogram conveys that in 73.68% of the meetings, the dominance of the most talkative spea-ker spanned at least 40% of the total session duration. Given the fact that all but one meetings comprised of four or more participants (i.e. fair ratio :5: 25%), we conclude that dominance was clearly noticeable in almost 75 % of the cases.
318 K. KATRlNIS - TURN-TAKING PATTERNS IN HUMAN DISCOURSE
.
aHistogram of most dominant Speaker's Dominance Factor
100.00% 90.00% 9O.OCl'~ 70.00% 60.00%
!
3 i r - - - ----ll 50.00% 40.00% 30.00% 2O.OCl'~ 10.00% I ! I ! I I I I I I t I I '0.00% 11.2) 12.3) [3,4) (4.5) (5.6) (5.7) [7.8) (\1.9) (24.25)Domlnanet Factor Internl
FIG 3. - Frequency of dominance factor for the I" dominating speaker, clustered in one unit intervals over all meetings.
Frequence du Jacteur de dominance de I' orateur Ie plus dominant avec regroupement par intervalle d'une unite.
Histogram of most dominating Speaker's Speaking Time to Meeting Duration
7 6 I .... ", ~ 4 , _ _ _ _ _ _ _ _ _
J
'il ~.. 3,---··
0 +1~~~ __ ~~~~+_~--~~~---L_+--L-~--~~~~4 120.30) (30.40) (40.50) [50.60) (60.70) [70.80) Speaking Time Ratio100.00% 90.00% 80.00% 70.0004 60.0004 50.00"4 40.0004 30.00% 20.00% 10.00% 0.00%
FIG 4. - Distribution of the ratio of the 1 st dominating speaker's total speaking time to meeting duration
over all meetings. The ratios are clustered in lO%-bins.
Distribution des rapports du temps de parole de I' orateur Ie plus dominant au temps total de fa reunion, regroupes par blocs de multiples de 10 %.
K. KA1RINIS - TURN-TAKING PATTERNS IN HUMAN DISCOURSE 319 VI.1.2. Speaker Prediction
We further tested the MICASE meeting traces against the hypothesis of correct future
spea-ker prediction (with acceptably high success probability). As discussed in Section m.2, we hypothesized the existence of temporal locality in tum-taking and therefore specified for each tum the probability of the tum's source matching one of the speakers in the near past (see Equation 4). We experimented with three separate previous speakers' window sizes w, namely w = 2, w=3 and w=4 respectively. We excluded Meeting-l 5 from the entire analysis, for its low participation level (three speakers) would obscure the analysis with positive results not caused by the prediction method's efficiency. For the same reason, we excluded meetings with four and five speakers, when testing locality with window sizes of w = 3 and w=4.
Table m shows the mean probability of successful prediction for all three window sizes. Clearly, guessing the next speaker correctly out of the last two speakers failed in almost
t
of the times, exhibiting also high variability. Adding one more speaker to the prediction possi-bilities (w=
3) improved the mean success probability by 14.08%. As it can be seen in the Table, the magnitude of the standard deviation for w = 3 turned the benefit of using a larger window to marginal compared to the mean success probability of w=
2. For this reason, we also show for each window size the highest of the 10 %, 15 % and 25% worst success proba-bilities over all meetings (percentiles). For w = 3, the 25 %-percentile conveys that correct prediction failed in±
of the cases with probability of up to fairly 22%. Therefore, we decided to further increase the previous speaker's window to w=
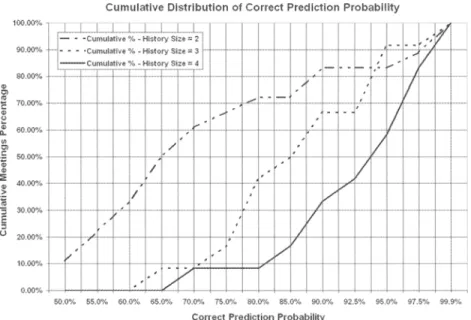
4. Although this brought almost half the benefit of the last window expansion, it yielded average successful prediction in more than 91 % of the times. Also, it reduced standard deviation to less than 10% of the mean. Overall, 90% of the meetings had a failure probability of fairly less than 15%.We further depict in Figure 5 the cumulative distribution of success probabilities over all meetings. For a given prediction probability p on the horizontal axis of the graph, the respec-tive value on the vertical axis corresponds to the fraction of meetings with successful predic-tion probability less or equal than p. As an overview, the figure illustrates the increase of benefit as the window size increases. Additionally, the graph is useful in studying the worst case behavior of the best performing window size (w = 4 depicted by the solid curve). We observe that more than almost 91 % of the meetings yielded a success probability of over 80%. In fact, the two worst correct prediction probabilities for w = 4 were 67.91 % and 84.53 %. This manifests that prediction succeeded with high probability in almost all of the meetings. More importantly, the latter occurred independently to the total number of poten-tial future speakers (group size). For instance, this was the case for Meeting-7 (84 speakers) and Meeting-5 (21 speakers) with success probabilities of 94.93% and 84.53% respectively. Also, it is worth mentioning that of the three meetings with the least number of total speakers (six), two were not among the first five meetings that scored the best prediction ratios. Notice in Figure 5 that for correct prediction probabilities over 94%, the curve for w= 2 surpasses the curve for w=3, against the intuition that narrowing the previous speakers' window should normally yield worse or in the best case equal prediction results. This discrepancy lies on the fact that we excluded all meetings with four or five speakers from the analysis for w ~ 3 and at the same time in part of the excluded meetings the success probability was over 94% for window size w = 2.
320 K. KATRINIS - TURN-TAKING PATIERNS IN HUMAN DISCOURSE
T ABLE
m. -
Average probability of successful next user prediction, variability and percentilesover all meeting events and for three distinct history sizes (2, 3 and 4).
Probabilite moyenne de prediction avec succes du prochain orateur, calculee
sur to utes les reunions pour trois tailles d'historique (2, 3 et 4).
Mean Success Std. Dev. 10% 15% 25%
Probability Percentile Percentile Percentile
History Size w
=
2 70.45% 17.07% 50.80% 53.28% 57.95%History Size w=3 84.53% 11 .39% 75.12% 76.80% 78.36%
History Size w=4 91.50% 8.71 % 84.86% 86.64% 88.68%
. - - -
'---Cumulative Distribution of Correct Prediction Probability
1ooJ)0% 90.00%
I I I I I I I I I
... . )1
H: .
·Cumulatlv. % -HlOtory $1,.: 21 - • ~ ' Cumulatlve °4· History SiH'::: 31
V
- - Cumulative %. HI.tory Size;;;; 4
.
-
-
1-"80.00'1.
..
Cl to 70.00% E..
(J:-
60.00"4...
<II Cl .§..
50.00%..
:;: 40.00"4..
/.V
!..
-. . .
II
.
.
.
/
/ /.
V
> "j I ,/~
30.00% u 20.00"4 / ---
-/ / 10.00"4 '/V
0.00"4 /'V
50.0"4 55.0% 60.0% 65.0% 70.0% 75.0"4 80.0% 85.0"4 90.0% 92.5% 95.0% 97.5% 99.9"4Correct Prediction Probability
FIG 5. - Cumulative percentage of meetings against correct prediction probability for three interaction history sizes. For a given prediction probability p (x-axis), the respective value on the y-axis shows the
fraction of meetings with successful prediction probability less or equal than p.
Pourcentage cumule de reunions enfonction de la probabilite correcte de prediction. En abscisse, la probabilite de prediction, en ordonnee Ie faux de reunions avec une probabilite
de prediction reussie infe rieure ou egale
a
p.VI.2. Lectures
Unlike meeting-like discourse, in educational lectures only a small fraction of the partici-pants speaks throughout the session, while the rest attends passively. The hi stogram in Figure 6 quantifies this phenomenon. Not unexpectedly, the ratio of speakers to group size is
K. KATRINIS - TURN-TAKING PATTERNS IN HUMAN DISCOURSE 321
below 10% in 60% of the analyzed lecture sessions, whereas only 15% of the lectures trigge-red the active participation of more than 50% of the attendees.
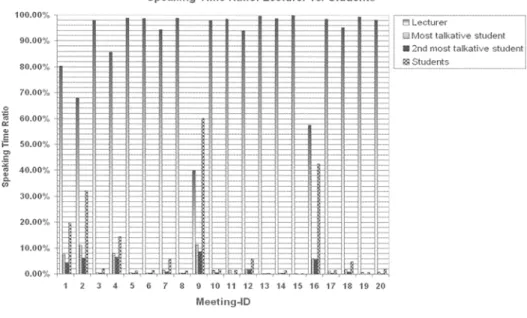
Likewise, the domination of the lecturer in terms of speaking time is also an expected characteristic of lecture discourse. Still, it is unclear for those cases, where the active parti-cipation of students is high, whether particular students dominate the total student speaking time. Figure 7 illustrates the ratio of speaking time to lecture duration of: a) the lecturer, b) the first and second most talkative students and c) the total student contribution to speaking time. The first and most obvious observation is the clear domination of the lecturer (with one exception in lecture 16, where the tutor's speaking time was under 60%). As for the exis-tence of a student dominating total student time, this is hardly evident in the results. Even in the few cases, where the ratio of the most talkative student was a large fraction of the total student time, this does not justify for an application or service to differentiate this particular student from the rest of the students. For, his absolute speaking time is still insignificant com-pared to total session duration. This is particularly true in 16 out of 20 lectures (or 80%) of our dataset.
Due to low degree of interactivity - as indicated by the dominance results presented above - the amount of lecture time exhibiting temporal locality was very small compared to total event duration. Thus, applying speaker prediction to services supporting lecture dis-course would be overkill, for such an optimization would be infrequently used. For this rea-son, we did not further study speaker prediction in the case of lecture interaction.
::..
<>
Speaker/Participants Ratio Histogram
8 7
+.
I - ... ... 'V! I 6 1....,.c
5 120.00% 100.00% 80.00% ~ 4I
---+1 60. 00 ~. 3 40.00% 2 20.00% o I I I I I I I I I I I I I I I I I I I I I I I I I I I 0.00°/. 5 10 15 20 25 30 35 40 45 50 55 60 65 70 75 80 85 90 95 100SpeakerlPanJcJpanrs Perc enrage
FIG 6. - Fraction of lecture participants, who spoke at least once, to total number of participants. The frequencies show clearly that only a small fraction of participants talked.
17120
Taux de participants ayant pris au mains une jois la parole. On voit nettement que seule une petite partie des participants s ' est exprimee.
322 100.00% 90.00% 80.00% 70.00% 0 ~ 60.00%
'"
..
E ;:: 50.00% ." c: ~..
40.00% Q..,
30.00-!. 20.00% 10.00% 0.00%K. KATRlNJS - TIJRN-TAKING PAlTERNS IN HUMAN DISCOURSE
Speaking Time Ratio: Lecturer VS. Students
1_~1-_-I-r-_ ~ _ : 1= - h §Mo turer - - .-t---. - _. I-- - . 2n, I-- ~a 1- - 1-1- 1= I=-~
--= ..
'1--- r- - - -i--1- t-I - - H -~.1==
- .-I---~~
. - .... -1--- ~=~~ - I--1==1==
f::: f:::=::I=::1
1= I==I==J
.... -I-f
--: rr:= -
1- . ~ ~F=
=
I;-;,-rdl-I::-:-= 4 7 9 10 11 12 13 14 15 16 17 18 19 20 Meeting.IO 5t talkative student most ta Ikative student dent sFIG 7. - In only 3 out of the 20 lecture sessions was the speaking time of students comparable to the lecturer's speaking time.
Le temps de parole des etudiants n' est comparable au temps de parole des conjerenciers que dans seulemenf 3 cas sur 20.
VII. CONCLUSION
The results of this study confirmed the claim that natural multiparty human interaction (i.e. interaction without explicit role assignment to speakers) exhibits high temporal locality. Even more, the analysis outcome showed that for varying group sizes the speaker taking a new turn is with high probability one of the last four spoken participants. This finding streng-thens the validity of previous designs that employed future speaker prediction as a means of optimizing group communication. In general, it motivates future services to bias design opti-mization towards locality in turn-taking.
Furthermore, our results indicated that speaking time is not equally allocated to all dis-course parties, but instead speakers that monopolize the word do exist. This was clearly evi-dent in the results of lectures' analysis, where a single dominating speaker (the lecturer) outweighed by far the students' activity. The same was true for meeting-like interaction, however here the speaking time mismatch between the most talkative speaker and the rest of the speakers was not as significant as in the case of lectures. As such, it remains unclear, whether the benefit of differentiating the group communication service offered to meeting participants according to speaking time would sufficiently exceed the cost of realizing this differentiation. On other hand, this is definitely true for lecture sessions.
Note that the scope of our results is strictly limited to the domain, in which we studied human interaction. Herein, we exclusively analyzed discourse in the academic community,
K. KATRINIS - TURN-TAKING PATTERNS IN HUMAN DISCOURSE 323
where speakers have a certain profile and act in a specific environment. Generalizing the validity of our findings in other fields of social life - e.g. business meetings or political debates - requires further analysis of related interaction traces and surely constitutes an inter-esting extension to the contributions of this paper. Moreover, former studies [12] have shown that interaction behavior may differ depending on language spoken and ethnical characteris-tics. Hence, the interpretation of our results applies primarily to Native American English speakers, as manifested by the profile of all speakers in our dataset.
In general, we see our work strengthening the argument that there is value in incorpora-ting user-behavior awareness into group communication service design. For services that are realized in the network layer (e.g. Source-Specific Multicast), this implies shifting part of the functionality to the application layer, where the exploitation of user-behavior characteris-tics becomes possible. In our future work, we plan to evaluate the efficiency of further pre-vious window management (or cache management) strategies complementary to least recently spoken participants. Additionally, extending the scope of the present analysis to other domains - primarily to business discourse - forms an interesting topic of the related research agenda.
Acknowledgements
The authors would like to kindly thank Thomas D_bendorfer, Karoly Farkas and Placi Flury for providing valuable feedback on the entire paper. Also, we are grateful to Nick Blun-dell at Lancaster University for sharing his thoughts on pattern similarity between face-to-face and online discourse.
Manuscrit rq:u Ie 30 juin 2005 Accepte Ie 9 mars 2006
REFERENCES
[I] SILBERSCHATZ (A.). GALVIN (P.), GAGNE (G.), Applied Operating System Concepts, Wiley, 1999.
[2] PARMENTELAT (T.), BARZA (L.), TURLETTI (T.), DABBOUS (W.), A Scalable SSM-based Multicast Communication Layer for Multimedia Networked Virtual Environments", Technical Report RR-5389, INRIA, Sophia Antipolis, November 2004.
[3] HOLBROOK (H.), CAIN (B.), Source-specific Multicast for !P, Internet Draft (work in progress), Internet Engineering Task Force, 2003.
[4] SACKS (H.), SCHEGLOFF (E.), JEFFERSON (G.), Simplest Systematics for the Organization of Turn-taking for Conversation, Language, 50, n° 4, pp. 696-735, 1974.
[5] POTTER (J.), Discursive Psychology: Between Method and Paradigm, Discourse Society, 14, n° 6, pp. 783-794, 2003.
[6] HAMMERSLEY (M.), "Conversation Analysis and Discourse Analysis: Methods or Paradigms?", Discourse
Society, 14, n° 6, pp. 751-781, 2003.
[7] McKINLAY (A.), ARNOTT (l), A Study Of Turn-Taking In A Computer-Supported Group Task, Proceedings of
the Eighth Conference of the British Computer Society, Human Computer Interaction Specialist Group, People
and Computers VlIf (HCI '93), Loughborough, UK, 1993.
324 K. KATRINIS - TURN-TAKING PATIERNS IN HUMAN DISCOURSE [8] BLUNDELL (N.), MATHY (L.), Minimizing Perceived Latency in Audio-Conferencing Systems over Application-Level Multicast, Second International Workshop on Multimedia Interactive Protocols and Systems (MIPS
2004), Grenoble, France, November 16-19, 2004, pp. 1-12.
[9] KATRINIS (K.), BRYNJULFSSON (B.), HJALMTYSSON (G.), PLATTNER (B.), Dynamic Adaptation of Source Specific Distribution Trees for Multiparty Teleconferencing, to appear in CONEXT 2005, Toulouse, France, October 24-27,2005.
[10] HOLBROOK (H.), CHERITON (D.), IP Multicast Channels: EXPRESS Support for Large-scale Single-source Applications, ACM SIGCOMM Computer Communication Review, 29, nO 4, pp. 65-78, Oct. 1999.
[II] "MICASE: Michigan Corpus of Academic Spoken English", http://www.hti.umich.edu/m/micase/ [online sour-ce],2002.
[12] WEILHAMMER (K.), RABOLD (S.), Durational aspects in Tum Taking, Proceedings of the International Conference of Phonetic Sciences, Barcelona, Spain, 2003.
[13] TEN BOSCH (L.), OOSTDIJK (N.), DE RUITER (1. P.), Durational Aspects of Tum-taking in Spontaneous Face-to-Face and Telephone Dialogues, Proceedings of Conference of Text, Speech and Dialogue, Bmo, September,
2004.
[14] FRANCE (E.), ANDERSON (A.), GARDNER (M), The Impact of Status and Audio Conferencing Technology on Business Meetings, International Journal of Human-Computer Studies, 54, n° 6, pp. 857 - 876, 2001.