ABSTRACT: Dry fractionation of milk fat is a common tech-nique used to produce fat fractions with physical properties that are suitable for a variety of food and pharmaceutical products. During milk fat fractionation, the partial crystallization of tria-cylglycerols from the melt is the most important step. The effi-ciency of the separation of the crystals from the suspension is also important, but the crystallization itself influences the chem-ical composition and thereby determines the properties of the crystal fraction. At low supercooling, the crystallization kinetics are slow, and thus process time is increased. With increased ki-netics due to a strong supersaturation, the chemical composi-tion of the crystals is changed compared to crystals formed under slow kinetic conditions. This study shows to what extent controlled temperature and supercooling during milk fat crys-tallization influence crystal amount and the physical properties of the resulting fractions. Differences of the thermal characteris-tics of the crystal suspensions are directly detected by differen-tial scanning calorimetry and nuclear magnetic resonance. At slow crystallization kinetics, the melting temperature range of the crystals in the suspensions is broader, and the resolution of the melting peak is higher. It is shown that compound crystals are formed when supercooling is performed, even if the super-cooling takes place only for a short period of time. Controlled temperature conditions during crystallization govern larger dif-ferences in the fatty acid and triacylglycerol composition of the liquid and of the crystalline phases, compared to fractions crys-tallized under supercooling conditions, which contain a high amount of compound crystals.
JAOCS 75, 897–904 (1998).
KEY WORDS: Compound crystals, crystallization, differential scanning calorimetry, fractionation, milk fat, mixed crystals, nu-clear magnetic resonance, polymorphism, process control, tri-acylglycerol composition.
Milk fat has a heterogeneous nature. It contains a large vari-ety of fatty acids with different chainlengths. So far, over 400 different fatty acids have been identified in milk fat (1–3). The triacylglycerol composition is even more complex be-cause the theoretical number of possible combinations of these fatty acids in triacylglycerols is 4003. Due to its com-plex composition, the melting range of milk fat is broad and
spans from about −40 to 40°C. Furthermore, the composition changes with season, region, and feeding (4). These physical properties and variations restrict the use of milk fat in food and pharmaceutical or cosmetic products. To overcome these limitations, fractionation is performed (5). The techniques used for fractionation are varied. They are reviewed by Kreulen (6), Deffense (7), and Hamm (8). The most common dry fractionation is the separation of triacylglycerols on the basis of their melting ranges. A single-step fractionation yields a hard and a soft fraction, which are called stearin and olein, respectively.
Dry fractionation consists of two steps, a partial crystal-lization of triacylglycerols from a melt and a subsequent sep-aration. The resulting differences in the fractions depend on the process characteristics and parameter settings. The effi-ciency of separation of the liquid (olein) from the crystalline phase (stearin) influences the quality of the solid fraction to a great extent. The more liquid is removed, the greater are the differences in the solid fraction, compared to the original milk fat (7,9). The crystallization step has a greater influence on the chemical composition of the pure fractions.
Crystallization in general can be divided into two charac-teristic process steps: nucleation and growth. To crystallize a fat compound, supersaturation or supercooling is necessary. This is the driving force for both crystallization steps (10).
For fat systems, crystallization is complex because natural fats are a mixture of various triacylglycerols. Consequently, the concentration of each triacylglycerol is low and, for ex-ample, increased supercooling is needed to achieve nucle-ation of this low concentrated species.
Furthermore, triacylglycerols are characterized by a com-plex melting behavior. They can solidify in three different crystal structures (α, β′, β) (polymorphism). Different crystal grid structures result depending on the magnitude of the driving force of crystallization. Less stable modifications re-quire a lower driving force. The different polymorphic modi-fications have different thermodynamic stability, and the metastable polymorphic modifications (α, β′) are transformed with time to the stable β form.
In a multicomponent fat, such as milk fat, compound crys-tals can easily be formed due to the low supersaturation of one triacylglycerol (11). Compound or mixed crystals are composed of different molecular species, favored by similar *To whom correspondence should be addressed.
E-mail: [email protected]
Parameters Influencing Cocrystallization
and Polymorphism in Milk Fat
Birgit Breitschuh and Erich J. Windhab*
Institute of Food Engineering, Department of Food Science, Swiss Federal Institute of Technology (ETH), 8092 Zurich, Switzerland
chainlength of the fatty acids (12). Preferably, they form metastable modifications because the crystal lattice is not very dense. Compound crystals cause a narrow melting range and a higher crystal fraction (13); furthermore, unstable poly-morphic forms (α, β′) may persist almost indefinitely.
Due to its complex composition, the crystallization of tria-cylglycerols in milk fat and milk fat fractions is not well known (14). If the temperature is gradually decreased, suc-cessive crystallization of triacylglycerols occurs. The param-eters that influence crystallization and the properties of the final fractions consist of the degree of supercooling, tempera-ture, and residence time.
The aim of this study is to determine the effect of crystal-lization temperature and supercooling on the physical and chemical characteristics of the resulting milk fat fractions. The investigations are based on direct measurements of the calorimetric properties of a crystal suspension, thus detecting crystal temperature memory as well as the crystal amount in a suspension.
MATERIALS AND METHODS
Sample. Anhydrous milk fat was obtained from Aargauer
Zen-tralmolkerei Suhr (Suhr, Switzerland). The melting point of the milk fat was 35°C [corresponding to less than 1.5% solid fat content measured by nuclear magnetic resonance (NMR) (15)]. The fatty acid composition of the milk fat is given in Table 1, and the triacylglycerol composition is given in Table 2.
Standardized preparation of crystal suspensions. The milk
fat was crystallized in a rheometer (Bohlin Visco 88; Bohlin Instruments Inc., Cranbury NJ; Searle principle) at defined temperatures and a constant shear rate of 1041 s−1until an equilibrium state was reached. Further information is pro-vided elsewhere (16).
Separation into milk fat fractions. To analyze the resulting
fractions, the crystal suspensions were filtered in a pressure filter (BHS, Sonthofen, Germany). The equilibrated crystal
suspensions (created in the rheometer) were filtered 15 min at 1.5 bar, and the filter medium used was Nybolt PA 1/1/C (Sefar Inc., Heiden, Switzerland) with a pore size of 1 µm.
Calorimetric measurements. The calorimeter used was
a DSC Gold+ (Rheometric Scientific GmbH, Bensheim, Germany) with an accuracy of 1 µW. Gallium [h = 18.95 cal/g,
T (melting) = 29.765°C] was used for temperature and
en-thalpy calibration, and the instrument was calibrated at 10°C/min. Aluminum pans were used, and the sample weight was about 1–5 mg. One drop of a crystal suspension was in-serted into an empty pan and immediately (within seconds) measured at a constant heating rate of 10°C/min, registering the heating curve. As a reference, an empty pan was measured at the same time. For analysis of the heat of fusion, the area between the heat flow curve and the extrapolated baseline was determined. The cooling was performed by using liquid nitro-gen as refrigerant. Further details are provided elsewhere (16).
Nuclear magnetic resonance. The instrument used in these
investigations was a Minispec NMS 120 (Spectrospin, Bruker Analytical and Medical Instruments, Fällanden, Switzerland). The solid fat content was measured directly from the crystal suspensions (16).
Gas chromatography. The fatty acid composition was
de-termined as methyl esters by gas chromatography (HP 6890, FID, Hewlett-Packard, Basel, Switzerland) on an SGE BPX-70 (Infochroma, Zug, Switzerland) column. The triacylglyc-erol composition was analyzed in a gas chromatograph (HP 6890) with an apolar column (J&W DB-5HT, MSP Friedi, Koeniz, Switzerland). The fat was diluted in heptane. The re-sults are expressed as mean average weight percentages on a fatty acid or triacylglycerol basis, respectively (17–19).
RESULTS
Crystallization kinetics. Because milk fat is a
multicompo-nent fat, the amount of triacylglycerols that crystallizes is mainly dependent on the crystallization temperature. In a rheometer for reproducible simulation of a crystallization
TABLE 1
Fatty Acid Composition of Milk Fat and Separated Suspensions Crystallized in a Rheometer Directly at Fractionation Temperaturea
Stearin 34°C Olein 34°C Stearin 32°C Olein 32°C Stearin 30°C Olein 30°C Stearin 28°C Olein 28°C Stearin 26°C Olein 26°C
Milk fat (34°C) (34°C) (32°C) (32°C) (30°C) (30°C) (28°C) (28°C) (26°C) (26°C) Butyric acid 4.10 3.00 4.40 2.90 4.50 3.10 4.70 3.60 4.80 3.30 4.80 Caproic acid 2.40 1.70 2.50 1.70 2.60 1.80 2.70 2.00 2.70 1.90 2.70 Caprylic acid 1.30 1.00 1.40 0.90 1.40 1.00 1.40 1.10 1.50 1.10 1.50 Capric acid 2.70 2.10 2.80 2.10 2.80 2.30 2.80 2.40 2.80 2.40 2.90 Lauric acid 3.20 2.90 3.30 2.90 3.30 3.10 3.30 3.20 3.30 3.20 3.30 Myristic acid 10.50 10.90 10.50 11.00 10.40 11.20 10.30 11.10 10.20 11.30 10.10 Palmitic acid 27.60 33.20 27.30 32.80 26.60 32.40 26.30 31.00 25.90 31.20 25.80 Margaric acid 0.70 0.90 0.70 0.90 0.70 0.90 0.70 0.80 0.70 0.80 0.70 Stearic acid 10.60 15.40 10.20 14.80 9.70 14.30 9.50 13.10 9.40 13.20 9.30 Oleic acid 25.50 19.90 25.70 20.00 26.60 20.40 27.00 21.50 27.20 21.60 27.30 Linoleic acid 2.00 1.60 2.00 1.70 2.10 1.60 1.90 1.80 2.10 1.80 2.10 Linolenic acid 0.90 0.70 1.00 0.70 1.00 0.70 1.00 0.80 1.10 0.70 1.10 Arachidic acid 0.90 0.80 0.80 0.80 0.80 0.60 0.80 0.60 0.90 0.60 0.90
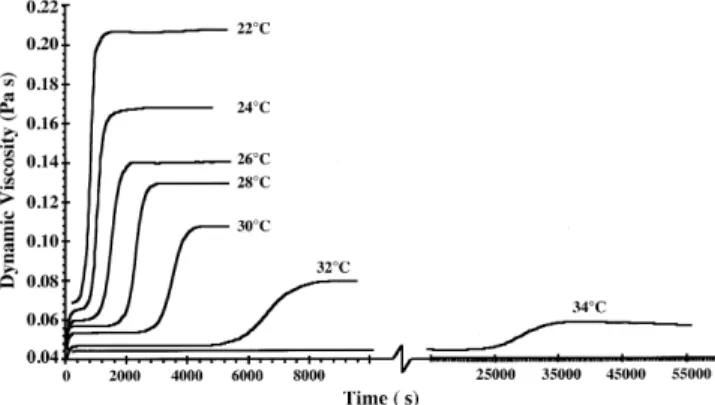
process under well-defined shear flow conditions, the crystal-lization can be monitored by the related viscosity changes vs. time (16). After reaching a temperature equilibrium, the New-tonian milk fat melt shows a constant viscosity until nucle-ation starts, and the viscosity increases with the crystalliza-tions progress (Fig. 1). When crystallization is almost fin-ished, a constant viscosity is reached. We found that on a long time scale (several hours), an additional 0.5% of triacylglyc-erols crystallizes until equilibrated at this temperature.
Crystallizing milk fat at a constant shear rate of 1041 s−1, the viscosity increase due to crystallization is faster at a lower temperature (Fig. 1). At low temperatures, the high-melting triacylglycerols are more strongly supercooled, and thus the crystallization kinetics are faster. Crystallization is also fin-ished earlier due to the increased kinetics under supercooling and the higher amount of crystallizable triacylglycerols. The final plateau viscosity is higher at lower crystallization tem-peratures because more triacylglycerols are supercooled and crystallize. Table 3 gives an overview of the directly measured specific heat of fusion [measured by differential
scanning calorimetry (DSC)] and the crystal amount (measured by NMR) of the suspensions that were crystallized at a constant shear rate of 1041 s−1at different constant tem-peratures.
At a lower crystallization temperature, the stronger super-cooling of the higher-melting triacylglycerols may cause the formation of unstable polymorphic crystal lattices (20). Fur-thermore, as shown by different researchers (12,13), with stronger supercooling, triacylglycerols of similar chainlength may form compound crystals. These phenomena result in a narrowed melting range, which will be slightly shifted to lower temperatures (13,21).
Melting characteristics. Figure 2 shows the melting curves
of equilibrated milk fat suspensions that were crystallized di-rectly at the crystallization temperature. The lower the crys-tallization temperature, the higher the heat of fusion, as shown by the increase of the area below the baseline (normal-ized heat flow). The beginning of melting (onset temperature) is decreased at lower crystallization temperatures (Table 3), which govern crystallization of lower-melting
triacylglyc-TABLE 2
Triacylglycerol Composition of Milk Fat and Separated Suspensions Crystallized in a Rheometer Directly at Fractionation Temperaturea
Stearin 34°C Olein 34°C Stearin 32°C Olein 32°C Stearin 30°C Olein 30°C Stearin 28°C Olein 28°C Stearin 26°C Olein 26°C
Milk fat (34°C) (34°C) (32°C) (32°C) (30°C) (30°C) (28°C) (28°C) (26°C) (26°C) C24 0.06 0.04 0.06 0.03 0.05 0.03 0.06 0.04 0.05 0.03 0.06 Cholesterol 0.32 0.23 0.32 0.21 0.32 0.22 0.34 0.25 0.34 0.23 0.34 C26 0.28 0.20 0.27 0.17 0.24 0.19 0.29 0.21 0.28 0.17 0.27 C28 0.62 0.43 0.62 0.39 0.57 0.41 0.64 0.47 0.65 0.41 0.64 C30 1.12 0.81 1.15 0.74 1.11 0.79 1.20 0.90 1.21 0.81 1.20 C32 2.31 1.60 2.34 1.57 2.33 1.66 2.48 1.82 2.48 1.73 2.48 C34 5.39 3.89 5.65 3.83 5.78 4.03 5.85 4.32 6.02 4.20 6.06 C36 10.33 7.17 10.53 7.17 10.91 7.53 11.08 8.29 11.27 8.00 11.35 C38 12.25 8.71 12.77 8.70 13.24 9.06 13.52 9.85 13.49 9.80 13.60 C40 9.78 7.02 9.96 7.04 10.31 7.50 10.53 8.08 10.73 7.98 10.81 C42 6.52 5.56 6.67 5.60 6.67 5.82 6.70 6.06 6.70 6.12 6.72 C44 5.84 6.12 5.81 6.35 5.72 6.58 5.59 6.46 5.49 6.68 5.41 C46 6.96 9.40 6.67 9.59 6.41 9.31 6.20 8.86 5.99 9.05 5.90 C48 9.13 13.13 8.73 13.17 8.41 12.80 8.02 11.74 7.83 11.88 7.73 C50 11.90 16.61 11.60 16.37 11.17 15.65 10.86 14.58 10.72 14.99 10.65 C52 11.43 13.30 11.05 13.41 11.01 12.91 10.98 12.48 10.90 12.43 10.85 C54 5.75 5.80 5.80 5.66 5.76 5.51 5.67 5.54 5.85 5.48 5.94
aConcentrations given in wt% of total triacylglycerol content.
FIG. 1. Viscosity as a function of time at a constant shear rate of
1041 s−1and different constant temperatures (couette, 1.25 mm gap).
TABLE 3
Solid Fat Content, Heat of Fusion, Onset and Offset Temperatures, and Standard Deviations of Milk Fat Suspensions Directly Crystallized at the Listed Temperatures Until an Equilibrium Was Reached at a Constant Shear Rate of 1041 s−1
Crystallization Solid fat Heat Onset Offset temperature content of fusion temperature temperature
(°C) (%) (J/g) (°C) (°C) 26 9.50 (0.14)a 12.50 (0.31) 27.49 (0.44) 44.18 (0.78) 28 7.24 (0.23) 9.99 (0.09) 29.09 (0.43) 44.68 (0.95) 30 5.45 (0.02) 7.80 (0.24) 31.29 (0.33) 44.70 (1.86) 32 4.14 (0.09) 4.85 (0.45) 33.34 (0.58) 44.21 (1.08) 34 2.41 (0.11) 2.49 (0.29) 35.45 (0.30) 44.39 (0.69)
aNumbers in parentheses are standard deviations in the same units as the
erols. Furthermore, the maximum melting of the crystals is shifted to lower temperatures. At a lower crystallization tem-perature, higher-melting triacylglycerols are more strongly supercooled, which means that more unstable polymorphic modifications appear (20). At the same time, stronger super-cooling benefits compound crystallization of triacylglycerols with similar chainlengths. These effects result in decreased melting temperatures.
When crystallizing milk fat until equilibrium at 34°C, the crystallization kinetics are slow due to the low amount of tri-acylglycerols that may crystallize (2.4%, Table 3) and due to the low supercooling of these triacylglycerols. The crystal-lization takes place over about 9 h (Fig. 1). After temperature equilibrium at 34°C, the crystallization temperature of the suspension is decreased by 2°C under continuous shearing until equilibrated at the new crystallization temperature (32°C). By decreasing the temperature further triacylglyc-erols are supercooled. Because the higher-melting crystals, which already exist in the suspension, serve as nuclei, crys-tallization time is lowered. The newly crystallized triacyl-glycerols grow around the existing crystals in the suspension; no nucleation needs to take place (22). This stepwise crystal-lization is performed from 34 to 26°C.
The melting curves of these stepwise crystallized milk fat suspensions are shown in Figure 3. Due to the temperature decrease in the suspension and further growth of the existing crystals, the temperature range of melting is only changed in the onset temperature, which here is lowered (Table 4). The off-set temperature of the crystal suspensions stays constant by further crystallization (larger crystal amounts in the sus-pensions). By decreasing the temperature stepwise, a second maximum (~32°C) of melting appears in the suspension. The triacylglycerols with a melting range between 34 and 26°C appear to be soluble.
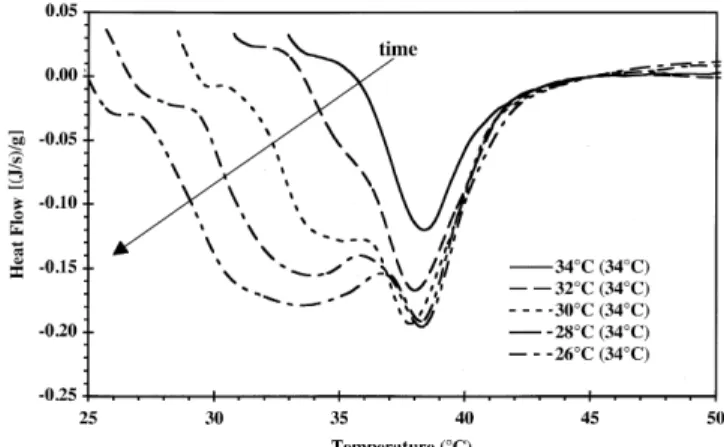
If crystallization takes place at 26°C, at higher supercool-ing of the highest-meltsupercool-ing triacylglycerols, less stable modifi-cations of the triacylglycerols are formed, as well as com-pound crystals due to the stronger supercooling. Figure 4 shows the melting curves of the crystal suspensions that were
crystallized at 26°C and stepwise melted to the final equilib-rium temperature. Only one melting maximum occurs when nucleation is performed at strong supercooling (26°C). This melting maximum is then shifted to a lower temperature, compared to the slow and stepwise crystallized suspensions shown in Figure 3. The melting range is also narrowed. By raising the temperature, the crystals with a melting point be-tween 26°C and the new temperature will melt. Therefore, the onset temperature increases (Table 5).
Focusing on the two extreme temperatures (26 and 34°C), crystallized by slow temperature decrease or at low tempera-ture and partially melted, respectively, the differences are ob-vious (Figs. 3 and 4). The solid fat content is 2.3% higher in the supercooled suspension, and the heat of fusion is 1.3 J/g higher (Tables 4 and 5). A second maximum in the slow, step-wise crystallized sample exists (Fig. 3) at a lower tempera-ture. In the 34°C suspensions, the differences in solid fat con-tent and heat of fusion are small and stay within the standard deviation. The direct, slowly crystallized suspension shows a slightly higher melting maximum, compared to the sample where nucleation took place at 26°C. The differences in the melting characteristics may indicate different polymorphic modifications of the crystallized triacylglycerols. But on a long time scale (several days), no polymorphic
transforma-FIG. 2. Melting curves of temperature-equilibrated milk fat suspensions
crystallized directly at crystallization temperature.
FIG. 3. Melting curves of temperature-equilibrated milk fat suspensions
crystallized under decreasing temperatures stepwise from 34°C down to 26°C.
TABLE 4
Solid Fat Content, Heat of Fusion, Onset and Offset Temperatures, and Standard Deviations of Temperature Equilibrated Crystal Suspensions Crystallized Under Decreasing Temperatures from 34°C Down to 26°C
Crystallization Solid fat Heat Onset Offset temperature content of fusion temperature temperature
(°C) (%) (J/g) (°C) (°C) 26 7.16 (0.12)a 11.24 (0.25) 27.07 (0.08) 45.21 (0.52) 28 5.67 (0.27) 8.96 (0.49) 29.00 (0.15) 44.77 (0.88) 30 5.11 (0.24) 6.84 (0.37) 31.11 (0.18) 45.24 (0.52) 32 3.77 (0.11) 4.75 (0.16) 32.95 (0.24) 44.78 (1.19) 34 2.41 (0.11) 2.49 (0.29) 35.45 (0.30) 44.39 (0.69)
aNumbers in parentheses are standard deviations in the same units as the
tions take place. As shown elsewhere (23), in a multicompo-nent fat, even the α-form may persist almost indefinitely. Be-cause the solid fat content of the suspensions differs between slow and strongly cooled samples, cocrystallization of simi-lar triacylglycerols may take place.
Chemical composition. The suspensions are separated by
pressure filtration into liquid and crystalline fractions for fur-ther analytical characterization. The triacylglycerol and fatty acid composition of the separated fractions is determined by gas chromatography. The differences of the amount of each triacylglycerol between the original milk fat and the fractions have been compared. The detailed data of the triacylglycerol contents in the fractions are given in Tables 2, 6, and 7, and the fatty acid compositions are given in Tables 1, 8, and 9.
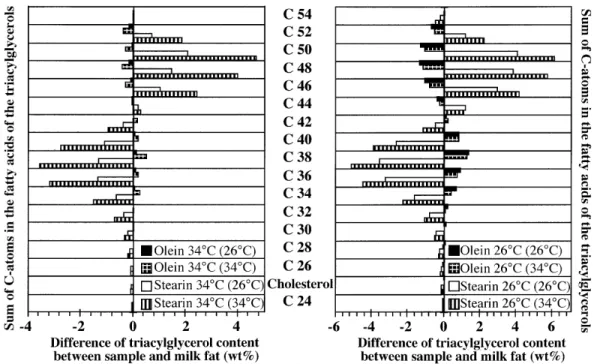
In Figure 5, a comparison is given between the separated fractions of a final crystallization temperature of 34°C, crys-tallized directly at 34°C, and stepwise melted from 26°C, re-spectively. One can see at once an enrichment of long-chain
triacylglycerols (C54 to C44) in the crystalline fractions (stearin), and a decreased amount of the triacylglycerols C42 to C24. The opposite is observed in the liquid fractions (olein).
When crystallization is performed at 34°C without any su-percooling, the differences in the triacylglycerol composition, compared to milk fat, is 4.8% maximum. If nucleation takes place at high supercooling (26°C), the differences in concen-tration between the crystalline fraction and the original milk fat are just around half the amount of the slowly crystallized sample. The error in the fatty acid and triacylglycerol mea-surements is below 1% of the measured value. The differ-ences in the solid fat content are within the standard devia-tion (Tables 4 and 5). No large differences are found in the liquid fraction (Fig. 5) due to the separation of just 2.4% of crystals from the milk fat melt (Table 4). The same tendency occurs as in the solid fraction. Approximately 0.5% of changes in the triacylglycerol composition can be reached if the crystallization is controlled. The differences in the fatty acid composition of the fractions show similar tendencies (Tables 8 and 9). It is further shown that stearic and palmitic
FIG. 4. Melting curves of temperature-equilibrated milk fat suspensions
fast cooled until equilibrium at 26°C and then melted by increasing temperature stepwise up to 34°C.
TABLE 5
Solid Fat Content, Heat of Fusion, Onset and Offset Temperatures, and Standard Deviations of Temperature Equilibrated Crystal Suspensions Fast Cooled Until Equilibrium at 26°C and Then Stepwise Melted by Increasing Temperatures Up to 34°C
Crystallization Solid fat Heat Onset Offset temperature content of fusion temperature temperature
(°C) (%) (J/g) (°C) (°C) 26 9.50 (0.14)a 12.50 (0.31) 27.49 (0.44) 44.18 (0.78) 28 8.26 (0.16) 10.93 (0.55) 29.10 (0.24) 43.50 (1.08) 30 5.63 (0.20) 8.12 (0.52) 30.93 (0.27) 43.77 (1.12) 32 4.47 (0.14) 5.74 (0.13) 32.62 (0.06) 42.45 (1.32) 34 2.62 (0.16) 3.01 (0.28) 34.73 (0.24) 42.52 (1.41)
aNumbers in parentheses are standard deviations in the same units as the
data.
TABLE 6
Triacylglycerol Composition of Separated Suspensions Crystallized in a Rheometer at 34°C and Stepwise Cooled to Fractionation Temperaturea
Olein 34°C Stearin 34°C Olein 32°C Stearin 32°C Olein 30°C Stearin 30°C Olein 28°C Stearin 28°C Olein 26°C Stearin 26°C
(34°C) (34°C) (34°C) (34°C) (34°C) (34°C) (34°C) (34°C) (34°C) (34°C) C24 0.06 0.04 0.05 0.04 0.06 0.03 0.07 0.03 0.05 0.03 Cholesterol 0.32 0.23 0.32 0.23 0.33 0.17 0.34 0.20 0.33 0.18 C26 0.27 0.20 0.27 0.16 0.27 0.13 0.30 0.15 0.24 0.12 C28 0.62 0.43 0.60 0.50 0.61 0.31 0.67 0.35 0.59 0.37 C30 1.15 0.81 1.16 0.78 1.17 0.58 1.22 0.68 1.14 0.62 C32 2.34 1.60 2.37 1.54 2.39 1.24 2.50 1.46 2.40 1.28 C34 5.65 3.89 5.75 3.65 5.71 3.03 5.83 3.55 5.81 3.16 C36 10.53 7.17 10.74 6.72 10.99 5.66 11.18 6.73 11.08 5.86 C38 12.77 8.71 12.90 8.04 13.06 6.81 13.27 8.19 13.57 7.13 C40 9.96 7.02 10.23 6.68 10.35 5.77 10.51 6.71 10.61 5.93 C42 6.67 5.56 6.67 5.40 6.71 5.01 6.76 5.53 6.77 5.39 C44 5.81 6.12 5.79 6.29 5.76 6.62 5.68 6.59 5.63 6.95 C46 6.67 9.40 6.44 9.78 6.46 10.88 6.25 10.14 6.18 11.13 C48 8.73 13.13 8.65 13.48 8.20 15.02 8.01 13.73 8.01 14.87 C50 11.60 16.61 11.15 17.22 11.15 18.76 10.80 16.99 10.87 18.01 C52 11.05 13.30 11.08 13.89 11.03 14.52 10.91 13.45 10.92 13.67 C54 5.80 5.80 5.80 5.59 5.76 5.46 5.71 5.53 5.82 5.30
acids are enriched in the solid fraction, while the contents of the lower-chain fatty acids, as well as the unsaturated fatty acids, are decreased. Tables 4 and 5 show that the difference in the solid fat content of these fractions varies within a stan-dard deviation.
At a final fractionation temperature of 26°C, greater dif-ferences in the triacylglycerol composition (Fig. 6) and fatty acid composition (Tables 8 and 9) occur because more tria-cylglycerols are separated. The same differences and trends occur as in the 34°C fractions. If the temperature equilibrium is reached before separation, the liquid fractions of the slowly cooled suspensions show a melting point at crystallization temperature [measured by conventional DSC and NMR meth-ods (15,16)]. All triacylglycerols with a melting point above the crystallization temperature are separated, and the melting characteristics of the liquid fraction are predictable. If super-cooled nucleation and stepwise cooling are performed, the
differences in the melting points between the liquid fraction and the original milk fat are less significant and are shifted to higher temperatures. This indicates further that, due to cocrystallization, higher-melting triacylglycerols exist in the liquid fractions.
Focusing on other final temperatures, the crystal contents of the suspensions that are crystallized by stepwise cooling and supercooling with a followed stepwise melting, respec-tively, differ by 2.3% maximum. These differences are due to compound crystallization that takes place at strong supercool-ing. The formation of compound crystals also causes differ-ences in the chemical composition of the fractions. If supercooling takes place, the fractionation is less specific. Polymorphism would cause no differences in the solid fat content of a temperature-equilibrated suspension but in the heat of fusion of the crystals. Because no polymorphic trans-formation takes place on a long time scale, polymorphism
TABLE 7
Triacylglycerol Composition of Separated Suspensions Crystallized in a Rheometer at 26°C and Stepwise Melted to Fractionation Temperaturea
Stearin 34°C Olein 34°C Stearin 32°C Olein 32°C Stearin 30°C Olein 30°C Stearin 28°C Olein 28°C Stearin 26°C Olein 26°C
(26°C) (26°C) (26°C) (26°C) (26°C) (26°C) (26°C) (26°C) (26°C) (26°C) C24 0.04 0.06 0.04 0.05 0.04 0.05 0.04 0.05 0.03 0.08 Cholesterol 0.27 0.32 0.26 0.30 0.22 0.33 0.23 0.33 0.21 0.37 C26 0.20 0.28 0.22 0.22 0.17 0.24 0.19 0.25 0.16 0.34 C28 0.48 0.63 0.50 0.52 0.40 0.57 0.44 0.60 0.38 0.71 C30 0.92 1.16 0.93 1.02 0.77 1.13 0.81 1.16 0.73 1.29 C32 1.96 2.32 1.93 2.21 1.58 2.37 1.69 2.42 1.53 2.55 C34 4.76 5.46 4.61 5.36 3.91 5.87 3.99 5.96 3.79 6.08 C36 9.00 10.44 8.57 10.42 7.30 11.07 7.50 11.24 7.12 11.28 C38 10.93 12.39 10.27 12.40 8.87 13.45 9.19 13.63 8.68 13.66 C40 8.71 9.85 8.31 9.87 7.24 10.45 7.55 10.57 7.16 10.64 C42 6.14 6.52 5.95 6.53 5.95 6.77 6.09 6.76 6.06 6.69 C44 6.04 5.81 6.21 5.83 6.76 5.60 6.75 5.51 7.05 5.50 C46 8.00 6.88 8.30 6.95 9.73 6.13 9.39 5.98 9.93 5.91 C48 10.62 8.98 11.29 9.10 12.93 8.03 12.48 7.91 12.98 7.78 C50 13.99 11.86 14.56 12.04 15.75 10.94 15.20 10.81 15.99 10.62 C52 12.15 11.27 12.34 11.43 12.98 11.17 12.92 10.96 12.65 10.76 C54 5.78 5.76 5.72 5.77 5.41 5.84 5.58 5.85 5.56 5.75
aConcentrations given in wt% of total triacylglycerol content.
TABLE 8
Fatty Acid Composition of Separated Suspensions Crystallized in a Rheometer at 34°C and Stepwise Cooled to Fractionation Temperaturea
Olein 34˚C Stearin 34˚C Olein 32˚C Stearin 32˚C Olein 30˚C Stearin 30˚C Olein 28˚C Stearin 28˚C Olein 26˚C Stearin 26˚C
(34˚C) (34˚C) (34˚C) (34˚C) (34˚C) (34˚C) (34˚C) (34˚C) (34˚C) (34˚C) Butyric acid 4.40 3.00 4.50 2.70 4.70 2.20 4.60 2.70 4.60 2.40 Caproic acid 2.50 1.70 2.60 1.60 2.60 1.30 2.70 1.60 2.70 1.40 Caprylic acid 1.40 1.00 1.40 0.90 1.40 0.80 1.50 0.90 1.40 0.80 Capric acid 2.80 2.10 2.80 2.10 2.80 1.90 2.80 2.10 2.80 2.00 Lauric acid 3.30 2.90 3.30 2.90 3.30 2.80 3.30 3.00 3.30 3.00 Myristic acid 10.50 10.90 10.50 11.10 10.50 11.50 10.40 11.40 10.30 11.80 Palmitic acid 27.30 33.20 27.00 34.00 26.70 35.80 26.50 33.70 26.20 35.20 Margaric acid 0.70 0.90 0.70 0.90 0.70 1.00 0.70 0.90 0.70 0.90 Stearic acid 10.20 15.40 9.90 15.90 9.80 17.20 9.60 15.20 9.50 16.20 Oleic acid 25.70 19.90 26.00 19.20 26.20 17.40 26.50 19.60 27.10 17.50 Linoleic acid 2.00 1.60 1.90 1.60 2.00 1.50 2.10 1.60 2.10 1.30 Linolenic acid 1.00 0.70 1.00 0.70 1.00 0.50 1.00 0.70 1.00 0.60 Arachidic acid 0.80 0.80 0.80 0.80 0.80 0.70 0.80 0.80 0.80 0.5
in milk fat crystals cannot be shown but cannot be excluded either.
In conclusion, at controlled temperature conditions with-out any supercooling below the fractionation temperature, the chemical and physical characteristics of the fractions are sig-nificantly different from the original milk fat. If supercooling is performed during crystallization, the crystal amount is in-creased in the suspensions at a specific fractionation ture. Even supercooling of 2°C at a crystallization tempera-ture of 28°C shows a solid fat content increase by 27% (7.16 to 9.50% solid fat content), compared to a directly crystal-lized sample. The differences in the triacylglycerol composi-tion and fatty acid composicomposi-tion of these fraccomposi-tions show that
compound crystals are formed when supercooling takes place. The differences in the directly detected melting curves of the suspensions, composed of compound crystals, are sig-nificant and show narrowed melting ranges. Even though polymorphic transformations cannot be detected over a long period of time, their existence cannot be excluded. In the frac-tions separated at 34°C, the solid fat content of the super-cooled and not supersuper-cooled suspensions is the same, but the melting maximum differs by about 1°C.
We have shown that even a low or short supercooling of milk fat during crystallization causes formation of compound crystals that show a significantly different chemical composi-tion. For a precise and predictable quality of milk fat
frac-TABLE 9
Fatty Acid Composition of Separated Suspensions Crystallized in a Rheometer at 26°C and Stepwise Melted to Fractionation Temperaturea
Stearin 34°C Olein 34°C Stearin 32°C Olein 32°C Stearin 30°C Olein 30°C Stearin 28°C Olein 28°C Stearin 26°C Olein 26°C
(26°C) (26°C) (26°C) (26°C) (26°C) (26°C) (26°C) (26°C) (26°C) (26°C) Butyric acid 3.60 4.40 3.60 4.20 3.10 4.70 3.20 4.50 2.80 4.90 Caproic acid 2.10 2.50 2.10 2.50 1.70 2.70 1.80 2.70 1.60 2.70 Caprylic acid 1.20 1.40 1.20 1.40 1.00 1.40 1.00 1.50 0.90 1.50 Capric acid 2.50 2.70 2.50 2.70 2.30 2.80 2.30 2.90 2.20 2.90 Lauric acid 3.10 3.30 3.20 3.30 3.10 3.30 3.20 3.30 3.20 3.30 Myristic acid 10.70 10.60 10.80 10.50 11.50 10.20 11.50 10.20 11.60 10.20 Palmitic acid 29.80 27.70 29.70 27.50 32.60 26.20 32.10 26.10 32.40 26.20 Margaric acid 0.80 0.70 0.80 0.70 0.90 0.70 0.80 0.70 0.90 0.70 Stearic acid 12.30 10.50 12.30 10.50 14.30 9.50 13.80 9.40 14.00 9.40 Oleic acid 23.40 25.80 23.80 25.60 20.10 27.00 20.60 27.30 20.50 26.80 Linoleic acid 1.80 1.40 1.90 2.00 1.50 2.10 1.60 2.10 1.70 2.00 Linolenic acid 0.80 1.00 0.90 1.00 0.70 1.00 0.70 1.00 0.70 1.10 Arachidic acid 0.70 0.80 0.90 0.80 0.60 0.80 0.60 0.90 0.80 0.90
aConcentrations given in wt% of total fatty acid methyl ester content.
FIG. 5. Differences of the triacylglycerol content between milk fat and
the solid or liquid fraction, fractionated at 34°C, crystallized directly at 34°C, or by stepwise melting from initial crystallization at 26°C.
FIG. 6. Differences of the triacylglycerol content between milk fat and
the solid or liquid fraction, fractionated at 26°C, crystallized directly at 26°C, or by stepwise cooling from 34°C.
tions, the temperature has to be controlled and no supercool-ing should be performed, not even for a short time in the nu-cleation phase.
ACKNOWLEDGMENTS
The authors are grateful to M. Collomb and M. Spahni (Federal Dairy Research Institute, Liebefeld, Switzerland) for performing the fatty acid and triacylglycerol measurements. We further thank Spec-trospin (Bruker Analytical and Medical Instruments, Fällanden, Switzerland) for putting the NMR at our disposal. The financial and technical support of Tetra Pak (Schweiz) AG, Kloten, Switzerland, is especially acknowledged.
REFERENCES
1. Jensen, R.G., A.M. Ferries, and C.J. Lammi-Keefe, Symposium: Milk-Fat Composition, Function, and Potential for Change, J. Dairy Sci. 74:3228–3243 (1991).
2. Jensen, R.G., Fatty Acids in Milk and Dairy Products, in Fatty Acids in Foods and Their Health Implications, edited by C.K. Chow, Marcel Dekker Inc., New York, 1992, pp. 95–135. 3. Padley, F.B., Occurrence and Characteristics of Oils and Fats,
in The Lipid Handbook, edited by F.D. Gunstone, J.L. Harwood, and F.B. Padley, Chapman & Hall, London, 1994, pp. 147–167. 4. De Man, J.M., and N. Poulsen, Regional Variations in
Compo-sition and Properties of Milk Fat, Milchwissenschaft 23:463–467 (1968).
5. Versteeg, C., L.N. Thomas, Y.L. Yep, M. Papalois, and P.S. Dimick, New Fractionated Milkfat Products, Aust. J. Dairy Tech. 49:57–62 (1994).
6. Kreulen, H.P., Fractionation and Winterization of Edible Fats and Oils, J. Am. Oil Chem. Soc. 53:393–396 (1976).
7. Deffense, E., Milk Fat Fractionation Today: A Review, Ibid. 70:1193–1201 (1993).
8. Hamm, W., Trends in Edible Oil Fractionation, Trends Food Sci. Tech. 6:121–126 (1995).
9. Badings, H.T., J.E. Schaap, C. De Jong, and H.G. Hagedoorn, An Analytical Study of Fractions Obtained by Stepwise Cool-ing of Melted Milk Fat. 1. Methodology, Milchwissenschaft 38:95–97 (1983).
10. Garside, J., General Principles of Crystallization, in Food Struc-ture and Behaviour, edited by J.M.V. Blanshard and P. Lillford, Academic Press, Inc., London, 1987, pp. 35–49.
11. Mortensen, B.K., Physical Properties and Modification of Milk Fat, in Developments in Dairy Chemistry, edited by P.F. Fox, Applied Science Publishers, London, 1983, pp. 159–194. 12. Krautwurst, J., Die Mischkristallisation der Triglyceride, Kieler
Milchwirtschaftliche Forschungsberichte 22:255–284 (1970). 13. Walstra, P., Fat Crystallization, in Food Structure and
Behav-iour, edited by J M.V. Blanshard and P. Lillford, Academic Press, Inc., London, 1987, pp. 67–85.
14. Grall, D.S., and R.W. Hartel, Kinetics of Butterfat Crystalliza-tion, J. Am. Oil Chem. Soc. 69:741–747 (1992).
15. Solid Content Determination in Fats by NMR (Low resolution nuclear magnetic resonance), International Union of Pure and Applied Chemistry, 1991, pp. 59–61.
16. Breitschuh, B., and E.J. Windhab, Direct Measurement of the Thermal Fat Crystal Properties for Milk Fat Fractionation, J. Am. Oil Chem. Soc. 73:1603–1610 (1996).
17. Collomb, M., and M. Spahni, Triglyceride: Gas-Chromato-graphische Bestimmung in Milchfett, Federal Dairy Research In-stitute, Liebefeld, Switzerland, 1996, pp. 1–11.
18. Grob, K., H.P. Neukom, and R. Battaglia, Triglyceride Analysis with Glass Capillary Gas Chromatography, J. Am. Oil Chem. Soc. 57:282–286 (1980).
19. Frede, E., and H. Thiele, Analysis of Milkfat by HPLC, Ibid. 64:521–528 (1987).
20. Woodrow, I.L., and J.M. de Man, Polymorphism in Milk Fat Shown by X-Ray Diffraction and Infrared Spectroscopy, J. Dairy Sci. 51:996–1000 (1968).
21. Sherbon, J.W., Crystallization and Fractionation of Milk Fat, AOCS 46th Annual Fall Meeting, Ottawa, Ontario, Canada, 1974, pp. 22–25.
22. Zhao, J., and D.S. Reid, Thermal Studies on the Crystallization Kinetics of Triglycerides and Milkfat by DSC, Thermochimica Acta 246:405–416 (1994).
23. van Berensteyn, E.C.H., Polymorphism in Milk Fat in Relation to the Solid/Liquid Ratio, Neth. Milk Dairy J. 26:117–130 (1972).