HAL Id: hal-03194438
https://hal.archives-ouvertes.fr/hal-03194438
Submitted on 9 Apr 2021HAL is a multi-disciplinary open access archive for the deposit and dissemination of sci-entific research documents, whether they are pub-lished or not. The documents may come from teaching and research institutions in France or abroad, or from public or private research centers.
L’archive ouverte pluridisciplinaire HAL, est destinée au dépôt et à la diffusion de documents scientifiques de niveau recherche, publiés ou non, émanant des établissements d’enseignement et de recherche français ou étrangers, des laboratoires publics ou privés.
Christine Vauthier, Bjorn Persson, Peter Lindner, Bernard Cabane
To cite this version:
Christine Vauthier, Bjorn Persson, Peter Lindner, Bernard Cabane. Protein adsorption and complement activation for diblock copolymer nanoparticles. Biomaterials, Elsevier, 2011, 32 (6), pp.1646 -1656. �10.1016/j.biomaterials.2010.10.026�. �hal-03194438�
Protein adsorption and complement activation for di‐
block copolymer nanoparticles
Christine VAUTHIER
1,2*, Bjorn PERSSON
3, Peter LINDNER
4, Bernard CABANE
5
1Univ Paris Sud, Physico‐chimie Pharmacotechnie Biopharmacie, UMR 8612, Chatenay‐Malabry, F‐ 92296; 2 CNRS, Chatenay‐Malabry, F‐92296 ; 3Theoretical Chemistry, Chemical Center, Lund University, SE 221 00 Lund, Sweden; 4ILL, BP 156, 38042 Grenoble Cedex, France; 5PMMH, CNRS UMR 7636, ESPCI, 10 Rue Vauquelin, 75231 Paris Cedex 05, France
Published
in
: Biomaterials 2011; 32(6):1646‐1656. Available on https://doi.org/10.1016/j.biomaterials.2010.10.026
Corresponding author
Christine Vauthier, Univ Paris Sud, Physico‐chimie Pharmacotechnie Biopharmacie, UMR CNRS 8612, F‐92296 Chatenay‐Malabry, France
E‐mail address: Christine.vauthier@u‐psud.fr, Fax Number: 33 1 46 83 53 12
Abstract
Four types of nanoparticles with core-diffuse shell structures have been synthesized through self-assembly of PICBA-Dextran block copolymers. These nanoparticles are designed to carry
pharmaceutically active molecules into the human body through injection into the blood stream. In this work, we have determined how the characteristics of the diffuse shell influence the adsorption of three types of proteins: Bovine Serum Albumin (BSA), fibrinogen, and a protein from the complement system that triggers recognition and elimination by macrophages. We have determined the structural characteristics of the diffuse shells using Nuclear Magnetic Resonance (NMR), Small Angle Neutron Scattering (SANS) and Quasi-Elastic Light Scattering (QELS). We have measured the adsorption of Bovine Serum Albumin (BSA) through Immunodiffusion methods, and found that it adsorbed in substantial amounts even when the distance between dextran chains at the core-diffuse shell interface is quite short. We have observed the aggregation of the nanoparticles induced by fibrinogen, and found that it was prevented when the density of dextran chains protruding from the core surface was sufficiently high. Finally we have measured the activation of the complement system by the
nanoparticles, and found that it was also limited by the density of dextran chains that protrude from the core and by their mesh size within the diffuse shell.
Key words:
core‐diffuse shell nanoparticles, mesh size, BSA, fibrinogen, C3, adsorption isotherm, dextran, poly(alkylcyanoacrylate)1. Introduction
Colloidal particles are often used to carry molecules that are pharmaceutically active from the point of administration to a target site in the body. The requirements for such a particle are threefold (a) it should carry a sufficient number of active molecules; (b) it should avoid the body’s mechanisms for recognition of foreign particles; (c) it should be able to deliver the active molecules to the target. In order to perform these functions, most colloidal carriers rely on a core‐diffuse shell structure. Typically, the core is made of a hydrophobic polymer that dissolves or traps the active molecules. The diffuse shell (also called corona) is made of hydrophilic polymers that “hide” this hydrophobic core [1].
Colloidal carriers that are injected into the blood stream find themselves in a concentrated protein solution. The most abundant protein, serum albumin, is present in blood at a concentration of 4%. Consequently, the first event that takes place when a particle is injected in the blood is the adsorption of proteins, mainly serum albumin. Subsequently, other proteins may either displace the bound serum albumins or bind to the absorbed serum albumin layers [2‐4]. Recognition and elimination of these foreign particles by the body defense mechanisms including macrophages may then occur through the absorption of specific proteins, e.g. the C3 protein of the complement system [5]. Upon binding, the C3 protein will change conformation, expose a reactive site, and release a signaling molecule that triggers the chain of bio‐chemical events called the complement activation cascade [6]. This will lead to the elimination of the particles by the macrophages [7].
There are indications that some chemical characteristics of the diffuse shell have an effect on complement activation. Indeed a chain length effect has been found for diffuse shell made of PEG or polysaccharides [8,9]. Also, an effect of the grafting density of hydrophilic chains on the particle surfaces has been found in the case of PEG chains [8]. The nature of the hydrophilic chains may also be important. These effects may be caused by interactions of C3 with albumins that are already adsorbed [10]. Indeed, since the absorption of the C3 complement protein takes place after that of serum albumin, it will be influenced by the amount of bound serum albumins, their configurations at the surface, and their accessibility. Thus, in order to design the diffuse shell for avoiding complement activation, we need to know more about the adsorption of albumin.
Recently we have synthesized a collection of nanometric‐sized drug carriers through self‐assembly of block copolymers. As a hydrophobic block we chose poly(isobutylcyanoacrylate) (PIBCA), which is a bioerodible and bioeliminable polymer that has already been used to deliver in vivo a number of drug molecules [11,12]. As a hydrophilic block, we chose dextran, which is a polysaccharide known to restrict protein adsorption [13‐14]. The selfassembly of these copolymers does yield particles with a core‐diffuse shell structure that is determined by the respective lengths of the hydrophobic and hydrophilic blocks [9,16]. By changing the conditions of polymerization, we have produced two types of particles that differ only by the core size and by the density and extension of the diffuse shell. Remarkably, these two types have very different effects on complement activation. This opens the possibility of finding how the characteristics of the diffuse shell control protein adsorption and complement activation.
In this paper we report characterizations of these polymer particles by Small Angle Neutron Scattering (SANS), measurements of the adsorption of the abundant blood proteins, serum albumin, through rocket‐immunoelectrophoresis [17] and radial immunodiffusion [18], measurements of
fibrinogen‐induced aggregation through SANS, and measurements of the activation of the complement system, through 2‐D immunoelectrophoresis [9,19]. We attempt to answer the following questions:
(a) Does the diffuse shell limit protein adsorption, what is the location of the adsorbed proteins, and what is their configuration?
(b) What is the relation between the number of hydrophilic chains that protrude out of the core and the number of proteins that can be adsorbed?
(c) Is there a relation between the number or the configuration of adsorbed proteins and the activation of the complement system?
2. Materials and Methods
2.1. Preparation of nanoparticles PIBCA nanoparticles were prepared by redox radical emulsion polymerization (RREP) according to the method of Bertholon et al. [9,16]. The polymerization initiated on dextran produces bloc‐copolymers which self‐assemble into nanoparticles with a core‐diffuse shell structure. Two dispersions were prepared named A and B, differing by the amount of initiator (dextran‐cerium). Nanoparticles A were obtained in 8 mL of nitric acid 0.2M containing 0.137 g of dextran (molar mass 69300 Da). The solution was placed under vigorous magnetic agitation at 40°C and purged with nitrogen for 10 min. Then, 2 mL of a solution of cerium ammonium nitrate (0.08 M in nitric acid 0.2M) and 0.5 mL of isobutylcyanoacrylate (IBCA) were added successively and the polymerization was allowed to proceed for 1 h at 40°C. For nanoparticles B, the volume of nitric acid 0.2M was 9.3 mL, the amount of dextran was 0.0502g and the volume of cerium ammonium nitrate was 0.7 mL. All other conditions were the same.
Immediately after polymerization, the nanoparticle dispersions were cooled down to room temperature using an ice bath. They were purified by dialysis (Spectra/Por® membrane 100 000 g/mol molecular weight cut off) against 1 L of water 4 times to remove unreacted reagents and to raise the pH to a neutral value. Further purification included a first centrifugation at 720×g for 10 min followed by a second centrifugation at 17000×g for 15min to remove any aggregates. After the second centrifugation, the lower part of the supernatant (340 µl) was collected as fractions Amiddle and Bmiddle respectively and the upper part of the supernatant (600 µl) as fractions Atop and Btop respectively. The volume fractions of the dispersions were around 1%.
2.2. Particle sizes and structures
2.2.1. Quasi-elastic light scattering (QELS).
The hydrodynamic radii of the nanoparticles were measured through QELS using a Zetasizer ZS90 instrument (Malvern, France). Measurements were performed at 25°C at a scattering angle of 90°. The intensity correlation function was fitted through the instrument software to yield a volume‐ weighted distribution of particle sizes. From this distribution we calculated the total volume and total surface area of the nanoparticles, and the radius that describes the corresponding hydrodynamic
volume/surface ratio. This radius is identical to the z‐averaged radius of the particles defined by equation 1.
Rz = Σ Ni Ri3/ Σ Ni Ri2 [1].
Dispersions were diluted in Milli® Q water filtered over a 0.22 µm membrane prior to the measurement.
2.2.2. Scanning electron microscopy (SEM).
Images of freeze‐dried nanoparticle dispersions were obtained using a scanning electron microscope LEO 1530 (LEICA) equipped with a Gemini column. Prior to observation, freeze dried samples were mounted on supports and coated with a 2nm Pt/Pd layer using a Cressington sputter coater 208HR apparatus (Cressington, France) operating under argon atmosphere. The sizes of more than 300 individual nanoparticles were measured to determine the mean radius and the parameters of the size distribution.
2.2.3. Small Angle Neutron Scattering (SANS).
Scattering patterns from liquid nanoparticle dispersions were obtained using the instrument D11 at the ILL. The experiments yielded scattering patterns consisting of intensities as a function of scattering vector q. Since the dispersions were isotropic, the scattering patterns were averaged over all directions of q, yielding spectra of intensity I vs. magnitude q of the scattering vector, which is related to wavelength and scattering angle by q = (4/) sin(/2). The range of q values was 6 x 10‐3 to 9 x 10‐2 nm‐1. In this range, the interference patterns probe variations of the density of scattering length (r) with a resolution of 10 nm. Scattering is then produced by the difference between the scattering density of a particle, (r), and that of the solvent, s. For the characterization of the particles, the dispersions were made in H2O, as the difference of scattering density between the particles and H2O was sufficient to produce strong scattering [20]. Spectra were fitted with a calculated curve for a log‐normal distribution of spheres. The z‐averaged value (Rz) was calculated using equation 1. Other experiments were made with dispersions made in H2O‐D2O mixtures that matched the scattering density of the PIBCA‐dextran nanoparticles, in order to enhance the contrast of the adsorbed proteins [20].
2.3. Composition of the nanoparticles
The monomer compositions of the PIBCA‐dextran copolymers were determined through (1H) NMR spectroscopy. The copolymers were dissolved at 40 °C in dimethyl‐d6‐sulfoxide (DMSO, d6) (Carlo Erba) at the concentration of 20 mg/mL. Spectra were then recorded on a 300 MHz Brucker instrument (Brucker, France). The composition was deduced from the spectra by calculating the ratio between the integral of dextran peaks (4.3 – 5 ppm) and that of the CH peak of PIBCA (1.8 ‐ 2.0 ppm) [21]. The molecular weight of the PIBCA part of the copolymer was calculated from the composition in dextran and PIBCA deduced from the NMR spectra and the known molecular weight of dextran (69 300 g/mol), assuming that the copolymer was composed of one chain of PIBCA and one chain of dextran as shown by Bertholon at al. [16].
2.4. BSA adsorption through immunomethods.
Nanoparticles at a volume fraction of 0.5% were incubated with different concentrations of BSA in 10 mM phosphate buffer for 3 hours at 37 °C. After incubation, the amount of non‐adsorbed BSA was
determined using immunochemical methods including immunoelectrophoresis [17] and radial immunodiffusion [18] as previously described [20].
In both cases, agarose gel plates (12 cm×8.5 cm) were prepared on Gelbond® films for agarose gel (GE healthcare, BioScience, Sweden). The agarose solution (13 mL) at a concentration of 1% contained 0.3 mL of the bovine serum albumin antisera (Sigma, France) diluted at 1/5 in a saline phosphate buffer (10 mM, NaCl 140 mM, KCl 25 mM, pH 7.5). For the radial immunodiffusion technique, the gel was prepared in the saline phosphate buffer (10 mM, NaCl 140 mM, KCl 25 mM, pH 7.5) whereas tricine buffer (lactate calcium 1 mM, Tris 63 mM, Tricine 27 mM, pH 8.6) was used to prepare gels for the immunoelectrophoresis method. Wells holding 5µL sample were formed using a 2mm diameter punch on the gel plates. After deposition of the samples in the wells (5µL) including standard solutions of BSA and nanoparticles incubated with the different concentrations in BSA, gels were placed in a humid chamber and let to diffuse in a quiet place for 48 h at room temperature in the case of the radial immunodiffusion technique. The conditions for the immunoelectrophoresis were 18 h, 230 V, 12mA (Electrophoresis power supply EPS 600, Amersham, Pharmacia Biotech, Orsay, France) using Tricine buffer as the running buffer for the electrophoresis performed in a Pharmacia LKB Multiphor II apparatus (Amersham, Pharmacia Biotech, Orsay, France). At the end of both types of experiments, the gels were dried using Watmann® filter papers and stained with coomassie blue to reveal of the formation of BSA‐antibody immunoprecipitate. Each gel contained a set of 5–6 standard solutions of BSA of concentrations ranging from 20 to 900µg/mL for internal calibration purpose. In the case of the radial immunodiffusion technique, the calibration curve is a linear relationship between the square of the diameter of the immunoprecipitation ring and BSA concentration in the well for BSA concentrations ranging from 100 to 900 µg/mL. In the case of the immunoelectrophoresis, the calibration curve is a linear relationship between the height of the immunoprecipitation peak and the concentration in BSA in the well in the range of BSA concentrations comprised between 20 and 200 µg/mL. In both cases, calibration curves with correlation coefficients above 0.99 were obtained with a good reproducibility.
2.5. Fibrinogen induced aggregation of the nanoparticles
Phosphate buffer 100mM, pH 7.4 containing different concentrations of fibrinogen (human fibrinogen from Sigma) was added to nanoparticle dispersions at a volume ratio of 1/10. Final concentrations of fibrinogen ranged from 0 to 2mg/mL. The behaviour of the dispersion during the addition of the fibrinogen was observed for eventual precipitation. The microscopic aspects of the dispersions containing 2mg/mL fibrinogen were observed with an optical microscope using the phase contrast mode (Olympus BH2). Dispersions that appeared homogeneous by microscopic observations were characterized by QELS and SANS.
2.6. Activation of the complement system
Activation of the complement system induced by the nanoparticles was evaluated using a 2D immunoelectrophoresis method as described in previous publications [9,19].
Briefly, the nanoparticles (400 cm² in 100 µl, as calculated from the hydrodynamic radius of the nanoparticles) were incubated with 50 µl human serum and 50 µl veronal buffer containing 0.15 mM calcium chloride and 0.5 mM magnesium chloride for 1 hour at 37 °C. After incubation, 5 μL of each sample was subjected to a first electrophoresis on a 1% agarose gel. The second‐dimension electrophoresis was carried out on Gelbond® films in 1% agarose gel plates containing a polyclonal
antibody to human C3 (Complement C3 antiserum rose in goat, Sigma, France), recognizing both C3 and C3b. The films were finally dried and stained with Coomassie blue to reveal the presence of C3 and C3b which have reacted with the antibody (Sigma).
The complement activation factor was calculated from the ratio of the area of the peak attributed to C3b over the sum of the areas of the peaks attributed to C3b and to C3. This ratio was then normalized on a scale ranging from 0 to 100 in which 100 indicated total activation and 0 the spontaneous activation measured in absence of nanoparticles.
3. Results
3.1. Characterization of the nanoparticles
In order to understand what characteristics of the nanoparticles determined protein adsorption, we determined their geometric dimensions and their compositions. From these data we calculated, for each type of nanoparticle dispersion, the average thickness of the diffuse shell and the surface density of chains in the diffuse shell at the core surface.
3.1.1. Particle radii according to SEM, SANS and QELS.
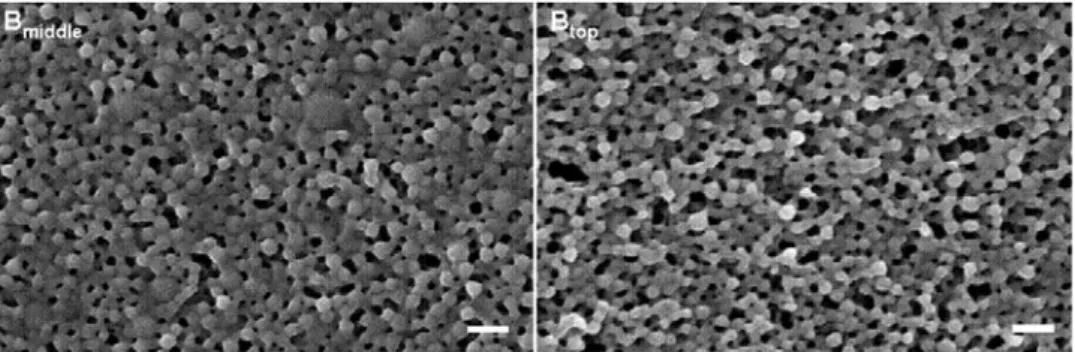
SEM images of the particles show that they are globular and polydisperse in sizes (Figure 1). In the case of the B particles, we were able to measure individual particle radii, and to obtain the distribution of these radii (Table 1). In the case of type A particles the smaller particles were not imaged in SEM.
Figure 1: Scanning electron micrographs of Type B nanoparticles. Lyophilized powder coated with a 2 nm thick Pt/Pd layer. Scale bar = 200 nm.
Table 1: Radii of the nanoparticles as determined by QELS, SEM and SANS (Rz calculated with
equation 1). Diffuse shell thicknesses were deduced from comparing QELS with either SEM (*) or SANS (**). The experimental error was estimated as ± 5 nm for QELS measurements and as ± 2 nm for SANS measurements.
QELS SEM* SANS** Diffuse shell
thickness (nm) Rz (nm) STD (nm) Rz*(nm) STD (nm) Rz** (nm) STD (nm) Amiddle 112 32 63 20 49** Atop 47 24 26 8 21** Bmiddle 88 40 37 40 20 48** Btop 49 12 32 17*
SANS spectra of the dispersions in H2O measure the core radii of the nanoparticles. SANS spectra of dispersions Amiddle Atop and Bmiddle are shown in Figure 2.
For type A dispersions, the scattered intensity follows Guinier’s law at small q values and then continues with the q‐4 decay predicted by Porod’s law for dense particles, without any of the oscillations that are expected for monodisperse spheres. These features are the usual behavior when there is a single population of nanoparticles with sizes broadly distributed around a mean value, since each spectrum is the sum of intensities scattered by all particles in the dispersion [22]. Accordingly, we fitted each spectrum with the calculated scattering curves for spheres with lognormal distributions of radii. From these distributions we calculated the specific surface area, for comparison with protein adsorption measurements, and the corresponding radius, Rz, for
Figure 2. SANS spectrum of the dispersions Amiddle,
Atop, Bmiddle in H2O (volume fraction 1% in
Phosphate buffer 10mM, pH 7.4). For Amiddle and
Atop the fits are the scattering curves calculated
for dispersions of dense homogeneous spheres with log‐normal distributions of radii (parameters in Table 1). For Bmiddle the fit is obtained with a
similar distribution plus a population of larger particles (parameters in Table 1).
comparison with the hydrodynamic radius determined through QELS (Table 1). As expected, nanoparticles isolated from the lower part of the supernatant (fractions Amiddle) were of larger size than those isolated from the top part (Atop).
The spectrum of the Bmiddle nanoparticles is different: it has a power‐law decay at low q values which is characteristic of a population of aggregated particles. Accordingly, we fitted this spectrum with the scattering curve calculated for a log‐normal distribution of spheres plus a population of larger particles (Table 1). This was consistent with QELS measurements presented next.
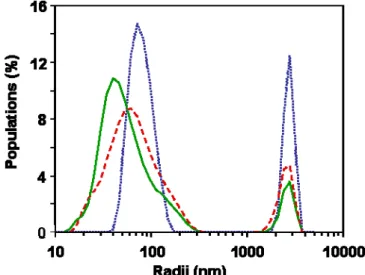
QELS measurements yield the distribution of hydrodynamic radii of nanoparticles (Figure 3). For Amiddle, Atop and Btop,, QELS shows a single population of nanoparticles with a lognormal distribution, from which we calculated the z‐averaged hydrodynamic radii (Table 1). These radii characterize the Brownian motions of particles with their diffuse shells and the solvent that is trapped by the diffuse shells. Hence the hydrodynamic thickness of the diffuse shell can be calculated as a difference between the average hydrodynamic radius and the average core radius. However, since the populations of nanoparticles are polydispersed, the results from different methods can be compared only if they make the same average of the distribution of radii. Thus, we compared the z‐averaged diffuse shell radius calculated from the distribution of particle sizes measured through QELS with the z‐averaged core radius calculated from the distribution that fits the SANS spectrum. The difference of these radii was taken as the diffuse shell thickness (Table 1). Figure 3. Distributions of hydrodynamic radii for the nanoparticles according to QELS. Horizontal axis: hydrodynamic radii Ri. Vertical axis: populations of particles P(Ri), normalized to 100 %. In each graph,
the blue (short‐doted line) curve is the volume‐weighted distribution, obtained from the instrument software. The red (long‐doted line) curve is the surface‐weighted distribution, and the green (solid line) curve is the distribution of volume/surface ratios, both calculated from the volume‐weighted distribution. The average radius calculated from the ratio of total volume/total surface is the z‐ average hydrodynamic radius Rz, which is then compared with the core radius Rz* extracted from TEM
We found that this thickness was larger than the end‐to‐end distance of dextran polymers that have the same molar mass Mw as the dextran block of the copolymers used here. Indeed, extensive light scattering measurements on dilute aqueous dextran solutions yield the law given in equation 2 for the radius of gyration Rg, in nm, as a function of the molar mass Mw in Da [23]. Rg = 0.4 (Mw)0.3 [2] The low value of the exponent is due to the fact that dextran polymers are branched. According to this law, the radius of gyration of the dextran polymers used here should be 11 nm. For a Gaussian chain, the corresponding end‐to‐end distance would be 28 nm, and for a branched polymer it would still be about the same. As shown in Table 1, the calculated value of the diffuse shell thickness of Amiddle nanoparticles (49 nm) is larger than this length, indicating that the dextran chains were stretched as a result of their confinement in the diffuse shell. In contrast, for the smaller nanoparticules (Atop and Btop), the diffuse shell thickness (respectively 21 and 17nm) is smaller than this value. In this case the small thickness results from the high curvature of the nanoparticle surfaces [24,25].
In the case of Bmiddle nanoparticles, the distribution of hydrodynamic radii was bimodal with a population of large aggregates (2‐4 µm) (Figure 3). These aggregates contributed a very small fraction of the surface area but to a larger fraction of the light scattering intensity. Consequently, the precision of surface area determinations can be considered to be comparable to that of the other measurements.
3.1.2. Composition of the particles
The compositions in dextran and PIBCA of the copolymer forming the nanoparticles were determined by NMR. NMR spectra from the A and B type dispersions were similar to those obtained in previous work [16]. The composition of each copolymer was deduced from the integration of peaks due to the characteristic protons of dextran and PIBCA (Table 2). The fraction of PIBCA found in type A copolymers was much lower than that found in type B copolymers. This result agrees with the fact that type A copolymers were prepared with a higher concentration of dextran in the original solution. In addition, there was also a smaller difference between the middle and top fractions of each dispersion.
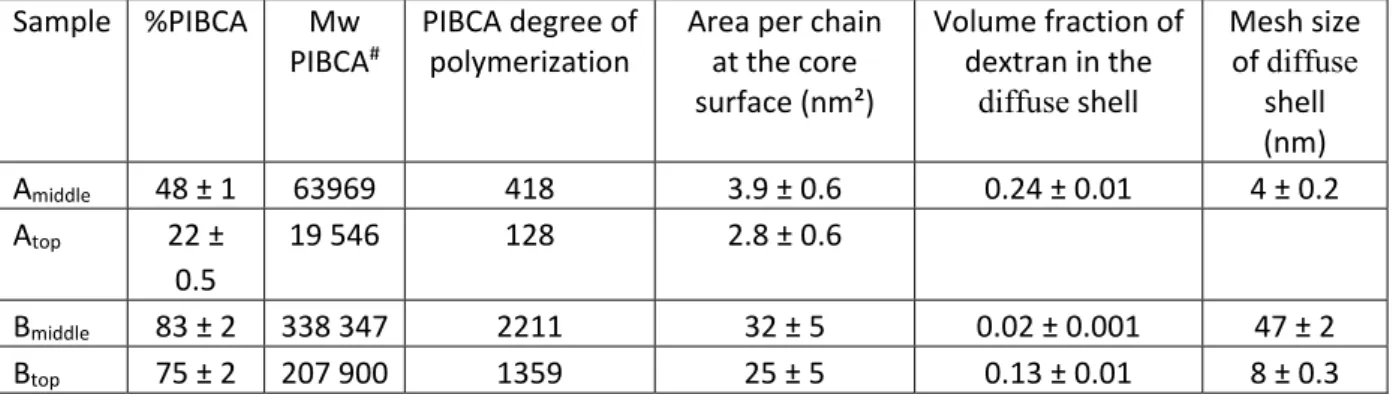
Table 2 : Summary of the characteristics of the copolymers composing the nanoparticles and calculation of the characteristics of the diffuse shell of dextran: area per dextran chain at the surface of the core of the nanoparticles, volume fraction of dextran in the diffuse shell and mesh size formed by dextran chains in the diffuse shell . Sample %PIBCA Mw PIBCA# PIBCA degree of polymerization Area per chain at the core surface (nm²) Volume fraction of dextran in the diffuse shell Mesh size of diffuse shell (nm) Amiddle 48 ± 1 63969 418 3.9 ± 0.6 0.24 ± 0.01 4 ± 0.2 Atop 22 ± 0.5 19 546 128 2.8 ± 0.6 Bmiddle 83 ± 2 338 347 2211 32 ± 5 0.02 ± 0.001 47 ± 2 Btop 75 ± 2 207 900 1359 25 ± 5 0.13 ± 0.01 8 ± 0.3 # calculated from the composition of the copolymer
In a previous work [16], we have shown that the copolymer was composed of one chain of dextran and one chain of PIBCA. Knowing the molecular weight of dextran (69300 g/mol), and the composition of the copolymer we calculate the degree of polymerization and the molecular weight of the PIBCA moiety. Results summarized in table 2 showed that the Mw of the PIBCA part of the type B copolymers were much larger than those in type A copolymers (Table 2). We can then calculate the number N of PIBCA chains in the core of a nanoparticle according to the core volume Vcore and the PIBCA chain volume vP‐chain or the mass per chain and the specific mass of PIBCA d = 1300 kg/m3: N Vcore vP chain 4 3 R3 vP chain [3] This can be combined with the core surface area to yield the area per chain at the core surface, or its inverse, the surface density of dextran chains that are tied to the core: aP chain Score N 3vP chain R [4] In this equation, the radius R is that corresponding to the specific surface area, i.e. the ratio of the total volume of all the cores to the total surface area of all the cores. This radius is given as “Rz” in Table 2. The resulting values of the surface area per dextran chain are given in Table 2. These values show that the B type particles have a very large surface area per chain, due to the very high molar mass of their PIBCA chains.
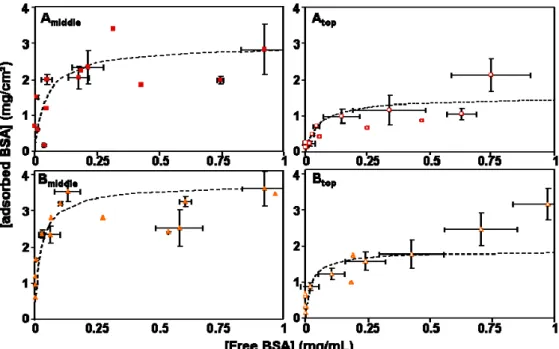
Finally, we calculate the volume fraction of dextran chains in the diffuse shell according to the volume of one dextran chain: dextran N vD chain Vcorona [5] We can also calculate the average mesh size of the diffuse shell according to the scaling law [26] b dextran 1 d df [6] where b is the length of the statistical segment of the dextran chain (b = 1 nm) [27], d is the space dimension (d = 3) and df is the fractal dimension of the dextran polymers (approximately df = 2) [23]. The values of dextran and are also listed in Table 2. In the case of the Atop particles, the calculated values of dextran and were excessively high, due to the very low degree of polymerization of the PIBCA block. Since this degree of polymerization is an average, it is likely that copolymers with the smaller PIBCA blocks remained in the aqueous phase, and that the Atop nanoparticles contained less dextran than assumed by equations /3/ and /5/. 3.2. Adsorption of BSA 3.2.1. Adsorption isotherms through radial immunodiffusion and rocket immunoelectrophoresis: The adsorption of BSA on the nanoparticles at a volume fraction of 0.5% in aqueous dispersion was determined through two methods: radial immunodiffusion and rocket immunoeletrophoresis. Both methods measure the concentration of BSA that remains in the dispersion upon equilibrium with the nanoparticles. Although the analysis is performed without previous separation of the nanoparticles
from the incubation medium containing BSA, only the free BSA will be able to penetrate in the gel during either radial diffusion or electrophoresis and will be quantified by the two methods. As shown in previous work [20,28], adsorption equilibrium was reached after 1 hour of incubation and both methods yield very similar adsorption isotherms. The amount of adsorbed BSA was calculated for each initial concentration of BSA in the solution, and then the results were converted into adsorption isotherms. The isotherms given by each type of nanoparticles have a similar shape (Figure 4) with a first section of high affinity binding (i.e., the amount adsorbed equals the initial amount) followed by a plateau that indicates saturation of the nanoparticle surfaces (i.e., the adsorbed amount saturates regardless of the total amount of BSA). It was found that the concentration of the adsorbed BSA at the beginning of the plateau varied slightly for the different nanoparticles considered in this work (Table 3). These values were of the same order of magnitude than that found in a previous work considering the same type of nanoparticles prepared by another polymerization method [20,28]. They were close to those given in the literature for different types of surfaces, excepted for those which were coated with a dense brush of polyethylene glycol [29‐32].
Figure 4: Adsorption isotherms of BSA on the different preparations of nanoparticles after incubation in 10 mM phosphate buffer (pH 7.4) for 3 hours at 37°C. The nanoparticles were used at a volume fraction of 0.5%. Doted line: simulation of the amount of BSA adsorbed on the nanoparticle surface calculated from the Langmuir adsorption equation [7].
Table 3: BSA adsorbed at the plateau of saturation deduced from the adsorption isotherms and from simulations performed with a log normal distribution of the particle size and various thickness of the adsorbed layer. The monolayer adsorption is calculated for BSA molecules in the “edge‐on” configuration (see Discussion).
Sample Adsorbed amount mg/m² Langmuir fit parameters Experimental
value Beginning of plateau End of plateau Affinity
mL/µg Monolayer0 mg/m2 Fractionunavailable α
Fraction unavailable Amiddle 2.1 ± 0.2 3.0 ± 0.2 0.02 3.66 0.2 0.18 Atop 1.0 ± 0.1 2.4 ± 0.3 0.02 3.66 0.7 0.34 Bmiddle 2.7 ± 0.4 3.4 ± 0.2 0.04 3.66 0 0.07 Btop 1.4 ± 0.3 2.8 ± 0.5 0.04 3.66 0.5 0.23
3.2.2. Structural effects of adsorbed BSA:
The amounts of adsorbed BSA were too small (in comparison with the polymer mass per nanoparticle) to be determined through SANS. Indeed, attempts were made to measure the scattering of the adsorbed BSA using the contrast match technique, as in previous work [20]. SANS experiments were performed with dispersions in blends of H2O + D2O. The isotopic compositions were close to the average scattering density of the nanoparticles. The shapes of spectra obtained at the different contrasts with and without BSA were similar. The composition of the solvent that matched the nanoparticles was 29.3 % D2O, 70.7% H2O in absence of BSA and 29.7% D2O, 70.3% H2O in presence of BSA. The slight increase of the average scattering density of the nanoparticles with BSA can be attributed to the contribution of the protein. However the precision of this determination was not nearly as good as that of the immunodiffusion methods.
On the other hand, SANS at full contrast and QELS were used to evidence structural effects such as aggregation or dissociation of particles that could be caused by the adsorption of BSA. The main effect was found with the dispersion Bmiddle, which was initially aggregated (figures 2 and 3). Upon addition of BSA, the QELS data indicated that the population of very large aggregates (radii 2‐4 µm) was strongly reduced, and the population of nanoparticles shifted to lower sizes (Figure 5). Similarly, the average radius measured through SANS at full contrast also shifted to lower values. For all other dispersions (Amiddle, Atop and Btop), there were no effects of BSA adsorption: the distributions of hydrodynamic radii remained the same, and the spectra from dispersions with BSA were nearly identical to those of the initial nanoparticles.
Figure 5. Effect of added BSA on the population of aggregates within the Bmiddle dispersion, according
to QELS. The concentrations of BSA are indicated in the Figure. Horizontal axis: hydrodynamic radii Ri.
Vertical axis: populations of particles P(Ri), normalized to 100 %. Note the reduction in magnitude of
the population of very large aggregates and the shift to lower radi of the main population. For all other dispersions, the addition of BSA had no effect on the measured radii (see the text).
3.3. Interactions of the nanoparticles with fibrinogen
Addition of fibrinogen in type B dispersions induced a strong precipitation of the nanoparticles. In contrast, type A dispersions remained homogeneous during and after addition of fibrinogen. Observations through optical microscopic confirmed that large precipitates were formed in type B dispersions while type A dispersions which remained homogenous at the macro‐ and microscopic scales (Figure 6). The analysis of the type A dispersions by QELS revealed only a slight increase in the
hydrodynamic radius of the nanoparticles. After the addition of 2 mg/mL of fibrinogen, the hydrodynamic radius of dispersion Amiddle increased from 112 to 123 nm while that of dispersion Atop increased from 60 to 66 nm. SANS also detected a slight aggregation of Atop, due to the presence of oligomers (up to 5 particles per aggregate) but not in the case of Amiddle. Figure 6: Macroscopic and microscopic images of the nanoparticle dispersions as they appeared right after the addition of fibrinogen at a concentration of 2 mg/mL to the different dispersions of nanoparticles. Scale bar: 50 µm.
3.4. Activation of the complement system.
Finally, the capacity of the different nanoparticles to activate the complement system was measured by analyzing the C3 protein of the complement in serum by 2D immunoelectrophoresis. The two fractions of nanoparticles A induced a similar and weak activation of the complement system shown on the gel by the larger peak on the left side which corresponds to the native C3 protein. The complement activation factor was around 30.1 ± 0.4 and 27 ± 3 for nanoparticles Amiddle and Atop respectively (Figure 7). The electrophoregrams of nanoparticles Bmiddle and Btop clearly showed that the two fractions of the nanoparticles B have a very different capacity to activate the complement system. Fraction Bmiddle induced an almost complete activation of the complement shown by the almost absence of the peak of C3 protein on the left side of the gel and the presence of a large peak on the right side corresponding to the activated form of the protein C3, i.e. C3B. The complement activation factor (95 ± 6) was closed to the maximum value (100) (Figure 7). The presence of two peaks of proteins on the electrophoregram of the serum incubated with nanoparticles Btop indicated that the activation of the complement system produced by these nanoparticles was much lower than that found for nanoparticles Bmiddle. The complement activation factor was much lower (41 ± 7) but remained significantly higher than those obtained with nanoparticles Amiddle and Atop..
Figure 7: Activation of the complement system evaluated from 2D immunoelectrophoresis experiments after incubation of the different nanoparticles with human serum in veronal buffer supplemented with calcium chloride and magnesium chloride. The concentration in nanoparticles was adjusted to obtain an equivalent surface area of 2000 cm²/mL in the test tube. Upper part: immunoelectrophoregram shown by the analysis of the C3 proteins after incubation of the serum with the different nanoparticles. Lower part: complement activation factor deduced from the analysis of the immunoelectrophoregrams.
4. Discussion
The aim of this discussion is to deal with the questions raised in the introduction, regarding the effects of the diffuse shell on the adsorption of small proteins (BSA), fibrinogen, and the larger proteins that trigger the activation of the complement system. The discussion is based on the characteristics of the diffuse shells (listed in Table 2), the characteristics of the proteins (listed in Table 4 below), the measured adsorption of BSA (Table 3), the occurrence of fibrinogen‐induced aggregation and the measurements of complement activation.
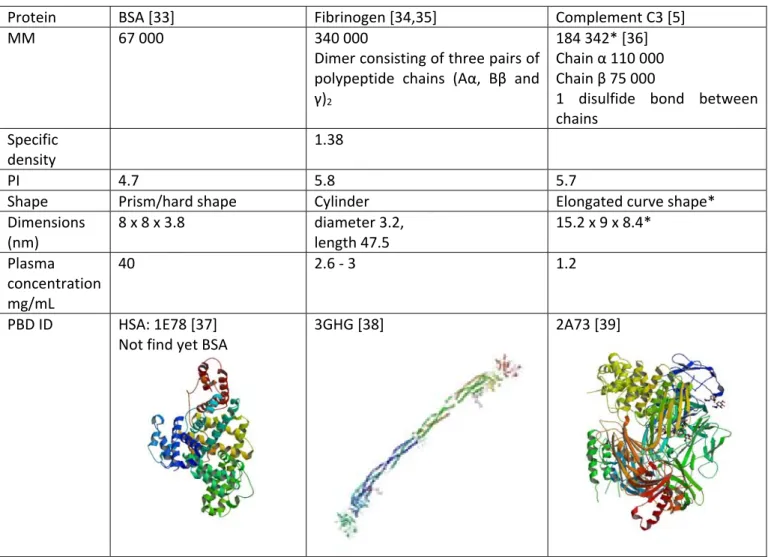
Table 4. Physical characteristics of the proteins
Protein BSA [33] Fibrinogen [34,35] Complement C3 [5]
MM 67 000 340 000
Dimer consisting of three pairs of polypeptide chains (Aα, Bβ and γ)2
184 342* [36] Chain α 110 000 Chain β 75 000
1 disulfide bond between chains
Specific density
1.38
PI 4.7 5.8 5.7
Shape Prism/hard shape Cylinder Elongated curve shape*
Dimensions (nm) 8 x 8 x 3.8 diameter 3.2, length 47.5 15.2 x 9 x 8.4* Plasma concentration mg/mL 40 2.6 ‐ 3 1.2 PBD ID HSA: 1E78 [37] Not find yet BSA 3GHG [38] 2A73 [39] *calculated from the amino acid sequence
4.1. Does the diffuse shell limit the adsorption of small proteins such as BSA?
We have measured the adsorption of BSA on nanoparticles that have very different diffuse shells: A‐ type diffuse shells have a very high surface density of dextran chains (spaced by about 2 nm); B‐type diffuse shells have a low surface density of dextran chains (spaced by about 6 nm). Yet all these particles adsorb a substantial amount of BSA, comparable to the amounts adsorbed on other surfaces [20,31,32,40‐43]. Hence these diffuse shells do not prevent the adsorption of small proteins. Still, there are differences in the adsorption isotherms of the 4 types of nanoparticles. In order to interpret these differences, it is instructive to use a thermodynamic model for the adsorption. The simplest one is the Langmuir model, which assumes equilibrium between a solution of free proteins and a collection of independent adsorption sites at the nanoparticle surfaces. The equilibrium adsorption is ruled by two parameters: the affinity of the protein for the surface sites, which has the dimensions of an inverse concentration, and the saturation value of the adsorption, (1‐), where is the adsorbed amount for a full protein monolayer, and is the fraction of the surface area that is unavailable for adsorption because of the dextran chains. The model yields the following equation for the adsorbed amount, , as a function of the concentration of free protein in the solution (equation 7).
0
1
1
[7]In order to use this equation, we must determine , and for this we must make an assumption regarding the configuration of the adsorbed proteins. BSA can be approximated as a prism‐shaped object, with dimensions 8.4 x 8.4 x 3.8 nm3 [33]. Adsorption in a “flat” configuration requires a free area of 70 nm2, which is certainly not available at the surfaces of the A‐type particles, and rather unlikely at the surfaces of the B‐type particles. Adsorption in an “edge” configuration requires a free area of 26 nm2, which may be more easily found if the adsorption site need not be circular (see below). In the following, we assume that BSA is adsorbed on all particles in the “edge” configuration. A full monolayer in this configuration would contain = 3.66 mg/m2 of adsorbed protein. With this choice, the Langmuir model parameters are as given in Table 3 above. Accordingly, the fraction (α) of the core surface that is unavailable for adsorption is only 0.2 in the case of Amiddle, and 0.7 in the case of Atop.
How do the BSA molecules manage to adsorb on surfaces that already have a high density of hydrophilic chains? The first step in protein adsorption is the diffusion of the protein through the diffuse shell to the surface. This diffusion may be prevented if the overall dimensions of the protein are much larger than the mesh size of the diffuse shell. Thus, the dimensions of BSA (Table 4) must be compared with the average mesh sizes of the diffuse shells (Table 2). For type A particles, the average mesh size is = 4 nm, and there are of course considerable fluctuations around this value. Therefore, diffusion of BSA through the mesh is difficult but certainly not impossible. For type B particles, the average mesh sizes are = 8 nm and 47 nm, and therefore diffusion of BSA through these diffuse shells is not restricted. In case of type B particles, the mesh size (47 nm) of the dextran brush is of the same order of magnitude than the thickness of the diffuse shell (48 nm). Completely free path from the end of the diffuse shell to the surface of the core may exist on the surface of this nanoparticle which can give almost free access of the core surface to proteins.
The next step is the binding of the protein to the core surface. At first sight, it appears that the surface is too crowded with dextran chains for this to occur. For Amiddle particles, the area per chain at the core surface is only 3.9 nm2 and for Atop it is 2.8 nm2 (Table 2). The required area for a BSA macromolecule adsorbed in the “edge” configuration is much larger, equal to 26 nm2. A simple statistical calculation indicates that a BSA macromolecule is very unlikely to find an area of this magnitude available for adsorption at the core surface. Consider the insertion of an object with area S1 into a system with area S having N randomly distributed “hard” points. The density of points on the surface, ρ, is given in equation 8. N S . [8] The probability of a successful insertion, Pinsert (where the object does not overlap any of the points) is given by equation 9 N N insert N S S S P 1 1 1 1 [9] For a large surface with many “hard points” (N∞) this yields:
P
insert exp
S
1
[10]The dimensionless argument of the exponential is the mean number of points per inserted disc. The free energy difference gives a measure of the process of inserting macromolecules of different area in the presence of these points. Using the experimental numbers, we find a probability of insertion equal to 1x10‐3 in the case of Amiddle particles and even lower for Atop. (Table 5).
Table 5. Comparison of the diffuse shell mesh sizes with the protein dimensions. Insertion
probabilities of the proteins at the core surfaces, based on the area per dextran chain at the core surface (see table 2). Sample diffuse shell mesh size / BSA diffuse shell mesh size / fibrinogen diffuse shell mesh size / C3 Pinsert for BSA Pinsert for Fibrinogen Pinsert for C3 Amiddle 1.1 1.3 0.5 1 x 10‐3 6 x 10‐2 4 x 10‐9 Atop 1 x 10‐4 2 x 10‐2 1 x 10‐12 Bmiddle 12.4 14.7 5.6 4 x 10‐1 7 x 10‐1 1 x 10‐1 Btop 2.0 2.4 0.9 3 x 10‐1 6 x 10‐1 5 x 10‐2
A similar mismatch has already been observed for other particles with hydrophilic diffuse shells [29,30,44]. However, this mismatch could be explained in different ways: (i) ‐ The BSA macromolecules can change conformations, which make it possible for them to fit into crowded areas. Indeed it is well known that BSA does not retain its native conformation upon adsorption [10,32,45‐47] (ii) ‐ The surfaces of albumin macromolecules have “patches” of positive electrical charges that are attracted to negative charges at the nanoparticle core surface [37]. (iii) ‐ The BSA macromolecules can take conformations that make it possible for them to bind to the diffuse shells of dextran. We conclude that the diffuse shells of dextran are not able to prevent the adsorption of small flexible proteins, even when the density of chains within the diffuse shell is quite high
4.2. Does the diffuse shell limit the adsorption of larger proteins?
Fibrinogen is a large protein that binds to “foreign” surfaces and causes them to aggregate through a bridging mechanism [48]. Hence, resistance to aggregation by fibrinogen is a good predictor of resistance to adsorption of large proteins. In this respect, the two particle types are quite dissimilar. Type B particles were strongly aggregated by fibrinogen, whereas Atop are only weakly aggregated, and Amiddle not at all. These differences are in line with the protection of the particle cores by dextran chains.
First, the diffusion of fibrinogen through the diffuse shell of dextran depends on its dimensions (a thin cylinder with diameter 3.2 nm and length 47 nm) (Table 4). The diameter is comparable or smaller than the mesh size of the diffuse shell for all particles, but the length is much larger. Hence, diffusion of fibrinogen through the diffuse shell is not restricted if it diffuses along its length. Next, the binding of a fibrinogen macromolecule requires an area of about 10 nm2, compared with an area per dextran chain of 3 to 4 nm2 for A particles and 30 nm2 per dextran in B particles (table 2). From the statistical argument given above, we find an insertion probability of 0.06 for Amiddle particles and 0.7 on Bmiddle particles (Table 5). Hence the adsorption of fibrinogen is indeed prevented by high surface density of dextran chains in the case of type A particles, but not in the case of type B
particles. This is in good agreement with the observation of fibrinogen induced aggregation in the case of B particles only.
Complement C3 protein is also a large protein (molar mass 180000) with dimensions 15.2 x 9 x 8.4 nm3. The adsorption of C3 is the first event that triggers the activation of the complement cascade [5,6]. The dimensions of C3 are larger than the mesh size of type A diffuse shells, but smaller than those of type B diffuse shells. As in the case of BSA, diffusion through the diffuse shells of type A particles may be difficult, but not impossible due to the fluctuations of dextran chain conformations. However, the binding of C3 requires an area of 80 nm2. The probability of finding an area of this magnitude at the nanoparticle surfaces is practically zero for type A particles (Table 5). On the other hand, this insertion probability at the core surface is 0.1 for Bmiddle, and 0.05 for Btop (Table 5).
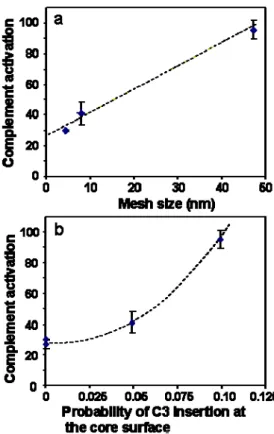
Thus, we have two factors that may explain the differences in complement activation between the nanoparticles. Both yield a satisfactory correlation. Figure 8a presents the correlation between diffuse shell mesh size and complement activation, while Figure 8b presents the correlation between the insertion probability at the core surface and complement activation. The correlation appears surprisingly good for the mesh size, and worse for the insertion probability at the core surface. A possible interpretation for this effect is that the C3 protein does not need to reach the actual core surface in order to trigger complement activation. Indeed, the dextran diffuse shell may contain albumin macromolecules that have changed conformations in order to bind to dextran chains. These bound albumins may be recognized by the C3 proteins and in this way trigger the complement cascade.
Figure 8: Relation between complement activation induced by the nanoparticles and the mesh size of the diffuse shell (a) and the insertion probability of the C3 protein at the core surface (b).
5. Conclusion
As presumed, the characteristics of the diffuse shells determine the interactions of the core-diffuse shell nanoparticles with serum proteins. The three investigated proteins are very different, and their behaviors are not at all the same. BSA diffuses through the diffuse shell and binds at the core surface even when the density of hydrophilic chains is quite high. This may be due to conformational flexibility of the protein and to attractions between opposite charges located at the protein surface and at the core surface. Fibrinogen manages to diffuse through the diffuse shell because it has the shape of a long cylinder. However, its adsorption at the core surface is restricted by the density of hydrophilic chains. The binding of fibrinogen to neighboring nanoparticles leads to the formation of aggregates of the nanoparticles. We also measured the activation of the complement cascade which is triggered by adsorption of protein C3. From these measurements, we inferred that C3 is repelled by diffuse shells that have a dense mesh of hydrophilic chains. If it manages to diffuse through this mesh, then it may bind to albumins that are already bound to the core surface or to the diffuse shell. In this case, the complement cascade is activated. In order to prevent aggregation caused by fibrinogen and recognition by the C3 protein of the complement system, it is necessary to keep these two proteins away from the core surface and from small proteins which adsorbed first during the opsonization process. This requires diffuse shells that have a very high density of hydrophilic chains.
6. Acknowledgments
The authors wish to thank Henkel Biomedical for constant support in giving the monomer used in this study, and Nicolas Tsapis at the University of Paris South, UMR CNRS 8612 for his assistance in scanning electron microscopy. This work was supported by ILL proposal 9‐12‐176.
7. References
1. Vauthier C, Bouchemal K. Methods for the preparation and manufacture of polymeric nanoparticles. Pharm Res 2009;26:1025‐1058.
2. Olivier JC, Vauthier C, Taverna M, Puisieux F, Ferrier D, Couvreur P. Stability of orosomucoid‐ coated polyisobutylcyanoacrylate nanoparticles in the presence of serum. J Control Rel 1996;40:157‐168
3. Cedervall T, Lynch I, Foy M, Berggård T, Donnelly SC, Cagney G, Linse S, Dawson KA. Detailed identification of plasma proteins adsorbed on copolymer nanoparticles. Angew Chem Int Ed Engl 2007;46:5754‐5756 4. Noh H, Vogler EA. Volumetric interpretation of protein adsorption: competition from mixtures and the Vroman effect. Biomaterials 2007;28:405‐422. 5. Sahu A, Lambris JD. Structure and biology of complement protein C3, a connecting link between innate and acquired immunity. Immunol Rev 2001;180: 35–48. 6. Law SK, Dodds AW. The internal thioester and the covalent binding properties of the complement proteins C3 and C4. Protein Sci 1997;6:263‐274.
7. Vonarbourg A, Passirani C, Saulnier P, Benoit JP. Parameters influencing the stealthiness of colloidal drug delivery systems. Biomaterials 2006;27:4356‐4373.
8. Vittaz M, Bazile D, Spenlehauer G, Verrecchia T, Veillard M, Puisieux F, Labarre D. Effect of PEO surface density on long‐circulating PLA‐PEO nanoparticles which are very low complement activators. Biomaterials 1996;17:1575‐1581
9. Bertholon I, Vauthier C, Labarre D. Complement activation by core‐shell poly(isobutylcyanoacrylate)‐polysaccharide nanoparticles: influences of surface morphology, length, and type of polysaccharide. Pharm Res 2006;23:1313‐1323.
10. Andersson J, Nilsson Ekdahla K, Lambris JD, Nilsson B. Binding of C3 fragments on top of adsorbed plasma proteins during complement activation on a model biomaterial surface. Biomaterials 2005;26:1477–1485.
11. Vauthier C, Ponchel G, Labarre D. Design aspects of poly(alkylcyanoacrylate) nanoparticles for drug delivery. J Drug Target 2007;15:641-663.
12. Nicolas J, Couvreur P. Synthesis of poly(alkylcyanoacrylate)‐based colloidal nanomedicines. Wiley Interdiscip Rev Nanomed Nanobiotechnol 2009;1:111‐127.
13. Osterberg E, Bergström K, Holmberg K, Schuman TP, Riggs JA, Burns NL, Van Alstine JM, Harris JM. Protein‐rejecting ability of surface‐bound dextran in end‐on and side‐on configurations: comparison to PEG. J Biomed Mater Res 1995;29:741‐747.
14. Monchaux E, Vermette P. Development of dextran‐derivative arrays to identify physicochemical properties involved in biofouling from serum. Langmuir 2007;23:3290‐3297.
15. Perrino C, Lee S, Choi SW, Maruyama A, Spencer ND. A biomimetic alternative to
poly(ethylene glycol) as an antifouling coating: resistance to nonspecific protein
adsorption of poly(l‐lysine)‐graft‐dextran. Langmuir 2008;24:8850‐8856.
16. Bertholon I, Lesieur S, Labarre D, Besnard M, Vauthier C. Characterization of dextran−poly(isobutylcyanoacrylate) copolymers obtained by redox radical and anionic emulsion polymerization. Macromolecules 2006;39,3559–3567.
17. Laurell CB. Quantitative estimation of proteins by electrophoresis in agarose gel containing antibodies. Anal Biochem 1966;15:45–52.
18. Mancini G, Carbonara AO, Heremans JF. Immunochemical quantitation of antigens by single radial immunodiffusion. Immunochemistry 1965;2:235–254.
19. Boackle RJ, Caughman GB, Vesely J, Medgyesi G, Fudenberg HH. Potentiation of factor H by heparin: a rate‐limiting mechanism for inhibition of the alternative complement pathway. Mol Immunol 1983;20:1157‐1164.
20. Vauthier C, Lindner P, Cabane B, Configuration of bovine serum albumin adsorbed on polymer particles with grafted dextran corona. Coll Surf B: Biointerf 2009;69:207-215.
21. Pirker S, Kruse J, Noe C, Langer K, Zimmer A, Kreuter J. Characterization of polybutyleyanoacrylate nanoparticles. part II: determination of polymer content by NMR‐analysis. Int J Pharm 1996;128:189‐195.
22. Lindner P., Zemb Th. Neutrons, X‐Rays and Light: Scattering methods applied to soft condensed matter, Amsterdam: Elsevier – North Holland Delta Series, 2002.
23. Ioan CE, Aberle T, Burchard W. Structure properties of dextran. 2. dilute solution. Macromolecules 2000;33:5730‐5739
24. Garvey MJ, Tadros TF, Vincent B. A comparison of the adsorbed layer thickness obtained by several techniques of various molecular weight fractions of poly(vinyl alcohol) on aqueous polystyrene latex particles. J Colloid Interface Sci 1976;55:440‐453.
25. Lafuma F, Wong K, Cabane B. Bridging of colloidal particles through adsorbed polymers. J Colloid Interface Sci 1991;143:9‐21.
26. Cabane B, Dubois M, Lefaucheux F, Robert MC. Mesh size of aqueous TMOS gels. J Non Cryst Solids 1990;119:121‐131.
27. Guizard C, Chanzy H, Sarko A. Molecular and crystal structure of dextrans: a combined electron and X‐ray diffraction study. 1. the anhydrous high‐temperature polymorph. Macromolecules 1984;17:100‐107.
28. Olivier JC, Vauthier C, Taverna M, Ferrier D, Couvreur P. Preparation and characterization of biodegradable poly(isobutylcyanoacrylate) nanoparticles with the surface modified by the adsorption of proteins. Coll Surf B Biointerfaces 1995;4:349‐356
29. Gaucher G, Asahina K, Wang J, Leroux JC. Effect of poly(N‐vinyl‐pyrrolidone)‐block‐poly(D,L‐ lactide) as coating agent on the opsonization, phagocytosis, and pharmacokinetics of biodegradable nanoparticles. Biomacromolecules 2009;10:408‐416.
30. Bosker WTE, Iakovlev PA, Norde W, Cohen Stuart MA. BSA adsorption on bimodal PEO brushes. J Colloid Interface Sci 2005;286:496‐503
31. Roach P, Farrar D, Perry CC. Surface tailoring for controlled protein adsorption: effect of topography at the nanometer scale and chemistry. J Am Chem Soc 2006;128:3939–3945.
32. Norde W, Giacomelli CE. BSA structural changes during homomolecular exchange between the adsorbed and the dissolved states. J Biotechnol 2000;79:259‐268. 33. Yampolskaya G, Platikanov D. Proteins at fluid interfaces: adsorption layers and thin liquid films. Adv Colloid Interface Sci 2006;128‐130:159‐183. 34. Wasilewska M, Adamczyk Z, Jachimska B. Structure of fibrinogen in electrolyte solutions derived from dynamic light scattering (DLS) and viscosity measurements. Langmuir 2009; 25:3698‐3704. 35. Rosenfeld MA, Leonova VB, Konstantinova ML, Razumovskii SD. Self‐assembly of fibrin monomers and fibrinogen aggregation during ozone oxidation. Biochemistry (Mosc) 2009;74:41‐46.
36. Fredslund F, Jenner L, Husted LB, Nyborg J, Andersen GR, Sottrup‐Jensen L. The structure of bovine complement component 3 reveals the basis for thioester function. J Mol Biol 2006;361:115‐127.
37. PBD ID 1E78. Bhattacharya AA, Curry S, Franks NP. Binding of the general anesthetics propofol and halothane to human serum albumin high resolution crystal structures. the protein data bank. J Biol Chem 2000;275:38731–38738.
38. PBD ID 3GHG Kollman JM, Pandi L, Sawaya MR, Riley M, Doolittle RF. Crystal structure of human fibrinogen. the protein data bank. Biochemistry 2009;48:3877‐3886.
39. PBD ID 2A73 Janssen BJ, Huizinga EG, Raaijmakers HC, Roos A, Daha MR, Nilsson‐Ekdahl K, Nilsson B, Gros P. Structures of complement component C3 provide insights into the function and evolution of immunity. the protein data bank. Nature 2005;437:505‐511.
40. Norde W, Lyklema J. The adsorption of human plasma albumin and bovine pancreas ribonuclease at negatively charged polystyrene surfaces: 1 adsorption isotherms: effects of charge, ionic strength, and temperature. J Colloid Interface Sci 1978;66:257‐265
41. Forcini D, Hamilton WA. Surface enrichment of proteins at quartz/water interfaces: a neutron reflectivity study. J Coll Interf Sci 2005;285:458‐468.
42. Amadeu do Serro APV, la Catarino Fernandes A, de Jesus Vieira Saramago B, Norde W. Bovine serum albumin adsorption on titania surfaces and its relation to wettability aspects. J Biomed Mater Res 1999;46:376‐381.
43. Verrecchia T, Huve P, Bazile D, Veillard M, Spenlehauer G, Couvreur P. Adsorption/desorption of human serum albumin at the surface of poly(lactic acid) nanoparticles prepared by a solvent evaporation process. J Biomed Mater Res 1993;27:1019‐1028.
44. Oksuka H, Nagasaki Y, Kataoka K. Surface characterization of functionalized polylactide through the coating with heterobifunctional poly(ethylene glycol)/polylactide block copolymers. Biomacromolecules 2000;1:39‐48. 45. Roach P, Farrar D, Perry CC. Interpretation of protein adsorption: surface‐induced conformational changes. J Am Chem Soc 2005;127:8168‐8173. 46. Shang L, Wang Y, Jiang J, Dong S. pH‐dependent protein conformational changes in albumin: gold nanoparticle bioconjugates: a spectroscopic study. Langmuir 2007;23: 2714–2721 47. Wangoo N, Suri R, Shekhawat G. Interaction of gold nanoparticles with protein: a spectroscopic study to monitor protein conformational changes. Appl Phys Lett 2008;92:133104‐1‐133104‐3. 48. Sit PS, Marchand RE. Surface‐dependent differences in fibrin assembly visualized by atomic force microscopy. Surface Sci 2001;491:421‐432.