R E S E A R C H A R T I C L E
Open Access
Transcriptome structure variability in
Saccharomyces cerevisiae strains determined with
a newly developed assembly software
Alessandro Sardu
1, Laura Treu
2and Stefano Campanaro
3*Abstract
Background: RNA-seq studies have an important role for both large-scale analysis of gene expression and for
transcriptome reconstruction. However, the lack of software specifically developed for the analysis of the transcriptome structure in lower eukaryotes, has so far limited the comparative studies among different species and strains.
Results: In order to fill this gap, an innovative software called ORA (Overlapped Reads Assembler) was developed. This software allows a simple and reliable analysis of the transcriptome structure in organisms with a low number of introns. It can also determine the size and the position of the untranslated regions (UTR) and of polycistronic transcripts. As a case study, we analyzed the transcriptional landscape of six S. cerevisiae strains in two different key steps of the fermentation process. This comparative analysis revealed differences in the UTR regions of transcripts. By extending the transcriptome analysis to yeast species belonging to the Saccharomyces genus, it was possible to examine the
conservation level of unknown non-coding RNAs and their putative functional role.
Conclusions: By comparing the results obtained using ORA with previous studies and with the transcriptome structure determined with other software, it was proven that ORA has a remarkable reliability. The results obtained from the training set made it possible to detect the presence of transcripts with variable UTRs between S. cerevisiae strains. Finally, we propose a regulatory role for some non-coding transcripts conserved within the Saccharomyces genus and localized in the antisense strand to genes involved in meiosis and cell wall biosynthesis.
Keywords: Saccharomyces cerevisiae, Saccharomyces sensu-stricto, Transcriptome assembly software, Transcriptome variability, UTR, Non-coding RNA, Cell wall, Reproductive process in single-celled organism
Background
Since the completion of its genome sequence in 1996 [1], almost all newly developed high throughput techniques have been applied to Saccharomyces cerevisiae.
Due to its high relevance as a model organism, differ-ences in gene expression under different growth conditions in the same strain have been determined, while a smaller number of analyses have compared different yeast strains [2-5] or species [6,7]. S. cerevisiae was also one of the first species in which transcriptome reconstruction using tiling arrays and RNA-seq was evaluated [8-10]. These studies allowed both a detailed determination of the transcriptome structure and the identification of entirely new classes of
non-coding RNAs (ncRNAs) such as the Stable Untrans-lated Transcripts (SUT) [10,11], whose function remains largely unknown. Although SUTs are pervasively tran-scribed, the majority of these ncRNAs have yet to be assigned a role, and their global functional significance re-mains controversial [12]. There are only a few exceptions of well-studied ncRNA such as SRG1, a ncRNA which is in-volved in the repression of SER3 transcription [13,14], and the ncRNA in antisense to the IME4 gene that regulates entry into meiosis [15]. In contrast, in other yeast species such as Schizosaccharomyces pombe, a systematic program exists in which elevated antisense RNAs arising from both ncRNAs and overlapping convergent gene pairs determine a substantial reduction in protein levels throughout the genome [16]. These findings suggest that antisense tran-scripts can have a relevant role in fungal genomes.
* Correspondence:[email protected]
3
Department of Biology, University of Padova, Via Ugo Bassi 58/b, 35131 Padova, Italy
Full list of author information is available at the end of the article
© 2014 Sardu et al.; licensee BioMed Central Ltd. This is an Open Access article distributed under the terms of the Creative Commons Attribution License (http://creativecommons.org/licenses/by/4.0), which permits unrestricted use, distribution, and reproduction in any medium, provided the original work is properly credited. The Creative Commons Public Domain Dedication waiver (http://creativecommons.org/publicdomain/zero/1.0/) applies to the data made available in this article, unless otherwise stated.
Despite the high number of genomic studies, however, pivotal aspects of the transcriptome structure, such as its structural variability among different strains, have not been considered at all. The same is also true for the presence of non-coding transcripts in other species belonging to the Saccharomyces genus. The reason for this bias in literature studies is that the gene expression analysis performed on the same strain under different growth conditions is technic-ally affordable, while the comparison of gene expression be-tween different strains is more difficult. This is due to the lack of microarray platforms for many S. cerevisiae strains and non-Saccharomyces species. Arrays designed on a refer-ence strain can actually be used for transcriptome analysis on other strains (or species), but this procedure can lead to biases in gene expression due to differences in the genomic sequences that can influence array hybridization.
Although new high-throughput sequencing techniques are a promising approach to absolve the need for“strain-” and “species-specific” microarrays, difficulties in transcrip-tome assembly and the lack of reference genomes, required for reads alignment, limits comparative studies on transcrip-tome structure. In principle, directional RNA-seq methods are more suitable than tiling arrays to deal with the com-plexity of the trascriptome, due to their single-nucleotide resolution, higher dynamic range and lower noise level [9,17]. However, it has been demonstrated that in S. cerevi-siae, tiling arrays are more precise for determining the tran-scriptome structure [10]. This is at least partly due to difficulties in managing the highly non-uniform coverage of the RNA-seq data that can produce gaps in the transcrip-tome assembly [18,19]. Moreover, comparative studies on transcriptome structure have been so far neglected, perhaps due to an underestimation of the transcript variability be-tween different yeast species and strains. However, recent studies have identified more than 13,000 RNA-binding pro-teins (RBPs) crosslinking sites in S. cerevisiae, of which a large number are localized in UTR regions. Since protein-RNA interactions are integral components of nearly every aspect of biology, a more detailed knowledge of the UTRs is needed. These results can help to better understand the role of this fundamental aspect of gene expression regulation and its variability in different S. cerevisiae strains and Sac-charomyces species.
In recent years, two main categories of transcriptome re-construction software tools have been developed: the reference-based software, that rely on reads previously aligned on a reference genome, and the “de-novo” assem-blers that analyze RNA-seq reads without the need of a ref-erence genome. Refref-erence-based software include, for example, Cufflinks [20] and Scripture [21], while Trinity [22], Oases [23], TransAByss [24], Rnnotator [25] and Multiple-k [26] are de-novo assemblers.
Many of these software were developed to manage the transcriptome of higher eukaryotes, which are characterized
by a large number of introns that determine extensive alter-native splicing. Instead, with the exception of a software specifically developed for the identification of operons [27], transcriptome analysis of prokaryotes and lower eukaryotes rely only on programs developed for complex transcrip-tomes. These software cause an excessive fragmentation in transcriptome reconstruction which complicates further analysis. In contrast to higher eukaryotes, prokaryotes and some lower eukaryotes like S. cerevisiae are characterized by a low number of introns; a distinct characteristic that would require the use of specifically developed software. The presence of polycistronic transcripts must also be con-sidered to obtain a reliable transcriptome reconstruction.
In order to fill this gap, a software named“ORA” (Over-lapped Reads Assembler) was developed in this work. Fur-thermore, this software can be used for transcriptome analysis in prokaryotes because it can also deal with polycis-tronic transcripts. This work also highlights some of the main problems of the next-generation sequencing methods that made the reconstruction of the transcripts complex. Moreover, some computational solutions to improve soft-ware reliability were identified and integrated.
As a case study, the transcriptome of six yeast strains that have different origins was chosen. In this analysis, the la-boratory strain S288c, a reference frequently used in gene expression studies, a commercial strain (EC1118) used in winemaking [28] and four vineyard strains (P283, R008, R103, P301) whose genomes have been recently sequenced [29] were considered. These strains were selected for their remarkable differences in fermentation that allowed their as-signment into three classes of fermentation efficiency:“high”
(EC1118, P283, P301), “intermediate” (R008) and “low”
(P301, S288c). The availability of the sequences obtained by RNA-seq in these six strains presented an interesting oppor-tunity to test our transcriptome assembly software. It was also possible to investigate some poorly studied characteris-tics, including transcriptome structure variability in different strains and the genomic distribution of ncRNAs with un-known functions such as the SUTs. These transcriptomes were analyzed in two different steps of the fermentation process: in mid-log phase and in early stationary phase.
These two steps were named respectively “6 g/l” and
“45 g/l” in relation to the amount of CO2produced during
alcoholic fermentation. Additionally, by comparing RNA molecules transcribed from orthologous genes, ORA allowed a global evaluation of UTR regions variability that can potentially influence the phenotype of the yeast strains. The widespread transcription of the ncRNAs localized in antisense to the protein-encoding genes was also confirmed in strains other than S288c and in three species of the Sac-charomyces sensu stricto group (SacSac-charomyces bayanus, Saccharomyces paradoxus and Saccharomyces mikatae) that have accumulated approximately 5–20 million years of sep-arate evolution [30]. This comprehensive overview of the
transcriptome structure provided an estimation of the con-servation level of these ncRNAs. Finally, our analysis allowed a functional role for a group of ncRNAs that are evolutionarily conserved among the sensu stricto group of yeasts to be proposed.
Results and discussion
The transcriptome assembly software
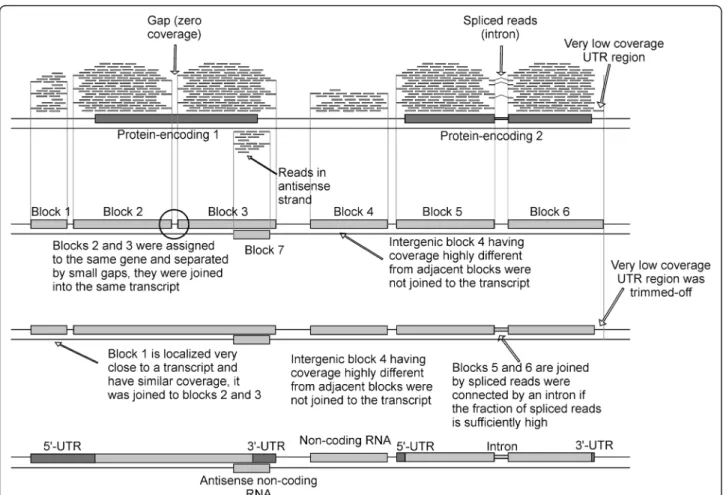
ORA is a reference-based assembler taking RNA-seq reads aligned on a reference genome as input. The transcriptome assembly process is outlined in Figure 1 and described in de-tail in the Methods section. The main concept of the soft-ware is to join the overlapped reads aligned on the same strand to obtain“blocks” that, at best, encompass an entire transcript. Here, the most common occurrence is to obtain transcripts composed by some “blocks” separated by very short gaps where the coverage is equal to zero, usually due to biases in the sequencing process and/or introns. Since it is known that only 5% of S. cerevisiae genes have introns, in most cases these gaps are due to biases in the sequencing process [27]. These sequencing biases were also pointed out in previous studies and can also be evidenced in the cover-age profile by the presence of peaks localized in the
corresponding genomic position which are separated by low-coverage regions. This suggests that some genomic re-gions are more prone to sequencing than others. On the other hand, in a low number of cases, the internal gene re-gions with no coverage can be determined by the presence of introns. However, true introns are identified by a specific part of the software that focuses on“spliced” reads identifi-cation (Figure 1). At the end of the assembly procedure, the program provides the predicted transcripts, their coverage, the position on the genome, the gene(s) comprised in the transcribed region and the UTRs sizes.
Data reported in this paper refer to different species of the Saccharomyces genus, but ORA can be used also in prokaryotes and in lower eukaryotes with a small num-ber of introns. As an example the transcriptome struc-ture of Naumovia castellii [31] was analyzed and results are reported in Additional file 1: Table S1 and Additional file 2: Figure S2.
Comparison of the transcriptome reconstruction obtained using different methods
To determine the accuracy of ORA in the transcriptome assembly, we compared the results obtained with two
Figure 1 Schematic representation of the transcriptome assembly process performed by ORA. The circle indicates the gaps located between reference-based blocks.
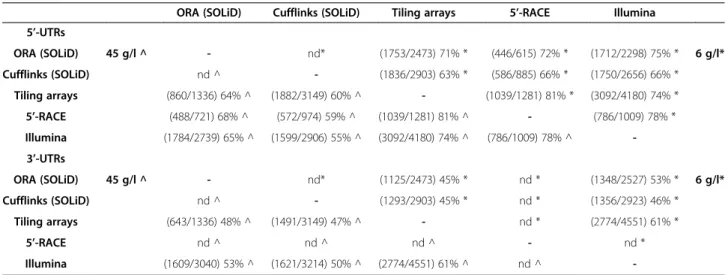
previously published analyses (Table 1). The first [9] was performed using the 5’-RACE method that provides a reli-able identification of the 5’-end of transcripts, while the second method [10] is based on tiling arrays. In the last procedure the transcripts identified were manually refined to improve the prediction. The results of these two tran-scriptome reconstructions have been previously compared [10] and it was demonstrated that 81% of the 5’-UTR pre-dictions differed in less than 50 bases (Table 1). This threshold was used for comparing the results obtained in different experiments, which were considered reliable when differing in less than 50 bases. Comparison of data obtained with 5’-RACE and ORA revealed that 72% of the predictions (446 out of 615) for the 6 g/l experiment are reliable (Figure 2a). This percentage rose to 74% (307 out of 415) when considering only the transcripts with a coverage higher than 20. Similar values were obtained for the experiment performed at 45 g/l (Table 1).
It is noteworthy that the previous data were obtained from very similar growth conditions and were manually refined to improve the prediction. On the contrary, ORA transcripts were determined in different growth condi-tions and were not manually refined. For this reason, the reliability of ORA predictions in this case is underesti-mated and it could be expected that in the same growth condition the results would be much more reliable.
The comparison of data obtained with ORA and those determined with tiling arrays revealed that 71% of the pre-dictions (1753/2473) have a difference equal to or lower than 50 bases in the experiment performed at 6 g/l, a value that rises to 73% (1102/1501) when considering only the transcripts with coverage higher than 20. Similar values
were obtained in the experiment performed at 45 g/l. Lower percentages (~48%) were obtained when considering the 3’-end of transcripts. The underestimation of the tran-scripts sizes is due to the loss of the reads overlapped to the polyadenylation site that were removed by the analysis soft-ware of the sequencer (see Methods section) (Figure 2b).
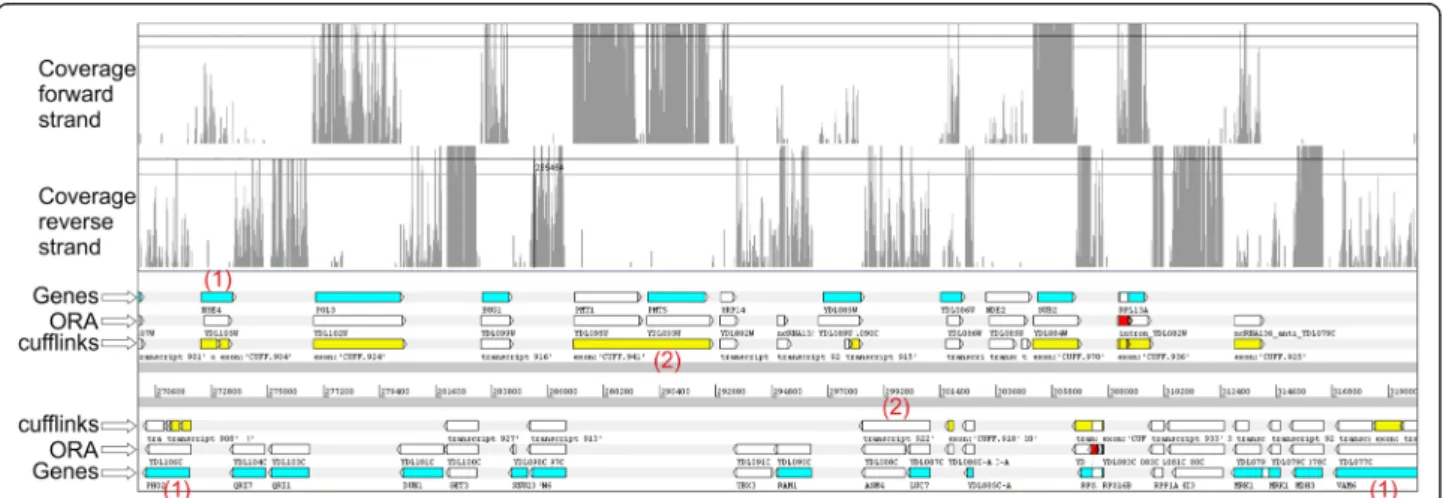
Another comparison was performed between ORA and Cufflinks [20] on the same dataset (Figure 3). The predictions obtained for S288c were compared and the two software assembled a similar number of transcripts: 3254 from ORA and 3557 from Cufflinks. Using again the results obtained with tiling arrays as a reference [10] and 50 bp difference as a threshold it was found that ORA predicted 13% more reliable transcripts than Cuf-flinks (72% vs. 59%, Table 1). Using the results obtained with 5’-RACE experiment [9] as a reference, ORA pre-dicted about 11% more reliable transcripts than Cuf-flinks (71% vs. 60%, Table 1).
The main discrepancy with RACE is due to an over-estimation of the 5’-UTR size obtained using Cufflinks (Figure 2c), probably caused by the very low coverage re-gions localized at the ends of the transcripts. The same underestimation at the 3’-end seen with ORA was highlighted by Cufflink. In fact the low percentage of re-liable transcripts (47%) is again due to the “loss of se-quences” at the 3’-end in the SOLiD sequencing. This result confirms the sequencing method as the principal cause.
Finally, a manual check of specific transcripts was per-formed to ensure maximum accuracy of the results, as small inconsistencies were observed in the reconstruction process. To simplify this process, a custom perl script was Table 1 Comparison among different methods used for transcriptome reconstruction
ORA (SOLiD) Cufflinks (SOLiD) Tiling arrays 5’-RACE Illumina 5’-UTRs ORA (SOLiD) 45 g/l ^ - nd* (1753/2473) 71% * (446/615) 72% * (1712/2298) 75% * 6 g/l* Cufflinks (SOLiD) nd ^ - (1836/2903) 63% * (586/885) 66% * (1750/2656) 66% * Tiling arrays (860/1336) 64% ^ (1882/3149) 60% ^ - (1039/1281) 81% * (3092/4180) 74% * 5’-RACE (488/721) 68% ^ (572/974) 59% ^ (1039/1281) 81% ^ - (786/1009) 78% * Illumina (1784/2739) 65% ^ (1599/2906) 55% ^ (3092/4180) 74% ^ (786/1009) 78% ^ -3’-UTRs ORA (SOLiD) 45 g/l ^ - nd* (1125/2473) 45% * nd * (1348/2527) 53% * 6 g/l* Cufflinks (SOLiD) nd ^ - (1293/2903) 45% * nd * (1356/2923) 46% * Tiling arrays (643/1336) 48% ^ (1491/3149) 47% ^ - nd * (2774/4551) 61% * 5’-RACE nd ^ nd ^ nd ^ - nd * Illumina (1609/3040) 53% ^ (1621/3214) 50% ^ (2774/4551) 61% ^ nd ^
-Percentages of 5’-UTRs and 3’-UTRs regions determined using different methods and software and having length differences of < = 50 bases. For each comparison, the number of UTR regions with a length difference of < = 50 bases and the total number of UTRs identified with both methods are shown in parenthesis.“SOLiD ORA” refers to the transcripts determined from our experiment using ORA, “Tiling arrays” refers to the data reported by Xu and colleagues [10],“5’-RACE” and “Illumina sequencing” refers to data reported by Nagalakshmi and colleagues [9] and“SOLiD Cufflinks” refers to the transcripts reported in our experiments and analyzed using Cufflinks [20]. In the top-right half of both matrices are reported 6 g/l results (marked using * symbol), in the bottom-left half of both matrices are reported 45 g/l results (marked using ^ symbol).
developed to visualize the coverage of the six strains ana-lyzed in a graph (Figure 4, Additional file 3: Figure S2). Analysis of the UTR regions in sixS. cerevisiae strains Based on the reliable ORA transcriptome structure pre-diction, the structure of the 5’-UTRs of six S. cerevisiae strains (S288c, EC1118, P283, R008, R103, P301) was in-vestigated (Additional file 4: Table S2). Strong pheno-typic differences between these strains were found in a previous study, with the most relevant being those in-volved in determining the alcoholic fermentation per-formance [29]. Moreover, the phenotypic characters of these strains have been correlated to their gene expres-sion profiles [32].
In order to maximize the reliability of the prediction, this analysis focused on the transcripts with a coverage higher than 20 (in all strains) (Additional file 5: Table S3),
which amounted to 1124 in the experiment at 6 g/l and 768 at 45 g/l. ORA identified between 13% to 20% of the transcripts with variable UTRs at 6 g/l (depending on the strains pair considered), and between 17% to 28% at 45 g/l. Transcripts with variable UTRs were considered those that differed by 50 bases or more. The highest num-ber of variable transcripts was found when comparing S288c with the other strains at 45 g/l. This is due to the greater diversity of this laboratory strain compared to the others that are much more similar at a genomic level [29]. Considering the six strains and the two growth conditions in this work, 30 pairwise comparisons were analyzed. In order to verify if specific functional classes of genes tend to have differences in the transcript structure between strains we performed a Gene Ontology (GO) analysis. We considered three group of genes: those with a 5’-UTR highly conserved between different strains (conserved Figure 2 Comparison between UTR sizes predicted using different methods. (a) Comparison between the 5’-UTR size predicted by ORA and 5’-RACE in the S288c strain. Positive values indicate transcripts with larger 5’-UTR size in the prediction obtained with ORA. (b) Comparison between the 3’-UTR size obtained with ORA and the tiling arrays (S288c strain). Positive values indicate transcripts with larger 3’-UTRs in the prediction obtained using ORA. Note the slight underestimation of the 3’-UTR size obtained using ORA. (c) Histogram reporting the difference between the length of the 5’-UTR in S288c predicted by Cufflinks and by 5’-RACE. Positive values indicate a larger 5’-UTR determined by Cufflinks. Note the slight overestimation of the 5’-UTR size obtained using Cufflinks.
Figure 3 Transcripts predicted in a region ofS. cerevisiae chr IV (strain S288c) comprised between ~270.600 bp and ~319,000 bp. From top to bottom: coverage on the forward strand, coverage on the reverse strand, genes (protein-encoding regions) (Genes), reconstruction of the transcripts obtained with ORA (ORA) and with Cufflinks (Cufflinks). In the row reporting the predictions of ORA, the introns are colored in red. Red numbers indicate key differences in transcript reconstruction between the two software: (1) transcripts formed by multiple“blocks” in the reconstruction with Cufflinks which are determined by the presence of gaps with no coverage in the coding region, (2) adjacent genes joined in polycistronic transcripts by Cufflinks despite large coverage differences.
genes), genes with variable 5’-UTRs (more than 50 bases) in at least one comparison between strains (variable genes) and genes with their 5’-UTR varying (more than 50 bases) in 6–14 comparisons (highly variable genes). No genes varied in more than 14 comparisons in a specific growth condition.
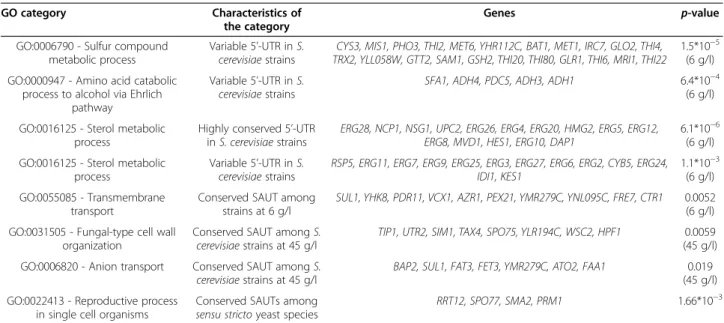
The results highlighted some GO functional classes significantly enriched in genes with highly conserved UTRs and others enriched in genes with variable 5’-UTRs. Three GO categories are noteworthy for their possible impact on the metabolic processes related to al-coholic fermentation (Table 2). The most relevant re-sults are the presence of 22 genes with variable 5’-UTRs found at 6 g/l classified in the“sulfur compound meta-bolic process” category, 5 genes found in the “amino acid catabolic process to alcohol via Ehrlich pathway” category, and 13 genes involved in sterol metabolic process (Table 2). The first finding is of particular
interest because genes involved in the“sulfur compound metabolic process” are important for the oxidative stress response and resistance to sulfur dioxide in yeast. In
fact, SO2 is a preservative compound widely used in
foods and beverages and is toxic at high concentrations [33]. Genes involved in SO2 detoxification (i.e. MET1,
MET5, MET8 and MET10) were previously shown to be induced after exposure of yeast cells to this compound [34]. The Ehrlich pathway instead is involved in the pro-duction of long chain and complex alcohols, represent-ing one of the main classes of fermentation flavors in wine [35,36]. The third very important class of genes interestingly includes both genes with highly conserved 5’-UTRs and also with variable 5’-UTRs (Table 2). Con-cordantly, a high variability in the expression level of genes involved in the biosynthesis of sterols in different yeast strains has been previously reported [32]. It is known that incorporation of sterols into membranes Figure 4 Two examples of the transcript structure obtained in the reference strain S288c and vineyard strains EC1118 and P283. (a) Transcript reconstruction of the gene YBR249C (ARO4, 3-deoxy-D-arabino-heptulosonate-7-phosphate (DAHP) synthase) at 6 g/l. (b) The transcript of the gene YLR304C (ACO1; aconitase, required for the TCA cycle) at 45 g/l. The red and blue rods indicate the end of the UTR region and transcript, respectively. The y axis reports the coverage, while the x axis shows the relative position. In both examples, the genes are encoded in the reverse strand, and consequently the 5’-UTR is on the right part of the graph.
counteracts the stress induced by the high ethanol con-centrations that accumulate during alcoholic fermenta-tion [37].
It is still difficult to identify a causal relationship be-tween variations in the transcript structure, its expres-sion and the final phenotypic effect. However, the variability of the transcript structure of genes belonging to specific functional classes suggests that this relation-ship may actually exist.
A manual inspection was carried out on the most in-teresting genes (Figure 4, Additional file 3: Figure S2).
One of these is ARO4, a gene involved in the first step of aromatic amino acid biosynthesis [38]. The 5’-UTR region is longer in the oenological strains with a size be-tween 109 and 123 bases, compared to S288c where it is only 43 bases long. In the terminal part of this transcript at 56–70 bases from the 5’-end a binding site for a RBP was identified by gPAR-CLIP [39]. From ORA’s predic-tion it could be concluded that this binding site is absent in S288c since this strain lacks the terminal part of the transcript. Despite in enological strains the 5’-UTR re-gion of ARO4 is longer, it does not overlap the predicted TATA box (Additional file 6: Figure S3).
Finally, analysis of the RBPs was extended to all the binding sites previously identified [39] (Additional file 7: Table S4) and ARO4 resulted not to be an exception. In fact, among the 4576 biding sites identified in the 5’-UTR region of 2550 genes, 546 are absent in one or more strains at 6 g/l, while 531 are absent in transcripts identified at 45 g/l. Accordingly, it is possible that differ-ences in the 5’-UTR region of the transcripts could rep-resent a major source of variability among S. cerevisiae
strains. More generally, this feature, hitherto neglected, could play a relevant role also among strains of other species, with an impact on the stability of the transcripts and on the expression level.
Non-coding transcripts (SUT-SAUT) inS. cerevisiae and in other yeast species
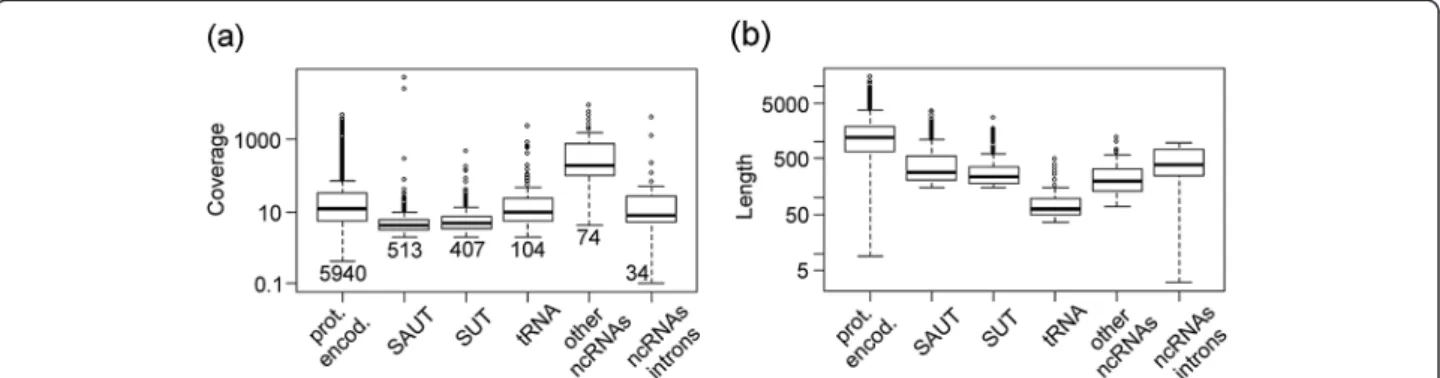
As shown in previous studies [10,11], the yeast tran-scriptome includes numerous ncRNAs localized in inter-genic regions or in antisense to protein-encoding genes [10]. A high strand-specificity of the reads obtained from sequencing is important for the identification of SAUTs. This specificity was evaluated by determining the fre-quency of the SAUT identified in antisense to genes with different coverage values (Additional file 8: Figure S4). From the results obtained, the number of SAUTs was higher in genes with low expression suggesting that they are not influenced by reads lacking strand-specificity. Their expression level determined by ORA is on average lower than expression of protein-encoding genes (Figure 5) and of structural RNAs of known function (i.e. snoRNAs). The low expression level (Figure 5) and lack of a func-tional role for most SUTs have cast doubt upon their global functional significance [12] and suggest that some
SUTs could be the result of a “transcriptional
back-ground”. In order to clarify their putative role and their ef-fect on transcription, we classified SUTs by considering their localization with respect to other genes. Those found in intergenic regions were named as SUT (Stable Untrans-lated Transcripts) and those located in antisense to protein-encoding genes as SAUT (Stable Antisense Un-translated Transcripts). SAUTs are the more interesting Table 2 Selected results obtained from GO analysis
GO category Characteristics of
the category
Genes p-value
GO:0006790 - Sulfur compound metabolic process
Variable 5’-UTR in S. cerevisiae strains
CYS3, MIS1, PHO3, THI2, MET6, YHR112C, BAT1, MET1, IRC7, GLO2, THI4, TRX2, YLL058W, GTT2, SAM1, GSH2, THI20, THI80, GLR1, THI6, MRI1, THI22
1.5*10−5 (6 g/l) GO:0000947 - Amino acid catabolic
process to alcohol via Ehrlich pathway
Variable 5’-UTR in S.
cerevisiae strains SFA1, ADH4, PDC5, ADH3, ADH1
6.4*10−4 (6 g/l)
GO:0016125 - Sterol metabolic process
Highly conserved 5’-UTR
in S. cerevisiae strains ERG28, NCP1, NSG1, UPC2, ERG26, ERG4, ERG20, HMG2, ERG5, ERG12,ERG8, MVD1, HES1, ERG10, DAP1
6.1*10−6 (6 g/l) GO:0016125 - Sterol metabolic
process
Variable 5’-UTR in S. cerevisiae strains
RSP5, ERG11, ERG7, ERG9, ERG25, ERG3, ERG27, ERG6, ERG2, CYB5, ERG24, IDI1, KES1
1.1*10−3 (6 g/l) GO:0055085 - Transmembrane
transport
Conserved SAUT among
strains at 6 g/l SUL1, YHK8, PDR11, VCX1, AZR1, PEX21, YMR279C, YNL095C, FRE7, CTR1
0.0052 (6 g/l) GO:0031505 - Fungal-type cell wall
organization
Conserved SAUT among S. cerevisiae strains at 45 g/l
TIP1, UTR2, SIM1, TAX4, SPO75, YLR194C, WSC2, HPF1 0.0059 (45 g/l) GO:0006820 - Anion transport Conserved SAUT among S.
cerevisiae strains at 45 g/l BAP2, SUL1, FAT3, FET3, YMR279C, ATO2, FAA1
0.019 (45 g/l) GO:0022413 - Reproductive process
in single cell organisms
Conserved SAUTs among sensu stricto yeast species
RRT12, SPO77, SMA2, PRM1 1.66*10−3
Relevant results obtained from analysis of the enrichment of genes involved in selected GO processes. Enrichment was calculated with respect to the entire set of S. cerevisiae genes using YeastMine and the p-value is reported on the rightmost column (http://yeastmine.yeastgenome.org/yeastmine/begin.do).
for their putative effect on the transcription and transla-tion of the gene located on the antisense strand [15,16]. An examination of the putative effect of SAUTs on gene expression in the opposite strand (data not shown) did not reveal a common mechanism. In fact, depending on the gene, increased expression of a SAUT corresponded to either decreased or increased expression of the antisense gene, and sometimes had no effect at all. This finding sug-gests that only a fraction of the SAUTs identified have a functional role and they do not have a common mechan-ism of action.
To have a better understanding of the possible role of these transcripts and their conservation level in different strains, we verified the presence of SAUTs on the anti-sense strand of the orthologous genes of the six yeast strains analyzed. If an orthologous gene had a SAUT in the antisense region in all the six strains tested, the SAUT was considered to be conserved. Despite the number of SAUTs in the genomes being quite high (be-tween 401 to 1209 depending on the strain), only 66 of them are conserved in all of the strains at 6 g/l and 117 at 45 g/l. Considering only the conserved SAUTs, we fo-cused our attention on those with a potential role in the
cell, while omitting “strain specific” ones and those
representing a sort of“transcriptional background”. GO analysis of the protein-encoding genes present in the antisense strand of conserved SAUTs was performed. Only a small number of biological processes were identi-fied and two of them seem to be particularly affected by the presence of conserved SAUTs: transmembrane trans-port and fungal-type cell wall organization (Table 2).
In order to widen the analysis at a higher taxonomic level, the existence of conserved SAUTs was evaluated in three species of the Saccharomyces sensu-stricto group recently sequenced: Saccharomyces paradoxus, Saccha-romyces bayanus and SacchaSaccha-romyces mikatae [40]. High throughput sequencing data obtained for these three species and also for a diploid S. cerevisiae strain were
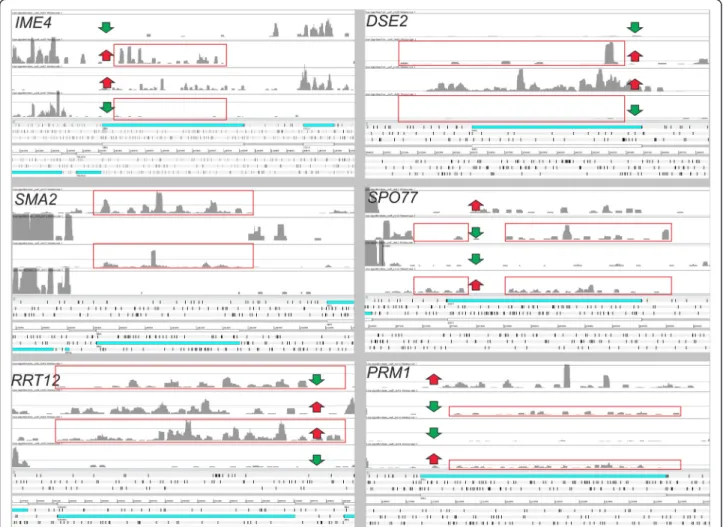
used [6]. Their transcriptome structure was predicted with ORA and SAUTs were identified. Like for the previ-ous analysis performed on the six S. cerevisiae strains, only genes with a SAUT in the antisense strand in all the four species were considered. Only two genes (OPT2 and YDL129W) had SAUTs in all the four species. How-ever, this number rises to 25 (Table 3) when considering the results previously obtained for S288c in a gene ex-pression study [36]. This discrepancy can be explained by the fact that the S288c strain analyzed by Busby and colleagues [6] is diploid, while the strain considered by Treu and colleagues [36] is haploid. It is known that the expression of the antisense transcripts (SAUTs) of some S. cerevisiae genes (i.e. IME4; YGL192W) decreases in the diploid strain to allow the expression of the protein-encoding gene on the opposite strand [15]. IME4 en-codes a N6-adenosine methyltransferase required for entry into meiosis that has high expression levels in dip-loid cells (Figure 6). In hapdip-loids, antisense transcription prevents sense transcription of the IME4 gene by means of transcription interference. In this process, a strong constitutive transcription of the IME4 antisense inter-feres with transcription of the sense RNA. Other genes with a lower expression in the haploid strain were previ-ously identified [41] and some of these are involved in the biosynthesis of the cell wall like DSE2 (YHR143W), a daughter cell-specific secreted protein with similarity to glucanases. Considering normalized values obtained for the S288c haploid and diploid strains, it was found that SAUTs in antisense to the genes DSE2 and IME4 are more highly expressed in the haploid strain. They are also inversely related to the expression level of the protein encoding transcript (Figure 6). This finding sug-gests, therefore, that not only IME4 but also DSE2 is regulated by an antisense transcript.
Of the 25 genes identified by the comparison per-formed among the sensu-stricto yeast species, it was found that SMA2 (YML066C) and SPO77 (YLR341W) Figure 5 Coverage (a) and length (b) of six classes of transcripts identified by ORA in the S288c strain at 6 g/l. From left to right are reported: transcripts encoding proteins (prot. encod.), non-coding transcripts localized in antisense to other genes (mainly protein-encoding) (SAUT), non-coding transcripts localized in intergenic regions (SUT), tRNAs, other non-coding RNAs (mainly small nuclear RNAs) and ncRNAs localized in intronic regions. The number of transcripts identified for each class in the S288c strain at 6 g/l is shown in (a).
encode meiosis-specific proteins (Figure 6). The protein encoded by SMA2 is required to produce the bending force necessary for the proper assembly of the prospore membrane during sporulation [42,43], while SPO77 is required for spore wall formation during sporulation [42,44,45]. PRM1 gene is a pheromone-regulated multi-spanning membrane protein involved in membrane fu-sion during mating [46]. Among the 25 genes there is also RRT12, a subtilisin-family protease involved in spore wall formation [47], with a role in dityrosine layer for-mation. Other previous experiments confirmed that the expression of some proteins involved in biosynthesis of the spore wall is lower in diploids than in haploid cells [48]. The regulation of spore wall biosynthesis by the presence of SAUTs is a major finding and underlines the importance of coordinating the dynamic remodeling of the yeast wall with cell morphogenetic events.
These 4 genes (PRM1, SPO77, SMA2, RRT12) belong to the GO class“reproductive process in single-celled organ-ism” that is enriched in genes with an antisense transcript.
It is clear that not all of these genes have a common mech-anism for regulating the expression level of the protein-encoding gene (as in the case of IME4 and DSE2) (Figure 6). Nevertheless, the high conservation level of SAUTs in dif-ferent yeast species suggests a functional role for these tran-scripts in the control of protein expression. In particular, entry into meiosis is a key developmental decision and anti-sense ncRNAs seem to play a relevant role in various steps of this process. These data revealed here for the first time a general role for a group of SAUTs both in S. cerevisiae and probably in other species belonging to the sensu-stricto group of yeasts.
Conclusions
In this work, a software for the analysis of transcriptional landscapes of lower eukaryotes and prokaryotes was spe-cifically developed. This software, named ORA, proved to perform very well when compared with other software and produced results comparable to those obtained via re-liable methods such as 5’-RACE. ORA proved to be a very Table 3 Protein-encoding genes with a SAUT in the antisense strand
Gene systematic name Gene standard name Gene name
YPR194C OPT2 Oligopeptide Transporter
YDL129W -
-YOR042W CUE5 Coupling of Ubiquitin conjugation to ER degradation
YOR040W GLO4 Glyoxalase
YNR002C ATO2 Ammonia (Ammonium) Transport Outward
YNL279W PRM1 Pheromone-Regulated Membrane protein
YKL151C -
-YJR129C -
-YDR242W AMD2 Amidase
YDR124W -
-YBR033W EDS1 Expression Dependent on Slt2
YML066C SMA2 Spore Membrane Assembly
YKL187C FAT3 Fatty acid transporter 3
YHR177W GON3 Regulator Of Fluffy
YGL224C SDT1 Suppressor of Disruption of TFIIS
YDR222W -
-YCR045C RRT12 Regulator of rDNA Transcription
YPL021W ECM23 ExtraCellular Mutant
YMR182C RGM1
-YML118W NGL3
-YLR341W SPO77 Sporulation
YKR102W FLO10 Flocculation
YGL251C HFM1 Helicase Family Member
YGL059W PKP2 Protein Kinase of PDH
YER176W ECM32 ExtraCellular Mutant
Protein-encoding genes with a SAUT in the antisense strand in all the species of the Saccharomyces genus analyzed (S. cerevisiae, S. bayanus, S. paradoxus, S. mikatae).
useful tool for the identification of 5’- and 3’-UTRs starting from RNA-seq reads. In this study the variability of the transcriptome structure of different S. cerevisiae strains was highlighted. Furthermore, it was discovered that this vari-ability can influence the binding sites of the RBPs in regions localized at the 5’-UTR. This finding indicates that differ-ences in UTRs can change the stability and the translation efficiency of the transcripts in different strains. Finally, we have demonstrated that ORA allows the identification of “criptic” transcripts such as SAUTs. In conclusion, this new software is able to simplify comparative analyses between strains and species and, in some cases, the results can be used to suggest a functional role for unknown transcripts. Methods
Yeast strains
Vineyard strains P283, P301, R008, R103 were obtained from previous yeast selection program [29]. The laboratory
strain S288c was purchased from CBS collection (CBS8803). The industrial wine strain Lalvin EC1118 (EC1118), also known as “Prise de mousse”, is a S. cerevisiae wine strain isolated in Champagne (France) and manufactured by Lallemand Inc. (Montreal, CA). EC1118 has been deposited in the Collection Nationale de Cultures de Microorganismes (Institut Pasteur, Paris, France) as strain I-4215.
RNA-seq analysis performed using the SOLiD 3 sequencing instrument
Cells were collected during the fermentation process performed in monitored bioreactors. Three biological replicates of the fermentations were analyzed for each strain. Samples for RNA-seq were collected at the begin-ning of the process, when the CO2produced by the cells
was 6 g/l (mid log phase), and in the middle of fermen-tation when it was 45 g/l (early sfermen-tationary phase). The total RNA was extracted from each sample using the Figure 6 Coverage profiles on forward and reverse strands for six selected genes. Genes reported in figure belong to the GO categories “reproductive process in single-celled organism” (RRT12, SMA2, SPO77), “sporulation resulting in formation of a cellular spore” (IME4) and “fungal-type cell wall” (DSE2). SAUTs conserved in all the Saccharomyces species analyzed (indicated by red boxes) were found in all the genes except IME4 and DSE2. An inverse correlation in gene expression between the protein-encoding transcript and the SAUT is highlighted by red/green arrows and was previously demonstrated for IME4 [15].
RiboPure™-Yeast kit (Ambion, Carlsbad, CA, USA). The quality and the quantity of the total RNAs were measured using Nanodrop (ThermoFisher Scientific, Waltham, MA, USA) and the Agilent 2100 bioanalyzer (Agilent, Santa Clara, CA, USA). Fourμg of each biological replicate were pooled together and freeze-dried. The RiboMinus™ Tran-scriptome Isolation Kit (Life Technologies, Carlsbad, CA, USA) was used to selectively remove rRNAs from total
RNA. Libraries were prepared using the “SOLiD Whole
Transcriptome Analysis Kit protocol” (Life Technologies) and generated approximately 30–50 Gbp reads 50 bases long. PASS software [49] was used to univocally align 9– 25 million reads for each sample to the reference genome. Reads mapped on the repeated regions were discarded. RNA-seq data comply the standards proposed by the Microarray Gene Expression Data Society and were deposited in MIAME-compliant format to GEO database with accession numbers GSE44845, GSM1092504–GSM1 092515. Data were also reported in previous papers [29,32] where the influence of the promoter regions on gene expres-sion has been investigated.
SOLiD reads obtained from S. paradoxus Y-17217, S. mikatae IFO1815, S. bayanus MCYC623 were downloaded from GEO database (accession number GSE32679).
Alignment results in SAM format were managed using SAMtools [50].
Coverage profiles and transcripts were visualized on the Saccharomyces genome using Artemis browser [51] or with a perl script embedding R commands that was used to plot the coverage.
Gene Ontology analysis was performed on the Yeast-Mine database (http://yeastmine.yeastgenome.org/) con-sidering the Biological Process ontology; GO category enrichment was calculated considering all the S. cerevi-siae genes reported in the database.
Analysis of the RBS inARO4 promoter
The number of binding sites in the S. cerevisiae genomes analyzed was determined using PATMAN software [52] and allowing from 0 to 3 variable positions in the pre-dicted sequence. Results are reported in Additional file 6: Figure S3.
Analysis of theN. castellii transcriptome
RNA-seq reads were downloaded from GEO database (GSE58884) and aligned on the reference genome using PASS software v1.6 [49]. The maximum distance allowed for “spliced reads” was 1 kb. Transcriptome reconstruc-tion was performed using ORA with default parameters except the ratio between spliced and unspliced reads in intron identification that was increased to 0.65 to reduce false positives. Selected regions of the genome were visu-alized using Artemis [51] and are reported in Additional file 2: Figure S1.
The transcriptome assembly software ORA
ORA takes as input reads aligned on a reference genome using software like PASS [49], or TopHat [53] which is based on Bowtie for reads alignment [54]. Only shotgun reads information is considered by ORA (and not paired-end reads) for two main reasons. The first reason is that generally in lower eukaryotes alternative splicing are ab-sent or very rare and therefore the transcripts assembly process does not require the information of the paired-end reads. The second reason is that paired-paired-end sequen-cing is not available for some of the sequensequen-cing methods recently introduced such as the proton and the ion-torrent [55], but these sequencers are becoming wide-spread for the low cost of both the instrument and the sequencing reagents.
A specific function developed in ORA uses the spliced reads information for introns identification.
As first step in the transcriptome reconstruction, the user is asked to select some of the parameters used for the transcriptome assembly, like the minimum size of gaps with no coverage (below which the software is forced to
join two“blocks” together) and the minimum number of
reads to be joined into a “block”. The last parameter is important to reduce the“background noise” in transcrip-tome reconstruction, determined by the presence of single or small groups of reads localized in intergenic regions or in genes having very low coverage. Default parameters suggested by ORA were optimized on species of the Saccharomyces genus with transcriptome sequenced using SOLiD or Illumina platforms [56]. Finally, in order to manual inspect the results obtained by the software, files containing the single-base coverage on each chromosome and/or scaffold of the genome are generated (Figures 3 and 4). These files can be visualized using Artemis soft-ware [51].
In the second step, the software classifies the“blocks” in two groups based on annotation. The first group in-cludes “blocks” that are totally or partially overlapping to an annotated gene (named“reference-based blocks”).
The second group includes the “blocks” that cannot be
assigned to predicted genes. At each run, the software automatically calculates the average size of the gaps
lo-cated between “reference-based blocks” matching the
same gene (referred as GRBB) and their standard devi-ation (GRBB-SD) (Figure 1). The mean and the SD of the coverage ratio of these “blocks” are also calculated (referred as CRRBB and CRRBB-SD). These parameters are fundamental for the next step of the computation
where ORA analyzes the “blocks” not assigned to any
annotated gene (located in intergenic regions) to deter-mine whether they can be joined with an adjacent “ref-erence-based” block. The program joins two “blocks” when the distance between them and their coverage is similar (within a range of 2 SD in the distribution
previously calculated, GRBB-SD and CRRBB-SD) (Figure 1). Otherwise, they are considered to be transcripts generated by genes not previously identified. At this step, as “blocks” with different coverage are merged, ORA re-calculates size and coverage of the new “reference-based blocks”. These steps are recursively repeated until no more “blocks” in intergenic regions can be further joined with pre-existing ones.
In the third and final step, the software generates the final transcriptome prediction. “Blocks” located within an annotated gene not separated by introns are merged reducing the transcript“fragmentation” (Figure 3). This is based on the assumption that the number of introns is extremely low and most of them can be detected through the spliced reads. To avoid the identification of false positive introns, the“spliced reads” coverage must be equal to or greater than 1/10 of the“unspliced reads” coverage in the intron-exon boundary. This ratio has been empirically determined considering the presence of “false positives spliced reads” randomly scattered on the genome and the presence of reads that are not cor-rectly aligned on exons boundaries.
ORA has some modules designed to execute two add-itional analyses: one focused on polycistronic transcripts and another one on 5’ and 3’ ends. During the first ana-lysis, ORA performs a further check to verify the reli-ability of polycistronic transcripts as their presence in S. cerevisiae was previously predicted [10]. The analysis is based on the method described by Campanaro and col-leagues [57] and verifies whether two adjacent genes are part of a real polycistronic transcript or if the prediction is a false positive determined by the closeness of their transcripts on the genome (Figure 1). Reliability of this approach was previously determined [58] comparing re-sults with a bioinformatics prediction method [59].
ORA identified a small number of bicistronic tran-scripts (19 in S288c), some of these YIL165C-YIL164C, YKL022C-YKL021C, YOR059C-YOR060C, YOR376W A-YOR377W, YFR033C-YFR034C, YDR481C-YDR482C were previously identified [8,10]. Sixteen of these tran-scripts were identified only at 6 or 45 g/l and were not considered real fusion genes but distinct transcripts not separated by untranscribed intergenic regions. This re-sult highlights the importance of comparing transcrip-tome reconstruction in different growth conditions. A validation of the remaining 3 bicistronic transcripts (YFR033C-YFR034C, YFL057C-YFL056C and YIL165C-YIL164C) was performed considering paired-end reads [56] and polyadenylation sites [60] (Additional file 9: Figure S5). Results suggest that only YIL165C-YIL164C is transcribed as a bicistronic transcript and this is ex-pected because these two genes in closely related spe-cies and in some S. cerevisiae strain backgrounds likely constitute a single ORF encoding a nitrilase gene [61].
The second additional analysis is performed on transcripts with coverage higher than 20 to improve the prediction of their 5’ and 3’-ends (Figure 1). In a comparison between UTRs size determined by tiling arrays experiments and those determined by RNA-seq [10] it was seen that the latter method tends to overestimate the size of high cover-age transcripts (Figure 2c). Due to its high sensitivity the RNA-seq detects very low abundance transcripts of un-clear origin. Our results highlighted the presence of an “anomalous” elongation of the UTRs with “tails” having very low coverage. For this reason, in high coverage genes a better estimation of the transcript ends can be obtained introducing a trimming step. In this process the terminal parts of the transcript where the coverage become equal or lower than three were removed (Figures 2, 3 and 4). However, it remains to be clarified whether these 5’ and 3’-ends with very low coverage can have a functional value or if they are generated through anomalous transcriptional initiations.
One of the main problems in transcriptome reconstruc-tion is the predicreconstruc-tion of very low coverage transcripts, in particular those not assigned to a reference gene (i.e. S. cerevisiae SUTs). In specific cases, the transcript predic-tion tends to be splitted into separate porpredic-tions and this led to an overestimation of the real number of ncRNAs. This issue is very hard to solve with currently available sequen-cing methods and for a reliable prediction very deep tran-scriptome sequencing is needed.
Another critical point was highlighted by our results from analysis of RNA-seq reads obtained using the SOLiD 3 platform: the SOLiD analysis software removes the reads partially or completely overlapped to the poly-A. This led to an underestimation of the 3’-UTR size (Figure 2). The lack of these reads was demonstrated through a specific check performed on the 3’-terminal sequences partially overlapped to the poly-A (data not shown). Due to the underestimation of the 3’-UTR size, in the Results and Discussion section we will focus only on the results obtained for the 5’-UTR regions.
ORA software was written in perl (5.17) and was tested in Linux (Ubuntu 12.04) operating system. The software can be downloaded from https://sourceforge.net/ projects/transcriptomeassemblyora/files/ together with the manual and the test files. It requires approximately 5 Gb RAM to assemble 10–20 million sequences on a reference genome.
Additional files
Additional file 1: Table S1. Transcriptome reconstruction of Naumovia castellii performed using ORA software. The worksheet “UTRs” reports the length of the UTR regions in protein encoding genes. In column (a) is reported the gene name, in (b) the coverage, in (c) the 5’-UTR size [bp], in (d) the 3’-UTR size and in (e) the chromosome. The worksheet
“Transcriptome” reported the output of ORA in “gff” format, in column (a) the chromosome, (d) transcript start, (e) transcript end, (g) strand and in column (i) are resumed the ID of the gene encoding the transcript (obtained from the gff annotation file), the length of the transcript and its coverage (reported as“note=”). In column (i) the transcripts expressed in antisense to other annotated genes are reported as“ncRNA_anti_gene ID in antisense strand”, while genes in intergenic regions are reported as “ncRNAs_ID of the closest annotated gene”.
Additional file 2: Figure S1. The transcriptome reconstruction of Naumovia castellii obtained using ORA. Histograms reporting the size distribution of the 5’ and 3’-UTR size of N. castellii (a-b) and Saccharomyces cerevisiae S288c (at 6 g/l) (c-d). Notice the small 5’-UTR size of N. castellii (54 bp on average) in comparison to S. cerevisiae (81 bp on average). Analysis of the data allowed the identification of numerous introns in the 5’-end of the genes (frequently in the 5’-UTR) (red rectangles). Some of these introns were not previously predicted. (e) (h) Analysis of the 5’-UTR size revealed some genes having an incorrect prediction of the start codon (red arrows). In (e-h) the coverage in the forward and reverse strands determined using RNA-seq are indicated with“cov. for” and “cov. rev”, the transcriptome prediction obtained using ORA is indicated with“ORA” and the gene prediction obtained from ncbi database is indicates as“genes”.
Additional file 3: Figure S2. Selected results of the transcript structure obtained for the six strains under analysis. Genes reported belong to the GO categories“sulfur compound metabolic process” and “sterol metabolic process” that are described in the main text. Genes YDR213W and YGL012W have highly conserved 5’-UTRs and were reported in order to show that gene expression level has little influence on the transcript structure prediction. The 5’-end of the transcript is on the left for genes encoded on the forward strand and on the right for genes encoded on the reverse strand. 5’-UTR is indicated by a small arrow.
Additional file 4: Table S2. Transcriptome reconstruction performed using ORA software. Each worksheet reports the trascriptome structure of a S. cerevisiae strain or a Saccharomyces sensu stricto species. The worksheets “S. cerevisiae_S288c_haploid_6gl”, “S. cerevisiae_S288c_haploid_45gl”, “S. cerevisiae_EC1118_6gl”, “S. cerevisiae_EC1118_45gl”, “S. cerevisiae_P283_6gl”, “S. cerevisiae_P283_45gl”, “S. cerevisiae_R008_6gl”, “S. cerevisiae_R008_45gl”, “S. cerevisiae_R103_6gl”, “S. cerevisiae_R103_45gl”, “S. cerevisiae_P301_6gl”, “S. cerevisiae_P301_45gl” report the transcriptome structures determined for the S. cerevisiae strains S288c, EC1118, P283, R008, R103, P301 in two points of the fermentation curve (6 and 45 g/l). The worksheets“S.
cerevisiae_S288c_diploid_1”, “S. cerevisiae_S288c_diploid_2”, “S. bayanus”, “S. paradoxus” and “S. mikatae” report the transcriptome structure determined for the Saccharomyces sensu stricto species whose transcriptomes were sequenced by Busby and coll. [6]. Each worksheet reports the output of ORA in“gff” format: in column (a) the chromosome, (d) transcript start, (e) transcript end, (g) strand and in column (i) are resumed the ID of the gene encoding the transcript (obtained from the gff annotation file), the length of the transcript and its coverage (reported as“note=”). In column (i) the transcripts expressed in antisense to other annotated genes are reported as “ncRNA_anti_gene ID in antisense strand”, while genes in intergenic regions are reported as“ncRNAs_ID of the closest annotated gene”.
Additional file 5: Table S3. Comparison between 5’-UTR length in the six strains determined using ORA software. Results were obtained analyzing data obtained at 6 g/l (worksheet“6gl_5 UTR”) and at 45 g/l (worksheet“45gl_5 UTR”). On each worksheet are reported: (a) the primary SGD ID, (b) the gene name, (c) the gene description, (d-i) 5’-UTR length, (j-o) coverage, (p) the number of pairwise comparisons where the difference in 5’-UTR length is higher than 50 bases.
Additional file 6: Figure S3. Analysis of the 5’-UTR region of ARO4 gene. (a) To verify if the RBS in ARO4 (YBR249c) promoter was differentially represented between oenological and laboratory strains, PATMAN software [52] (https://bioinf.eva.mpg.de/patman/patman-1.2. html) was used. In Freeberg and colleagues [39] the consensus sequences for RBSs were not provided, for this reason the number of RBS in the genomes was estimated allowing up to 3 mismatches in the sequence of the RBS obtained from S288c strain. Results indicate that the RBS is only slightly over-represented in S288c. Since the genome of the enological strains is not complete, results in the table were normalized
considering the length of the genomes. (b) Visual representation of the ARO4 promoter showing the predicted TATA box and the RBS. Additional file 7: Table S4. Distance between the RNA binding sites (RBS) identified by Freeberg and colleagues [38] and the 5’-UTR of the transcripts. Negative values refer to the RBS localized upstream of the 5’-end of the transcript reconstructed by ORA; these RBS are not included in the transcript of that strain in that growth condition. Worksheet“6 gl” refers to the transcript structure determined using RNA-seq reads ob-tained from the first point of the fermentation curve (early stationary), while“45 gl” refers to the transcript structure determined in the second point of the fermentation curve (mid-log phase).
Additional file 8: Figure S4. Directional reads validation. Frequency of antisense ncRNAs (named SAUTs in the paper) in highly expressed genes was determined and results are reported in (a). Frequency of genes having SAUT was calculated with respect to the coverage of the corresponding genes. Some selected images of highly expressed genes are reported (b-e) to show the high strand-specificity of the library, while two examples (f-g) are reported to show genes with high antisense transcription, SAUTs are highlighted by red boxes.
Additional file 9: Figure S5. Verification of bicistronic transcripts identified using ORA. Sixteen bicistronic transcripts were identified by ORA only in one of the two growth conditions (6 or 45 g/l) and were excluded from further investigation. This result highlights the importance of comparing transcriptome reconstruction in different growth conditions. The remaining three transcripts are reported in (a-c) and include three pairs of genes YFR033C-YFR034C, YFL057C-YFL056C and YIL165C-YIL164C. These transcripts were further verified considering two lines of evidence: the presence of polyadenylation sites previously determined (red boxes in the figure) [60] and the distribution of the paired-end reads obtained from a previous study (top of the figures) [56]. The first two bicistronic transcripts (a-b) are distinct transcripts not separated by untranscribed intergenic regions; this is evidenced by the high coverage differences, the paired-end distribution and/or the presence of polyadenylation sites. Only genes YIL165C-YIL164C seem to be transcribed in a real bicistronic transcript. Red arrows indicate putative transcription start sites.
Competing interests
The authors declare that they have no competing interests. Authors’ contributions
AS wrote the software for the transcriptome assembly with the support of LT and SC. LT growth the S. cerevisiae cells and extracted RNA for sequencing. AS, SC and LT performed the analysis. SC wrote the manuscript with the support of AS and LT. All authors read and approved the final manuscript. Acknowledgments
RNA-seq was performed at the CRIBI Biotechnology Centre (University of Padua) and we acknowledge the support of Michela D’Angelo in processing our samples. This work was supported by the University of Padua [CPDA082991] and by the Provincia di Treviso providing PhD fellowship. We express thanks to Panagiotis G. Kougias (Department of Environmental Engineering, Technical University of Denmark), Davide De Francisci (Department of Environmental Engineering, Technical University of Denmark) and Katie Powis (Department of Biochemistry, University of Fribourg) for their assistance in the manuscript revision and for helpful discussion on the paper. Author details
1Department of Biology, Division of Biochemistry, University of Fribourg,
CH-1700 Fribourg, Switzerland.2Department of Environmental Engineering, Technical University of Denmark, DK-2800 Kgs. Lyngby, Denmark.
3
Department of Biology, University of Padova, Via Ugo Bassi 58/b, 35131 Padova, Italy.
Received: 18 September 2014 Accepted: 20 November 2014 Published: 1 December 2014
References
1. Goffeau A, Barrell BG, Bussey H, Davis RW, Dujon B, Feldmann H, Galibert F, Hoheisel JD, Jacq C, Johnston M, Louis EJ, Mewes HW, Murakami Y,
Philippsen P, Tettelin H, Oliver SG: Life with 6000 genes. Science 1996, 274(5287):546. 563–7.
2. Yvert G, Brem RB, Whittle J, Akey JM, Foss E, Smith EN, Mackelprang R, Kruglyak L: Trans-acting regulatory variation in Saccharomyces cerevisiae and the role of transcription factors. Nat Genet 2003, 35(1):57–64. 3. Kvitek DJ, Will JL, Gasch AP: Variations in stress sensitivity and genomic
expression in diverse S. cerevisiae isolates. PLoS Genet 2008, 4(10):e1000223.
4. Fay JC, McCullough HL, Sniegowski PD, Eisen MB: Population genetic variation in gene expression is associated with phenotypic variation in Saccharomyces cerevisiae. Genome Biol 2004, 5(4):R26.
5. Sung HM, Wang TY, Wang D, Huang YS, Wu JP, Tsai HK, Tzeng J, Huang CJ, Lee YC, Yang P, Hsu J, Chang T, Cho CY, Weng LC, Lee TC, Chang TH, Li WH, Shih MC: Roles of trans and cis variation in yeast intraspecies evolution of gene expression. Mol Biol Evol 2009, 26(11):2533–2538. 6. Busby MA, Gray JM, Costa AM, Stewart C, Stromberg MP, Barnett D, Chuang
JH, Springer M, Marth GT: Expression divergence measured by transcriptome sequencing of four yeast species. BMC Genomics 2011, 12:635-2164-12-635.
7. Tronchoni J, Medina V, Guillamon JM, Querol A, Perez-Torrado R: Transcriptomics of cryophilic Saccharomyces kudriavzevii reveals the key role of gene translation efficiency in cold stress adaptations.
BMC Genomics 2014, 15:432-2164-15-432.
8. David L, Huber W, Granovskaia M, Toedling J, Palm CJ, Bofkin L, Jones T, Davis RW, Steinmetz LM: A high-resolution map of transcription in the yeast genome. Proc Natl Acad Sci U S A 2006, 103(14):5320–5325. 9. Nagalakshmi U, Wang Z, Waern K, Shou C, Raha D, Gerstein M, Snyder M:
The transcriptional landscape of the yeast genome defined by RNA sequencing. Science 2008, 320(5881):1344–1349.
10. Xu Z, Wei W, Gagneur J, Perocchi F, Clauder-Munster S, Camblong J, Guffanti E, Stutz F, Huber W, Steinmetz LM: Bidirectional promoters gener-ate pervasive transcription in yeast. Nature 2009, 457(7232):1033–1037. 11. Neil H, Malabat C, D’Aubenton-Carafa Y, Xu Z, Steinmetz LM, Jacquier A: Widespread bidirectional promoters are the major source of cryptic transcripts in yeast. Nature 2009, 457(7232):1038–1042.
12. Kung JT, Colognori D, Lee JT: Long noncoding RNAs: past, present, and future. Genetics 2013, 193(3):651–669.
13. Martens JA, Laprade L, Winston F: Intergenic transcription is required to repress the Saccharomyces cerevisiae SER3 gene. Nature 2004, 429(6991):571–574.
14. Martens JA, Wu PY, Winston F: Regulation of an intergenic transcript controls adjacent gene transcription in Saccharomyces cerevisiae. Genes Dev 2005, 19(22):2695–2704.
15. Hongay CF, Grisafi PL, Galitski T, Fink GR: Antisense transcription controls cell fate in Saccharomyces cerevisiae. Cell 2006, 127(4):735–745. 16. Leong HS, Dawson K, Wirth C, Li Y, Connolly Y, Smith DL, Wilkinson CR,
Miller CJ: A global non-coding RNA system modulates fission yeast protein levels in response to stress. Nat Commun 2014, 5:3947. 17. Wang Z, Gerstein M, Snyder M: RNA-Seq: a revolutionary tool for
transcriptomics. Nat Rev Genet 2009, 10(1):57–63.
18. Mortazavi A, Williams BA, McCue K, Schaeffer L, Wold B: Mapping and quantifying mammalian transcriptomes by RNA-Seq. Nat Methods 2008, 5(7):621–628.
19. Li J, Jiang H, Wong WH: Modeling non-uniformity in short-read rates in RNA-Seq data. Genome Biol 2010, 11(5):R50. -2010-11-5-r50.
20. Trapnell C, Williams BA, Pertea G, Mortazavi A, Kwan G, van Baren MJ, Salzberg SL, Wold BJ, Pachter L: Transcript assembly and quantification by RNA-Seq reveals unannotated transcripts and isoform switching during cell differentiation. Nat Biotechnol 2010, 28(5):511–515.
21. Guttman M, Garber M, Levin JZ, Donaghey J, Robinson J, Adiconis X, Fan L, Koziol MJ, Gnirke A, Nusbaum C: Ab initio reconstruction of cell type-specific transcriptomes in mouse reveals the conserved multi-exonic structure of lincRNAs. Nat Biotechnol 2010, 28(5):503–510.
22. Grabherr MG, Haas BJ, Yassour M, Levin JZ, Thompson DA, Amit I, Adiconis X, Fan L, Raychowdhury R, Zeng Q, Chen Z, Mauceli E, Hacohen N, Gnirke A, Rhind N, di Palma F, Birren BW, Nusbaum C, Lindblad-Toh K, Friedman N, Regev A: Full-length transcriptome assembly from RNA-Seq data without a reference genome. Nat Biotechnol 2011, 29(7):644–652.
23. Schulz MH, Zerbino DR, Vingron M, Birney E: Oases: robust de novo RNA-seq assembly across the dynamic range of expression levels. Bioinformatics 2012, 28(8):1086–1092.
24. Robertson G, Schein J, Chiu R, Corbett R, Field M, Jackman SD, Mungall K, Lee S, Okada HM, Qian JQ: De novo assembly and analysis of RNA-seq data. Nat Methods 2010, 7(11):909–912.
25. Martin J, Bruno VM, Fang Z, Meng X, Blow M, Zhang T, Sherlock G, Snyder M, Wang Z: Rnnotator: an automated de novo transcriptome assembly pipeline from stranded RNA-Seq reads. BMC Genomics 2010, 11:663-2164-11-663. 26. Surget-Groba Y, Montoya-Burgos JI: Optimization of de novo
transcrip-tome assembly from next-generation sequencing data. Genome Res 2010, 20(10):1432–1440.
27. Li S, Dong X, Su Z: Directional RNA-seq reveals highly complex condition-dependent transcriptomes in E. coli K12 through accurate full-length transcripts assembling. BMC Genomics 2013, 14:520-2164-14-520. 28. Novo M, Bigey F, Beyne E, Galeote V, Gavory F, Mallet S, Cambon B, Legras JL,
Wincker P, Casaregola S, Dequin S: Eukaryote-to-eukaryote gene transfer events revealed by the genome sequence of the wine yeast Saccharomyces cerevisiae EC1118. Proc Natl Acad Sci U S A 2009, 106(38):16333–16338. 29. Treu L, Toniolo C, Nadai C, Sardu A, Giacomini A, Corich V, Campanaro S:
The impact of genomic variability on gene expression in environmental Saccharomyces cerevisiae strains. Environ Microbiol 2014, 16(5):1378–1397. 30. Kellis M, Patterson N, Endrizzi M, Birren B, Lander ES: Sequencing and
comparison of yeast species to identify genes and regulatory elements. Nature 2003, 423(6937):241–254.
31. Hooks KB, Delneri D, Griffiths-Jones S: Intron evolution in Saccharomyceta-ceae. Genome Biol Evol 2014, 6(9):2543–2556.
32. Treu L, Campanaro S, Nadai C, Toniolo C, Nardi T, Giacomini A, Valle G, Blondin B, Corich V: Oxidative stress response and nitrogen utilization are strongly variable in Saccharomyces cerevisiae wine strains with different
fermentation performances. Appl Microbiol Biotechnol 2014, 98(9):4119–4135. 33. Taylor SL, Higley NA, Bush RK: Sulfites in foods: uses, analytical methods,
residues, fate, exposure assessment, metabolism, toxicity, and hypersensitivity. Adv Food Res 1986, 30:1–76.
34. Park H, Hwang YS: Genome-wide transcriptional responses to sulfite in Saccharomyces cerevisiae. J Microbiol 2008, 46(5):542–548.
35. Dickinson JR, Salgado LE, Hewlins MJ: The catabolism of amino acids to long chain and complex alcohols in Saccharomyces cerevisiae. J Biol Chem 2003, 278(10):8028–8034.
36. Hazelwood LA, Daran JM, van Maris AJ, Pronk JT, Dickinson JR: The Ehrlich pathway for fusel alcohol production: a century of research on Saccharomyces cerevisiae metabolism. Appl Environ Microbiol 2008, 74(8):2259–2266.
37. Alexandre H, Rousseaux I, Charpentier C: Ethanol adaptation mechanisms in Saccharomyces cerevisiae. Biotechnol Appl Biochem 1994, 20(Pt 2):173–183. 38. Paravicini G, Braus G, Hutter R: Structure of the ARO3 gene of
Saccharomyces cerevisiae. Mol Gen Genet 1988, 214(1):165–169. 39. Freeberg MA, Han T, Moresco JJ, Kong A, Yang YC, Lu ZJ, Yates JR, Kim JK:
Pervasive and dynamic protein binding sites of the mRNA transcriptome in Saccharomyces cerevisiae. Genome Biol 2013, 14(2):R13.
40. Scannell DR, Zill OA, Rokas A, Payen C, Dunham MJ, Eisen MB, Rine J, Johnston M, Hittinger CT: The Awesome Power of Yeast Evolutionary Genetics: New Genome Sequences and Strain Resources for the Saccharomyces sensu stricto Genus. G3 (Bethesda) 2011, 1(1):11–25. 41. Li BZ, Cheng JS, Ding MZ, Yuan YJ: Transcriptome analysis of differential
responses of diploid and haploid yeast to ethanol stress. J Biotechnol 2010, 148(4):194–203.
42. Rabitsch KP, Toth A, Galova M, Schleiffer A, Schaffner G, Aigner E, Rupp C, Penkner AM, Moreno-Borchart AC, Primig M, Esposito RE, Klein F, Knop M, Nasmyth K: A screen for genes required for meiosis and spore formation based on whole-genome expression. Curr Biol 2001, 11(13):1001–1009. 43. Maier P, Rathfelder N, Maeder CI, Colombelli J, Stelzer EH, Knop M: The
SpoMBe pathway drives membrane bending necessary for cytokinesis and spore formation in yeast meiosis. EMBO J 2008, 27(18):2363–2374. 44. Esposito MS, Esposito RE, Arnaud M, Halvorson HO: Conditional mutants of
meiosis in yeast. J Bacteriol 1970, 104(1):202–210.
45. Coluccio A, Bogengruber E, Conrad MN, Dresser ME, Briza P, Neiman AM: Morphogenetic pathway of spore wall assembly in Saccharomyces cerevisiae. Eukaryot Cell 2004, 3(6):1464–1475.
46. Heiman MG, Walter P: Prm1p, a pheromone-regulated multispanning membrane protein, facilitates plasma membrane fusion during yeast mating. J Cell Biol 2000, 151(3):719–730.
47. Suda Y, Rodriguez RK, Coluccio AE, Neiman AM: A screen for spore wall permeability mutants identifies a secreted protease required for proper spore wall assembly. PLoS ONE 2009, 4(9):e7184.
48. de Godoy LM, Olsen JV, Cox J, Nielsen ML, Hubner NC, Frohlich F, Walther TC, Mann M: Comprehensive mass-spectrometry-based proteome quantifica-tion of haploid versus diploid yeast. Nature 2008, 455(7217):1251–1254. 49. Campagna D, Albiero A, Bilardi A, Caniato E, Forcato C, Manavski S, Vitulo N,
Valle G: PASS: a program to align short sequences. Bioinformatics 2009, 25(7):967–968.
50. Li H, Handsaker B, Wysoker A, Fennell T, Ruan J, Homer N, Marth G, Abecasis G, Durbin R, 1000 Genome Project Data Processing Subgroup: The Sequence Alignment/Map format and SAMtools. Bioinformatics 2009, 25(16):2078–2079.
51. Carver T, Harris SR, Berriman M, Parkhill J, McQuillan JA: Artemis: an integrated platform for visualization and analysis of high-throughput sequence-based experimental data. Bioinformatics 2012, 28(4):464–469. 52. Prufer K, Stenzel U, Dannemann M, Green RE, Lachmann M, Kelso J:
PatMaN: rapid alignment of short sequences to large databases. Bioinformatics 2008, 24(13):1530–1531.
53. Trapnell C, Pachter L, Salzberg SL: TopHat: discovering splice junctions with RNA-Seq. Bioinformatics 2009, 25(9):1105–1111.
54. Langmead B, Trapnell C, Pop M, Salzberg SL: Ultrafast and memory-efficient alignment of short DNA sequences to the human genome. Genome Biol 2009, 10(3):R25. -2009-10-3-r25.
55. Merriman B, Ion Torrent R&D Team, Rothberg JM: Progress in ion torrent semiconductor chip based sequencing. Electrophoresis 2012, 33(23):3397–3417. 56. Levin JZ, Yassour M, Adiconis X, Nusbaum C, Thompson DA, Friedman N,
Gnirke A, Regev A: Comprehensive comparative analysis of strand-specific RNA sequencing methods. Nat Methods 2010, 7(9):709–715. 57. Campanaro S, Williams TJ, Burg DW, De Francisci D, Treu L, Lauro FM, Cavicchioli R: Temperature-dependent global gene expression in the Antarctic archaeon Methanococcoides burtonii. Environ Microbiol 2011, 13(8):2018–2038.
58. Campanaro S, Pascale FD, Telatin A, Schiavon R, Bartlett DH, Valle G: The transcriptional landscape of the deep-sea bacterium Photobacterium profundum in both a toxR mutant and its parental strain. BMC Genomics 2012, 13:567-2164-13-567.
59. Price MN, Huang KH, Alm EJ, Arkin AP: A novel method for accurate operon predictions in all sequenced prokaryotes. Nucleic Acids Res 2005, 33(3):880–892.
60. Ozsolak F, Kapranov P, Foissac S, Kim SW, Fishilevich E, Monaghan AP, John B, Milos PM: Comprehensive polyadenylation site maps in yeast and human reveal pervasive alternative polyadenylation. Cell 2010, 143(6):1018–1029. 61. Harrison P, Kumar A, Lan N, Echols N, Snyder M, Gerstein M: A small
reservoir of disabled ORFs in the yeast genome and its implications for the dynamics of proteome evolution. J Mol Biol 2002, 316(3):409–419.
doi:10.1186/1471-2164-15-1045
Cite this article as: Sardu et al.: Transcriptome structure variability in Saccharomyces cerevisiae strains determined with a newly developed assembly software. BMC Genomics 2014 15:1045.
Submit your next manuscript to BioMed Central and take full advantage of:
• Convenient online submission
• Thorough peer review
• No space constraints or color figure charges
• Immediate publication on acceptance
• Inclusion in PubMed, CAS, Scopus and Google Scholar
• Research which is freely available for redistribution
Submit your manuscript at www.biomedcentral.com/submit