Supplementary Material
Methods
Immunoblotting for anti-cystathionine--lyase (CSE; St John’s Laboratory, London, UK) was
performed as described previously (Hartmann et al. 2018). Primary antibodies were detected by using horseradish peroxidase-conjugated secondary antibodies (Cell Signaling, Danvers, MA, USA or Santa Cruz, Dallas, TX, USA). Anti--actin (Santa Cruz, Dallas, TX, USA) served as a loading control. Densitometry measurements were performed using NIH Image J software (http://rsb.info.nih.gov/nih-image), results are presented as densitometric sum.
Supplemental Tables
Table S1: Systemic physiologic parameters, as previously published in [20].
baseline 24 h Ref. Value
NoA (µg·kg-1·min-1)* Sham n=5 0.06 (0.02; 0.13) n.a. sepsis n=6 1.23 (0.66; 3.26)b Hemoglobin (g/dl) sham n=5 8.8 (8.6; 9.4) 9.2 (9.1; 9.8) 12.3-15.3 sepsis n=8 8.9 (8.5; 9.7) 11.7 (11.1; 12.3)a,b
Heart rate (bpm) sham n=5 88 (73; 104) 102 (68; 115) < 160 sepsis n=8 88 (74; 106) 156 (140; 166)a,b Mean arterial pressure (mmHg) sham n=5 100 (90; 106) 103 (94; 119) max. +/- 10% of baseline sepsis n=8 103 (91; 112) 65 (61; 81)a,b Central venous pressure (mmHg) sham n=5 8 (7; 13) 10 (9; 15)a < 18 sepsis n=8 10 (6; 13) 17 (14; 18)a Cardiac output (ml·kg-1·min-1) sham n=5 61 (52; 79) 64 (42; 92) n.a. sepsis n=8 64 (52; 69) 87 (62; 130)a
PaO2 (mmHg) sham n=5 158 (142; 180) 159 (138;177) n.a.#
sepsis n=8 170 (161; 183) 93 (62; 155)a,b PaCO2 (mmHg) sham n=5 35 (35; 39) 35 (33; 36) 35-40 sepsis n=8 38 (34; 40) 35 (32; 44) arterial pH sham n=5 7.46 (7.44; 7.46) 7.44 (7.43; 7.46) 7.35-7.45 sepsis n=8 7.45 (7.43; 7.48) 7.37 (7.19; 7.43)a,b Base excess (mmol/l) sham n=5 1.1 (0.8; 1.8) -0.1(-1.45; 0.65) -2.0 to +2.0 sepsis n=8 1.5 (0.4; 2.3) -8.5 (-14.6; -3.7) a,b
Lactate (mmol/l) sham n=5 1.4 (1.0; 1.6) 0.6 (0.6; 1.2) < 2.0 sepsis n=8 0.8 (0.6; 1.5) 6.1 (2.0; 10.7) a,b
Data given as median (interquartile range). * NoA is administered based on mean arterial pressure (see
Methods section) during the septic shock, # mechanical ventilation adjusted according to our previous
work (if PaO2/FiO2 < 300mmHg = inspiratory/expiratory ratio 1:1, PEEP 12cm H2O; if PaO2/FiO2 <
200mmHg = PEEP 15cm H2O [10,19,26]), a p<0.05 in comparison to baseline, b p<0.05 in
comparison to sham in two-way ANOVA
Table S2: Renal vein blood analysis, as previously published in [19,26].
baseline 24h peritonitis
O2 saturation (%) sham 83 (81; 83) 83 (78; 84)
sepsis 84 (78; 87) 66 (45; 83)
pH sham 7.45 (7.44; 7.45) 7.42 (7.42; 7.44)
sepsis 7.42 (7.42; 7.44) 7.28 (7.12; 7.36)a,b
sepsis 1.8 (1.0; 3.1) -4.9 (-12.0; -2.2)a,b
Lactate (mmol/l) sham 1.1 (1.0; 1.2) 1.0 (0.7; 1.2)
sepsis 1.0 (0.7; 1.4) 4.7 (2.5; 8.9)a,b
IL6 (ng/gprotein) sham 1.7 (1.3; 1.7) 6.9 (1.7; 7.9)
sepsis 2.0 (1.8; 2.1) 1153.4 (236.4; 2002.5)a,b
TNF (ng/gprotein) sham 0.8 (0.6; 1.2) 1.6 (1.3; 2.0)
sepsis 0.8 (0.7; 1.2) 15.3 (5.9; 21.7)a,b
Data given as median (interquartile range). a p<0.05 in comparison to baseline, b p<0.05 in comparison to sham in two-way ANOVA
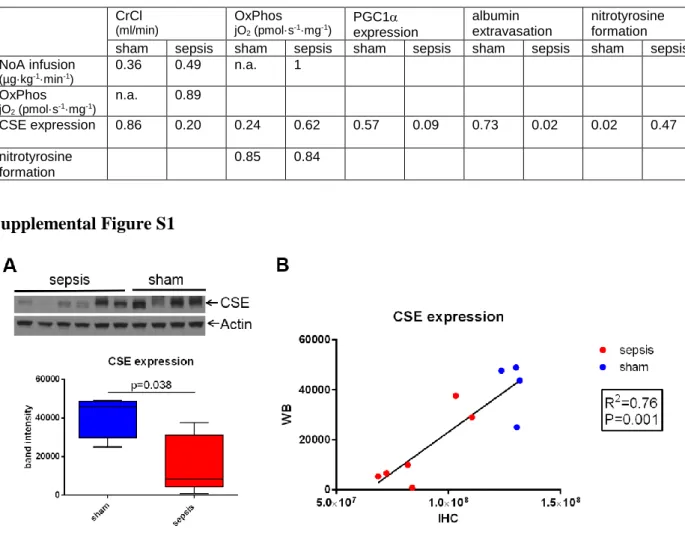
Table S3: R2 values for correlations with (unpooled) separate groups, respectively.
CrCl (ml/min) OxPhos jO2 (pmol·s-1·mg-1) PGC1 expression albumin extravasation nitrotyrosine formation sham sepsis sham sepsis sham sepsis sham sepsis sham sepsis NoA infusion (µg·kg-1·min-1) 0.36 0.49 n.a. 1 OxPhos jO2 (pmol·s-1·mg-1) n.a. 0.89 CSE expression 0.86 0.20 0.24 0.62 0.57 0.09 0.73 0.02 0.02 0.47 nitrotyrosine formation 0.85 0.84
Supplemental Figure S1
Figure S1: Kidney CSE protein expression levels for sham vs. sepsis, detected by western blot (WB, A) correlate with kidney CSE expression levels detected by immunohistochemistry (IHC, B).
References
Hartmann C, Gröger M, Noirhomme JP, Scheuerle A, Möller P, Wachter U, Huber-Lang M Nussbaum B, Jung B, Merz T, McCook O, Kress S, Stahl B, Calzia E, Georgieff M, Radermacher P, Wepler M. In-Depth Characterization of the Effects of Cigarette Smoke Exposure on the Acute Trauma Response and Hemorrhage in Mice. Shock. 2018. Volume Publish Ahead of Print.
![Table S2: Renal vein blood analysis, as previously published in [19,26].](https://thumb-eu.123doks.com/thumbv2/123doknet/14829198.618924/1.892.105.819.1046.1169/table-s-renal-vein-blood-analysis-previously-published.webp)